

01 POWER ISLAND / 02 H2+NH3 / IEA 2022 NetZeroby2050-ARoadmapfortheGlobalEnergySector
.pdfin the coming years is in emerging market and developing economies; they may expect financial support from advanced economies. Each month from 2030 to 2050, the NZE implies an additional 10 industrial plants equipped with CCUS, three additional fully hydrogen based industrial plants and 2 GW of extra electrolyser capacity at industrial sites. While challenging, this is achievable. For comparison, about 12 heavy industrial facilities were built from scratch on average per month in China alone from 2000 to 2015. By 2050, nearly all production in heavy industry is with near zero emissions technologies.
Decisive action from governments is imperative to achieve clean energy transitions in heavy industry at the scale and pace envisioned in the NZE. Within the next two years, governments in advanced economies will need to take decisions about funding for R&D for critical near zero emissions industrial technologies and for mitigating the investment risks associated with demonstrating them at scale. This should lead to at least two or three commercial demonstration projects for each technology in different regions, and to market deployment by the mid 2020s. International co ordination and co operation would facilitate better use of resources and help prevent gaps in funding.
Governments also need to take early decisions on large scale deployment of near zero emissions technologies. By 2024 in advanced economies and 2026 in emerging market and developing economies, governments should have in place a strategy for incorporating near zero emissions technologies into the next series of capacity additions and replacements for steel and chemical plants, which should include decisions about whether to pursue CCUS, hydrogen or a combination of both. If they are to succeed, those strategies need to include concrete plans for developing and financing the necessary infrastructure for CCUS and/or hydrogen, together with clean electricity generation for hydrogen production. The construction of the required infrastructure should begin as soon as possible given the long lead times involved.
Within a similar timeframe, governments of countries that produce cement should decide how to develop the necessary CCUS infrastructure for that sub sector, including the necessary legal and regulatory frameworks. Importing countries should make plans to move progressively to exclusive use of low emissions cement, which may involve the need to support the development of CCUS equipped facilities elsewhere in order to ensure supplies and to avoid a disproportionate burden being placed on other countries.
Strategies must be underpinned by specific policies. By 2025, all countries should have a long term CO2 emissions reduction policy framework in place to provide certainty that the next wave of investment in capacity additions will feature near zero emissions technologies. Successful strategies are likely to require initial measures such as carbon contracts for difference, public procurement and incentives to encourage private sector procurement. As new technologies are deployed and costs decline, there is likely to be a strong case by about 2030 for replacing these initial measures with others such as CO2 taxes, emissions trading systems and emissions performance standards. Financing support for near zero emissions capacity additions may also have an important role to play through measures such as low interest and concessional loans and blended finance, as well as through contributions by
130 |
International Energy Agency | Special Report |

advanced economies to funds that support projects in emerging market and developing economies. Strategies should also include measures to reduce industrial emissions through material efficiency, for example by revising design regulations, adopting incentives to promote longer product and building lifetimes, and improving systems for collecting and sorting materials for recycling.
There is a strong case for an international agreement on the transition to near zero emissions for globally traded products by the mid 2020s so as to establish a level playing field.
Alternatively, countries may need to resort to measures to shield domestic near zero 3 emissions production from competition from products that create emissions. Any such policy
would need to be designed to respect the regulatory frameworks governing international trade, such as those of the World Trade Organization.
Even with accelerated innovation timelines and strong policies in place, some high emitting capacity additions will be needed to meet demand in the next decade before near zero emissions technologies are available. It would make sense for governments to require any new capacity to incorporate retrofit ready designs so that unabated capacity added in the next few years has the technical capacity and space requirement to integrate near zero emissions technologies in coming years. Beyond 2030, investment in the NZE is confined to innovative near zero emissions process routes.
Governments should not overlook the need for measures to spur deployment of already available near zero emissions technologies in light manufacturing industries. Adopting a carbon price and then sufficiently increasing the price over time – through carbon taxes or emissions trading systems for larger manufacturers – may be the simplest way to achieve that objective. Other regulatory measures such as tradeable low carbon fuel and emissions standards could yield the same outcome, but may involve greater administrative complexity. Technology mandates are likely to be needed to achieve the energy efficiency savings in the NZE, such as minimum energy performance standards for new motors and boilers. Tailored programmes and incentives for small and medium enterprises could also play a helpful role.
3.6Transport
3.6.1Energy and emission trends in the Net Zero Emissions Scenario
The global transport sector emitted over 7 Gt CO2 in 2020, and nearly 8.5 Gt in 2019 before the Covid 19 pandemic.7 In the NZE, transport sector CO2 emissions are slightly over 5.5 Gt in 2030. By 2050 they are around 0.7 Gt – a 90% drop relative to 2020 levels. CO2 emissions decline even with rapidly rising passenger travel, which nearly doubles by 2050, and rising freight activity, which increases by two and a half times from current levels, and an increase in the global passenger car fleet from 1.2 billion vehicles in 2020 to close to 2 billion in 2050.
7 Unless otherwise noted, CO2 emissions reported here are direct emissions from fossil fuel combusted during the operation of vehicles.
Chapter 3 | Sectoral pathways to net-zero emissions by 2050 |
131 |
IEA. All rights reserved.
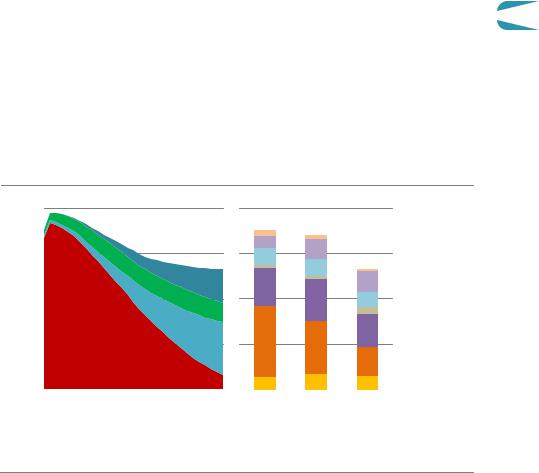
The transport modes do not decarbonise at the same rate because technology maturity varies markedly between them (Figure 3.21). CO2 emissions from two/three wheelers almost cease by 2040, followed by cars, vans and rail in the late 2040s. Emissions from heavy trucks, shipping and aviation fall by an annual average of 6% between 2020 and 2050, but still collectively amount to more than 0.5 Gt CO2 in 2050. This reflects projected activity growth and that many of the technologies needed to reduce CO2 emissions in long distance transport are currently under development and do not start to make substantial inroads into the market in the coming decade.
Figure 3.21 Global CO2 transport emissions by mode and share of emissions reductions to 2050 by technology maturity in the NZE
Gt CO2
4
3
2
1
CO emissionsby mode |
Technologymaturityby mode |
100%
75%
50%
25%
2010 |
2020 |
2030 |
2040 |
2050 |
|
Heavy |
Shipping |
Aviation |
||||
|
Light duty vehicles |
|
Heavy trucks |
|
trucks |
|
|
|
|
|||
|
|
|
Mature |
|
|
Market uptake |
||||||
|
|
|
|
|
||||||||
|
Other road |
|
|
Shipping |
|
|
|
|
||||
|
|
|
|
|
|
|
||||||
|
|
|
|
|
|
|
|
|
|
|||
|
Aviation |
|
|
Rail |
|
|
Demonstration |
|
Prototype |
|||
|
|
|
|
|
|
|||||||
|
|
|
|
|||||||||
|
|
|
|
|
|
|||||||
IEA. All rights reserved.
Passenger cars can make use of low-emissions technologies on the market, but major advances are needed for heavy trucks, shipping and aviation to reduce their emissions
Notes: Other road = two/three wheelers and buses. Shipping and aviation include both domestic and international operations. See Box 2.4 for details on the maturity categories.
Decarbonisation of the transport sector in the NZE relies on policies to promote modal shifts and more efficient operations across passenger transport modes (see sections 2.5.7 and 4.4.3),8 as well as improvements in energy efficiency. It also depends on two major technology transitions: shifts towards electric mobility (electric vehicles [EVs] and fuel cell electric vehicles [FCEVs])9 and shifts towards higher fuel blending ratios and direct use of
8 Examples of efficient operations include: seamless integration of various modes (inter modality) and “Mobility as a Service” in passenger transport; logistics measures in road freight, e.g. backhauling, night time deliveries, real time routing; slow steaming in shipping; and air traffic management, e.g. landing and take off scheduling in aviation.
9 EVs include battery electric vehicles, plug in hybrid electric gasoline vehicles and plug in hybrid electric diesel vehicles. FCEVs contain a battery and electric motor and are capable of operating without tailpipe emissions.
132 |
International Energy Agency | Special Report |
low carbon fuels (biofuels and hydrogen based fuels). These shifts are likely to require interventions to stimulate investment in supply infrastructure and to incentivise consumer uptake.
Transport has traditionally been heavily reliant on oil products, which accounted for more than 90% of transport sector energy needs in 2020 despite inroads from biofuels and electricity (Figure 3.22). In the NZE, the share of oil drops to less than 75% in 2030 and slightly over 10% by 2050. By the early 2040s, electricity becomes the dominant fuel in the transport
sector worldwide in the NZE: it accounts for nearly 45% of total final consumption in 2050, 3 followed by hydrogen based fuels (28%) and bioenergy (16%). Biofuels almost reach a 15% blending share in oil products by 2030 in road transport, which reduces oil needs by around
4.5 million barrels of oil equivalent per day (mboe/d). Beyond 2030, biofuels are increasingly used for aviation and shipping, where the scope for using electricity and hydrogen is more limited. Hydrogen carriers (such as ammonia) and low emissions synthetic fuels also supply increasing shares of energy demand in these modes.
Figure 3.22 Global transport final consumption by fuel type and mode in the NZE
Consumptionby fuel |
Consumptionby mode |
||
120 |
Modes |
||
EJ |
|
|
Other |
|
|
||
|
|
|
Aviation |
|
|
|
|
90 |
|
|
Shipping |
|
|
||
|
|
Rail |
|
|
|
||
|
|
Heavy trucks |
|
|
|
|
|
LDVs |
|
|
|
60 |
|
Other road |
|
||
|
||
|
|
|
|
|
|
|
|
|
|
|
Fuels |
||
|
|
|
|
|
|
|
|
|
|
|
Hydrogen |
|
|
|
|
|
|
|
|
|
|
|
|
30 |
|
|
|
|
|
|
|
|
|
|
based fuels |
|
|
|
|
|
|
|
|
|
|
|
Bioenergy |
|
|
|
|
|
|
|
|
|
|
|
|
|
|
|
|
|
|
|
|
|
|
|
Electricity |
|
|
|
|
|
|
|
|
|
|
|
|
|
|
|
|
|
|
|
|
|
|
|
Fossil fuels |
|
|
|
|
|
|
|
|
|
|
|
|
|
|
|
|
|
|
|
|
|
|
|
|
|
|
|
|
|
|
|
|
|
|
|
|
2020 |
2030 |
2040 |
2050 |
2020 |
2030 |
2050 |
|
|
|
||
IEA. All rights reserved.
Electricity and hydrogen-based fuels account for more than 70% of transport energy demand by 2050
Note: LDVs = Light duty vehicles; Other road = two/three wheelers and buses.
Road vehicles
Electrification plays a central role in decarbonising road vehicles in the NZE. Battery cost declines of almost 90% in a decade have boosted sales of electric passenger cars by 40% on average over the past five years. Battery technology is already relatively commercially competitive. FCEVs start to make inroads in the 2020s in the NZE. The electrification of heavy trucks moves more slowly due to the weight of the batteries, high energy and power
Chapter 3 | Sectoral pathways to net-zero emissions by 2050 |
133 |
IEA. All rights reserved.
requirements required for charging, and limits on driving ranges. But fuel cell heavy trucks make significant progress, mainly after 2030 (Figure 3.23). The number of battery electric, plug in hybrid and fuel cell electric light duty vehicles (cars and vans) on the world’s roads reaches 350 million in 2030 and almost 2 billion in 2050, up from 11 million in 2020. The number of electric two/three wheelers also rises rapidly, from just under 300 million today to 600 million in 2030 and 1.2 billion in 2050. The electric bus fleet expands from 0.5 million in 2020 to 8 million in 2030 and 50 million in 2050.
Figure 3.23 Global share of battery electric, plug-in hybrid and fuel cell electric vehicles in total sales by vehicle type in the NZE
Light dutyvehicles |
Heavytrucks |
Two/three wheelers |
100%
80%
60%
40%
20%
2020 |
2030 |
2050 |
2020 |
2030 |
2050 |
2020 |
2030 |
2050 |
||||
|
Battery electric |
|
Plug in hybrid electric |
|
|
Fuel cell electric |
||||||
|
|
|
||||||||||
|
|
|
||||||||||
IEA. All rights reserved.
Sales of battery electric, plug-in hybrid and fuel cell electric vehicles soar globally
Note: Light duty vehicles = passenger cars and vans; Heavy trucks = medium and heavy freight trucks.
Light duty vehicles are electrified faster in advanced economies over the medium term and account for around 75% of sales by 2030. In emerging and developing economies, they account for about 50% of sales. Almost all light duty vehicle sales in advanced economies are battery electric, plug in hybrid or fuel cell electric by the early 2030s and in emerging and developing economies by the mid 2030s.
For heavy trucks that operate over long distances, currently biofuels are the main viable commercial alternative to diesel, and they play an important role in lowering emissions from heavy duty trucks over the 2020s. Beyond 2030, the number of electric and hydrogen powered heavy trucks increases in the NZE as supporting infrastructure is built and as costs decline (lower battery costs, energy density improvements and lower costs to produce and deliver hydrogen) (IEA, 2020b). This coincides with a reduction in the availability of sustainable bioenergy, as limited supplies increasingly go to hard to abate segments such as aviation and shipping, though biofuels still meet about 10% of fuel needs for heavy duty trucks in 2050 (see Chapter 2). Advanced economies have a higher market share of battery
134 |
International Energy Agency | Special Report |
electric and fuel cell electric heavy duty trucks sales in 2030, more than twice the level in emerging market and developing economies, although this gap closes towards 2050.
Figure 3.24
density |
0.25% |
|
0.20% |
||
Probability |
||
0.15% |
||
|
||
|
0.10% |
|
|
0.05% |
Heavy trucks distribution by daily driving distance, 2050
Fuel cell |
3 |
electric |
Battery
electric
0 200 400 600 800 1 000 Daily driving distance (km)
IEA. All rights reserved.
Driving distance is the key factor affecting powertrain choice for trucks
Realising the objectives of the NZE depends on rapid scaling up of battery manufacturing (current announced production capacity for 2030 would cover only 50% of required demand in that year), and on the rapid introduction on the market of next generation battery technology (solid state batteries) between 2025 and 2030. Electrified road systems using conductive or inductive power transfer to provide electricity to trucks offer an alternative for battery electric and fuel cell electric trucks on long distance operations, but these systems too would need rapid development and deployment.
Aviation10
The NZE assumes that air travel, measured in revenue passenger kilometres, increases by only around 3% per year to 2050 relative to 2020. This compares with about around 6% over the 2010 19 period. The NZE assumes that aviation growth is constrained by comprehensive government policies that promote a shift towards high speed rail and rein in expansion of long haul business travel, e.g. through taxes on commercial passenger flights (see section 2.5.2).
Global CO2 emissions from aviation rise in the NZE from about 640 Mt in 2020 (down from around 1 Gt in 2019) to a peak of 950 Mt by around 2025. Emissions then fall to 210 Mt in 2050 as the use of low emissions fuels grows. Emissions are hard to abate because aviation
10 Aviation considered here includes both domestic and international flights. While the focus here is on commercial passenger aviation, dedicated freight and general (military and private) aviation, which collectively account for more than 10% of fuel use and emissions, are also included in the energy and emissions accounting.
Chapter 3 | Sectoral pathways to net-zero emissions by 2050 |
135 |
IEA. All rights reserved.

requires fuel with a high energy density. Emissions in aviation comprise just over 10% of unabated CO2 emissions from fossil fuels and industrial processes in 2050.
In the NZE, the global use of jet kerosene declines to about 3 EJ in 2050 from 9 EJ in 2020 (and around 14.5 EJ in 2019 before the Covid 19 crisis), and its share of total energy use falls from almost 100% to just over 20%. The use of sustainable aviation fuel (SAF) starts to increase significantly in the late 2020s. In 2030, around 15% of total fuel consumption in aviation is SAF, most of which is biojet kerosene (a type of liquid biofuel). This is estimated to increase the ticket price for a mid haul flight (1 200 km) by about USD 3 per passenger. By 2050, biojet kerosene meets 45% of total fuel consumption in aviation and synthetic hydrogen based fuels meet about 30%. This is estimated to increase the ticket price for a mid haul flight in 2050 by about USD 10 per passenger. The NZE also sees the adoption of commercial battery electric and hydrogen aircraft from 2035, but they account for less than 2% of fuel consumption in 2050.
Operational improvements, together with fuel efficiency technologies for airframes and engines, also help to reduce CO2 emissions by curbing the pace of fuel demand growth in the NZE. These improvements are incremental, but revolutionary technologies such as open rotors, blended wing body airframes and hybridisation could bring further gains and enable the industry to meet the International CiviI Aviation Organization’s (ICAO) ambitious 2050 efficiency targets (IEA, 2020b).
Maritime shipping11
Maritime shipping was responsible for around 830 Mt CO2 emissions worldwide in 2020 (880 Mt CO2 in 2019), which is around 2.5% of total energy sector emissions. Due to a lack of available low carbon options on the market and the long lifetime of vessels (typically 25 35 years), shipping is one of the few transport modes that does not achieve zero emissions by 2050 in the NZE. Nevertheless, emissions from shipping decline by 6% annually to 120 Mt CO2 in 2050.
In the short term, there is considerable potential for curbing fuel consumption in shipping through measures to optimise operational efficiency and improve energy efficiency. Such approaches include slow steaming and the use of wind assistance technologies (IEA, 2020b). In the medium to long term, significant emissions reductions are achieved in the NZE by switching to low carbon fuels such as biofuels, hydrogen and ammonia. Ammonia looks likely to be a particularly good candidate for scaling up, and a critical fuel for long range transoceanic journeys that need fuel with high energy density.
Ammonia and hydrogen are the main low carbon fuels for shipping adopted over the next three decades in the NZE, their combined share of total energy consumption in shipping reaching around 60% in 2050. The 20 largest ports in the world account for more than half of global cargo (UNCTAD, 2018); they could become industrial hubs to produce hydrogen and
11 Maritime shipping here includes both domestic and international operations.
136 |
International Energy Agency | Special Report |
ammonia for use in both chemical and refining industries, as well as for refuelling ships. |
|
Internal combustion engines for ammonia fuelled vessels are currently being developed by |
|
two of the largest manufacturers of maritime engines and are expected to become available |
|
on the market by 2024. Sustainable biofuels provide almost 20% of total shipping energy |
|
needs in 2050. Electricity plays a very minor role, as the relatively low energy density of |
|
batteries compared with liquid fuels makes it suitable only for shipping routes of up to |
|
200 km. Even with an 85% increase in battery energy density in the NZE as solid state |
|
batteries come to market, only short distance shipping routes can be electrified. |
3 |
|
Rail
Rail transport is the most energy efficient and least carbon intensive way to move people and second only to shipping for carrying goods. Passenger rail almost doubles its share of total transport activity to 20% by 2050 in the NZE, with particularly rapid growth in urban and high speed rail (HSR), the latter of which contributes to curbing growth in air travel. Global CO2 emissions from the rail sector fall from 95 Mt CO2 in 2020 (100 Mt CO2 in 2019) to almost zero by 2050 in the NZE, driven primarily by rapid electrification.
Figure 3.25 Global energy consumption by fuel and CO2 intensity in non-road sectors in the NZE
Rail |
Maritimeshipping |
Aviation |
100%
80%
50 |
gCO/MJ |
|
40 |
||
|
60% |
|
|
|
|
|
|
|
|
|
|
|
|
|
|
|
30 |
|
40% |
|
|
|
|
|
|
|
|
|
|
|
|
|
|
|
20 |
|
|
|
|
|
|
|
|
|
|
|
|
|
|
|
|
|||
20% |
|
|
|
|
|
|
|
|
|
|
|
|
|
|
|
10 |
|
|
|
|
|
|
|
|
|
|
|
|
|
|
|
|
|
|
|
2020 |
2030 |
2040 |
2050 |
2020 |
2030 |
2040 |
2050 |
2020 |
2030 |
2040 |
2050 |
|
|||||
Oil Gas Bioenergy |
Hydrogen |
Ammonia |
Electricity |
Synthetic fuel |
CO intensity (right axis) |
||||||||||||
IEA. All rights reserved.
Railways rely heavily on electricity to decarbonise, while shipping and aviation curb emissions mainly by switching to low-emissions fuels
Note: Synthetic fuel = low emissions synthetic hydrogen based fuels.
In the NZE, all new tracks on high throughput corridors are electrified from now on, while hydrogen and battery electric trains, which have recently been demonstrated in Europe, are adopted on rail lines where throughput is too low to make electrification economically viable. Oil use, which accounted for 55% of total energy consumption in the rail sector in 2020, falls to almost zero in 2050: it is replaced by electricity, which provides over 90% of rail energy needs and by hydrogen which provides another 5%.
Chapter 3 | Sectoral pathways to net-zero emissions by 2050 |
137 |
IEA. All rights reserved.

3.6.2Key milestones and decision points
Table 3.4 Key milestones in transforming the global transport sector
Category
Road transport
Aviation and shipping
2035: no new passenger internal combustion engine car sales globally
Implementation of strict carbon emissions intensity reduction targets as soon as possible.
|
Category |
|
2020 |
|
2030 |
|
2050 |
|
|
|
|
|
|
||||
|
Road transport |
|
|
|
|
|
|
|
|
Share of PHEV, BEV and FCEV in sales: cars |
5% |
64% |
100% |
|
|||
|
two/three wheelers |
40% |
85% |
100% |
|
|||
|
bus |
3% |
60% |
100% |
|
|||
|
vans |
0% |
72% |
100% |
|
|||
|
heavy trucks |
0% |
30% |
99% |
|
|||
|
Biofuel blending in oil products |
5% |
13% |
41% |
|
|||
|
|
|
|
|
|
|
|
|
|
Rail |
|
|
|
|
|
|
|
|
Share of electricity and hydrogen in total energy consumption |
43% |
65% |
96% |
|
|||
|
Activity increase due to modal shift (index 2020=100) |
100 |
100 |
130 |
|
|||
|
|
|
|
|
|
|
|
|
|
Aviation |
|
|
|
|
|
|
|
|
Synthetic hydrogen based fuels share in total aviation energy consumption |
0% |
2% |
33% |
|
|||
|
Biofuels share in total aviation energy consumption |
0% |
16% |
45% |
|
|||
|
Avoided demand from behaviour measures (index 2020=100) |
0 |
20 |
38 |
|
|||
|
Shipping |
|
|
|
|
|
|
|
|
Share in total shipping energy consumption: Ammonia |
0% |
8% |
46% |
|
|||
|
Hydrogen |
0% |
2% |
17% |
|
|||
|
Bioenergy |
0% |
7% |
21% |
|
|||
|
|
|
|
|
|
|
|
|
|
Infrastructure |
|
|
|
|
|
|
|
|
EV public charging (million units) |
1.3 |
40 |
200 |
|
|||
|
Hydrogen refuelling units |
540 |
18 000 |
90 000 |
|
|||
|
Share of electrified rail lines |
34% |
47% |
65% |
|
|||
Note: PHEV = plug in hybrid electric vehicles; BEV = battery electric vehicles; FCEV = fuel cell electric vehicles.
Electrification is the main option to reduce CO2 emissions from road and rail modes, the technologies are already on the market and should be accelerated immediately, together with the roll out of recharging infrastructure for EVs. Deep emission reductions in the hard to abate sectors (heavy trucks, shipping and aviation) require a massive scale up of the required technologies over the next decade, which today are largely at the prototype and demonstration stages, together with plans for the development of associated infrastructure, including hydrogen refuelling stations.
138 |
International Energy Agency | Special Report |

The transformation of transport required to be on track to reduce emissions in line with the |
|
|
NZE calls for a range of government decisions over the next decade. In the next few years, |
|
|
all governments need to eliminate fossil fuel subsidies and encourage switching to low |
|
|
carbon technologies and fuels across the entire transport sector. Before 2025, governments |
|
|
need to define clear R&D priorities for all the technologies that can contribute to decarbonise |
|
|
transport in line with their strategic priorities and needs. Ideally this would be informed by |
|
|
international dialogue and collaboration. R&D is critical in particular for battery technology, |
|
|
which should be an immediate priority. |
3 |
|
To achieve the emissions reductions required by the NZE, governments also need to move |
||
|
||
quickly to signal the end of sales of new internal combustion engine cars. Early commitments |
|
|
would help the private sector to make the necessary investment in new powertrains, relative |
|
|
supply chains and refuelling infrastructure (see section 4.3.4). This is particularly important |
|
|
for the supply of battery metals, which require long term planning (IEA, 2021a). |
|
|
By 2025, the large scale deployment of EV public charging infrastructure in urban areas |
|
|
needs to be sufficiently advanced to allow households without access to private chargers to |
|
|
opt for EVs. Governments should ensure sustainable business models for companies |
|
|
installing chargers, remove barriers to planning and construction, and put in place regulatory, |
|
|
fiscal and technological measures to enable and encourage smart charging, and to ensure |
|
|
that EVs support electricity grid stability and stimulate the adoption of variable renewables |
|
|
(IEA, 2021b). |
|
|
For heavy trucks, battery electric trucks are just beginning to become available on the |
|
|
market, and fuel cell electric technologies are expected to come to market in the next few |
|
|
years. Working in collaboration with truck manufacturers, governments should take steps in |
|
|
the near term to prioritise the rapid commercial adoption of battery electric and fuel cell |
|
|
electric trucks. By 2030, they should take stock of the competitive prospects for these |
|
|
technologies, so as to focus R&D on the most important challenges and allow adequate time |
|
|
for strategic infrastructure deployment, thus paving the way for large scale adoption during |
|
|
the 2030s. |
|
|
Governments need to define their strategies for low carbon fuels in shipping and aviation by |
|
|
2025 at the latest, given the slow turnover rate of the fleets, after which they should rapidly |
|
|
implement them. International co operation and collaboration will be crucial to success. |
|
|
Priority action should target the most heavily used ports and airports so as to maximise the |
|
|
impact of initial investment. Harbours near industrial areas are ideally placed to become low |
|
|
carbon fuel hubs. |
|
Chapter 3 | Sectoral pathways to net-zero emissions by 2050
139 |
IEA. All rights reserved. |