

01 POWER ISLAND / 02 H2+NH3 / IEA 2022 NetZeroby2050-ARoadmapfortheGlobalEnergySector
.pdf4.4.2Affordability
Total spending on energy
Energy affordability is a key concern for governments, businesses and households. Global direct spending on energy, i.e. the total fuel bills paid by all end users, which totalled USD 6.3 trillion in 2020, increases by 45% to 2030 and 75% to 2050, in large part reflecting population and GDP growth over this period. As a share of global GDP, the figures look rather different: total direct spending on energy holds steady at around 8% out to 2030 (similar to the average over the last five years), but then declines to 6% in 2050. This decline offsets a significant share of the higher cost of buying new, more efficient energy consuming equipment.
A portion of the increase in energy spending in the NZE is related to rising CO2 prices and the removal of consumption subsidies for fossil fuels and electricity. CO2 pricing (taxes and trading schemes) paid by end users at its peak generates global revenues in the NZE of close to USD 700 billion each year between 2030 and 2035, before declining steadily due to declining overall emissions: these revenues could be recycled into economies or otherwise used to improve consumer welfare, particularly for low income households. The NZE also sees the progressive removal of consumption subsidies for fossil fuels, many of which disproportionally benefit wealthier segments of the population that use more of the subsidised fuel. Phasing out the subsidies would provide more efficient price signals for consumers, and spur more energy conservation and measures to improve energy efficiency. The impact of phasing out subsidies on lower income households could be offset through direct payment schemes or other means at lower overall costs to the economy.
Figure 4.13 Global energy spending by fuel in the NZE
Trillion USD (2019)
10
8
6
4
2
100%
80%
60%
40%
20%
2010 |
2020 |
2030 |
2040 |
2050 |
2010 |
2020 |
2030 |
2040 |
2050 |
|||||||
|
Oil products |
|
Natural gas |
|
Coal |
|
Electricity |
|
|
Bioenergy |
|
Other |
||||
|
|
|
|
|
|
|||||||||||
|
|
|
|
|
|
|||||||||||
IEA. All rights reserved.
Total energy spending increases by 75% to 2050, mainly on electricity
Note: Other = hydrogen based and synthetic fuels, and district heating.
170 |
International Energy Agency | Special Report |
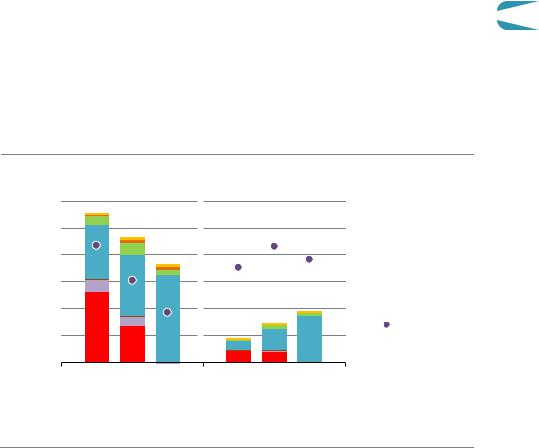
The transformation of the global energy system in the NZE drives a major shift in the |
|
composition of energy spending. Spending on electricity at USD 2.7 trillion in 2020 (45% of |
|
total energy spending) exceeded spending on oil products for the first time and it rises to |
|
over USD 8.5 trillion in 2050 (80% of total energy spending) (Figure 4.13). Retail electricity |
|
prices increase by 50% on average, contributing to the total increase. Spending on oil, which |
|
has dominated overall energy spending for decades, goes into long term decline in the |
|
2020s, its share of spending falling from 40% in 2020 to just 5% in 2050. Spending on natural |
|
gas and coal also declines in the long term, offset by higher spending on low emissions fuels. |
|
Spending on bioenergy reaches about USD 900 billion per year by 2040, while other low |
|
emissions fuels, including hydrogen based products, gain a foothold and establish a market |
4 |
worth of around USD 600 billion per year by 2050. |
Household spending on energy
Direct spending by households on energy, including for heating, cooling, electricity and fuel for passenger cars, falls as a share of disposable income in the NZE, though there are large differences between countries (Figure 4.14).
Figure 4.14 Average annual household energy bill in the NZE
USD (2019)
Advanced economies |
Emergingmarket and |
|
|
|
developing economies |
|
|
3 000 |
6% |
|
Hydrogen based |
|
|||
|
|
|
|
2 500 |
5% |
|
District heating |
|
|||
|
|||
|
Bioenergy |
||
2 000 |
4% |
|
|
|
|||
|
Electricity |
||
|
|||
|
|||
1 500 |
3% |
|
Coal |
|
|||
|
|||
|
Natural gas |
||
|
|
|
|
|
|
|
|
1 000 |
2% |
|
Oil products |
|
|||
|
|||
500 |
1% |
|
Share of income |
|
(right axis) |
2020 |
2030 |
2050 |
2020 |
2030 |
2050 |
IEA. All rights reserved.
The proportion of disposable household income spent on energy is stable in emerging market and developing economies, and drops substantially in advanced economies
Note: Hydrogen based includes hydrogen, ammonia and synthetic fuels.
In advanced economies, the average annual bill declines from about USD 2 800 in 2020 to USD 2 300 in 2030, thanks to a strong push on energy efficiency and cost effective electrification. Oil products make up close to half of household energy bills in 2020, but this falls to 30% in 2030 and almost zero in 2050, due to a rapid shift to EVs and to downward pressure on oil prices. Natural gas bills, which make up almost 10% of the total today, also
Chapter 4 | Wider implications of achieving net-zero emissions |
171 |
IEA. All rights reserved.
fall to almost zero in 2050 with the electrification of heating and cooking. Electricity rises from about 35% of household fuel bills in 2020 to 90% in 2050, increasing the sensitivity of households to electricity prices and consumption. Increasing incomes mean that household spending on energy as a share of disposable income drops from 4% in 2020 to 2% in 2050.
In emerging market and developing economies, there is a huge increase in demand for modern energy services linked to expanding populations, economic growth, rising incomes and universal access to electricity and clean cooking options. As in advanced economies, electricity accounts for the vast majority of energy bills in 2050. The use of more efficient appliances and equipment curbs some of the increase in demand, but household bills still increase in the NZE by over 60% to 2030 and more than double by 2050. As a percentage of disposable income, however, bills in emerging market and developing economies remain around 4%, and there are large social and economic benefits from increased energy use.
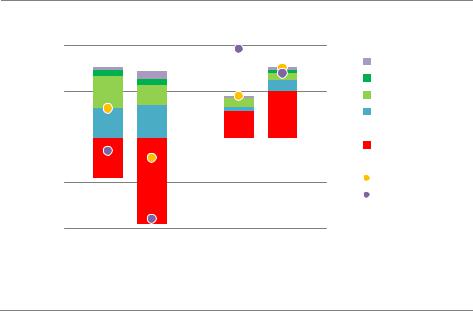
Figure 4.15 Change in household spending on energy plus energy-related investment in the NZE relative to 2020
USD (2019)
|
Advanced |
Emergingmarket and |
|
|||
|
economies |
developingeconomies |
|
|||
1 000 |
|
|
|
2% |
Investmentrecovery |
|
|
|
|
|
|
|
Other |
500 |
|
|
|
1% |
Renewables |
|
|
|
|
Energy efficiency |
|||
|
|
|
|
|
|
Electrification |
0 |
|
|
|
0% |
Variablecosts |
|
|
|
|
|
|
|
Energy bill per |
|
|
|
|
|
|
household |
500 |
|
|
|
1% |
Net change |
|
|
|
|
Net change share of |
|||
|
|
|
|
|
|
|
|
|
|
|
|
|
disposable income |
1 000 |
|
|
|
2% |
(right axis) |
|
2030 |
2050 |
2030 |
2050 |
|
|
|
IEA. All rights reserved.
Total household spending on energy increases modestly in emerging market and developing economies, leaving over 90% of additional income available for other uses
Taking into account additional investment in electricity consuming equipment such as efficient appliances and electric vehicles, spending on energy plus related investment is USD 1.30 higher per day per household globally in 2050 than in 2020 in the NZE. This modest increase means that expenditure on energy makes up a smaller share of disposable income in 2050 than it does today, though the impacts vary by country. In advanced economies, additional investment in electrification, energy efficiency and renewable energy costs about USD 750 per household by 2030 and USD 720 in 2050, which is fully offset by reductions in the level of energy bills (Figure 4.15). In emerging market and developing economies, a
172 |
International Energy Agency | Special Report |

growing basket of energy services means increased use of energy, and total energy related household spending increases. Additional investment moderates the change in energy bills, with the result that total energy related spending takes 2 percentage points more of household disposable income in 2030 and 1 percentage point more in 2050 than today.
4.4.3Behavioural changes
Behavioural changes play an important part in reducing energy demand and emissions in the NZE, especially in sectors where technical options for cutting emissions are limited in 2050. While it is citizens and companies that modify their behaviour, the changes are mostly
enabled by the policies and investments made by governments, and in some instances, they 4 are required by laws or regulations. The Covid 19 pandemic has increased general awareness
of the potential effectiveness of behavioural changes, such as mask wearing, and working and schooling at home. The crisis demonstrated that people can make behavioural changes at significant speed and scale if they understand the changes to be justified, and that it is necessary for governments to explain convincingly and to provide clear guidance about what changes are needed and why they are needed.
Figure 4.16 Emissions reductions from policy-driven and discretionary behavioural changes by citizens and companies in the NZE
Mt CO
|
Citizens |
|
|
Companies |
|
2030 |
2040 |
2050 |
2030 |
2040 |
2050 |
|
|
|
|
|
|
500
1 000
1 500
|
Influenced or mandated by policies |
|
Discretionary behavioural changes |
|
|
||
|
|
IEA. All rights reserved.
Three-quarters of the emissions saved by behavioural changes could be directly influenced or mandated by government policies
Around three quarters of the emissions saved by behavioural changes between 2020 and 2050 in the NZE could be directly influenced or mandated by government policy (Figure 4.16). They include mitigation measures such as phasing out polluting cars from large cities and reducing speed limits on motorways. The other one quarter involves more discretionary behavioural changes, such as reducing wasteful energy use in homes and
Chapter 4 | Wider implications of achieving net-zero emissions |
173 |
IEA. All rights reserved.
offices, though even these types of changes could be promoted through awareness campaigns and other means. Around 10% of emissions savings directly influenced or mandated by government policy would require new or redirected investment in infrastructure. For example, the shift in the NZE from regional flights to high speed rail would necessitate building around 170 000 kilometres of new track globally by 2050 (a tripling of 2020 levels).
Behavioural changes made by citizens and companies play a roughly equal role in reducing emissions in the NZE. Most changes in road transport and energy saving in homes would depend on individuals, whereas the private sector has the primary role in reducing energy demand in commercial buildings and pursuing materials efficiency in manufacturing. Companies can also influence behavioural changes indirectly, for example, by promoting the use of public transport by employees that commute or encouraging working from home. However, a simple distinction between the role for individuals and companies masks a complex underlying dynamic: it is ultimately citizens as consumers of energy related goods and services who shape corporate strategies, but at the same time companies do much to influence and generate consumer demand through marketing and advertising. In the NZE, consumers and companies move together in adopting behavioural changes, with governments setting the direction of those changes and facilitating them via effective and sustained policy support.
The behavioural changes in the NZE happen to different extents in different regions, and reflect a range of geographical and infrastructure constraints, as well as existing behavioural norms and cultural preferences. In countries with low rates of car ownership or energy service demand in buildings, many of the behavioural changes in advanced economies in NZE would not be relevant or appropriate. As a result, around half of the emissions savings from behavioural changes are in emerging market and developing economies, despite around 95% of activity growth in buildings and road transport between 2020 and 2050 occurring there. Nevertheless, there are significant opportunities in emerging market and developing economies for materials efficiency and urban design to decouple growth in economic prosperity and energy services from increases in emissions. For example, around 85% of CO2 emissions reductions from cement and steel making in 2050 are due to gains in materials efficiency in emerging market and developing economies.
Cities are important to the behavioural changes in the NZE. Urban design can reduce the average city dweller’s carbon footprint by up to 60% by shaping lifestyle choices and influencing day to day behaviour. For example, compact cities with clustered amenities can shorten average trip lengths; digitalisation can help shared private mobility to become the de facto option to accommodate much of the growth in service demand; and urban green infrastructure can reduce cooling demand (Feyisa, Dons & Meilby, 2014).
174 |
International Energy Agency | Special Report |
4.5 |
Governments |
|
4.5.1 |
Energy security |
|
Energy security is an important consideration for governments and those they serve, and the |
|
|
pathway to net zero emissions must take account of it. Concerns about energy security have |
|
|
traditionally been associated with oil and natural gas supplies. The drop in oil and gas |
|
|
demand and the increased diversity of the energy sources used in the NZE may reduce some |
|
|
risks, but they do not disappear. There are also new potential vulnerabilities associated with |
|
|
the need to maintain reliable, flexible and secure electricity systems, and with the increase |
|
|
in demand for raw minerals for clean energy technologies. Improving energy efficiency |
4 |
|
remains the central measure for increasing energy security – even with rapid growth in low |
||
emissions electricity generation, the safest energy supplies are those that are not needed.
Oil and gas security
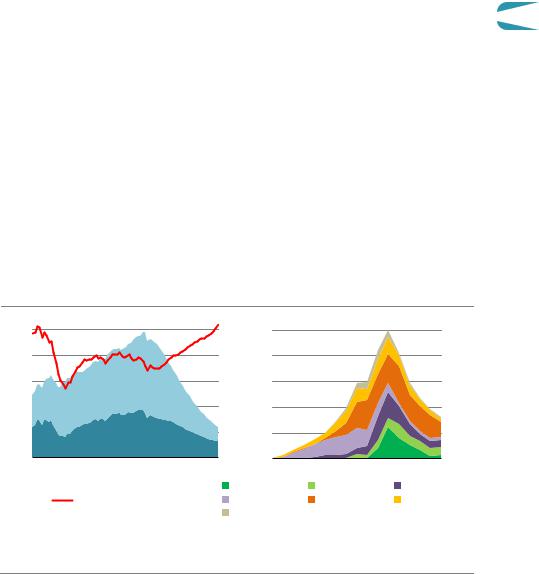
No new oil and natural gas fields are required in the NZE beyond those already approved for development, and supplies become increasingly concentrated in a small number of low cost producers. For oil, OPEC’s share of global oil supply grows from around 37% in recent years to 52% in 2050, a level higher than at any point in the history of oil markets (Figure 4.17). For natural gas, inter regional liquefied natural gas (LNG) trade increases from 420 bcm in 2020 over the next five years but it then falls to around 160 bcm in 2050. Nearly all exports in 2050 come from the lowest cost and lowest emissions producers. This means that the importance of ensuring adequate supplies of oil and natural gas to the smooth functioning of the global energy system would be quantitatively lower in 2050 than today, but it does not suggest that the risk of a shortfall in supply or sudden price rise is necessarily going to diminish, and a shortfall or sudden price rise would still have large repercussions for a number of sectors.
Figure 4.17 Global oil supply and LNG exports by region in the NZE
100 |
Oil(mb/d) |
|
50% |
LNG exports (bcm) |
500 |
||
|
|
|
|
|
|||
80 |
|
|
40% |
|
|
|
400 |
60 |
|
|
30% |
|
|
|
300 |
40 |
Non OPEC |
|
20% |
|
|
|
200 |
|
|
|
|
|
|||
20 |
OPEC |
|
10% |
|
|
|
100 |
|
|
|
|
|
|
|
|
1971 |
2010 |
2050 |
1971 |
1990 |
2010 |
2030 |
2050 |
|
|
|
North America |
Russia |
|
Australia |
|
|
Share of OPEC (right axis) |
|
Southeast Asia |
Middle East |
Africa |
|
|
|
|
|
Other |
|
|
|
|
IEA. All rights reserved.
Increased reliance on OPEC and other producer economies suffering from falling oil and gas revenues could pose a risk to supply security in consuming countries
Chapter 4 | Wider implications of achieving net-zero emissions |
175 |
IEA. All rights reserved.

Even if the timing and ambition of emission reduction policies are clear, the changes in the NZE clearly have implications for producers and consumers alike. Many producer economies would see oil and gas revenues drop to some of the lowest ever levels (see section 4.2.2). Even if these producers increase their market share, and diversify their economies and sources of tax revenue, they are likely to struggle to finance essential spending at current levels. This could have knock on effects for social stability, and that in turn could potentially threaten the smooth delivery of oil and gas to consuming countries. Moves on the part of producer economies to gain market share or a failure to maintain upstream operations while managing the extreme strains that would be placed on their fiscal balances could lead to turbulent and volatile markets, greatly complicating the task facing policy makers.
Electricity security
The rapid electrification of all sectors in the NZE, and the associated increase in electricity’s share of total final consumption from 20% in 2020 to nearly 50% in 2050, puts electricity even more at the heart of energy security across the world than it already is (IEA, 2020h). Greater reliance on electricity has both positive and negative implications for overall energy security. One advantage for energy importing countries is that they become more self sufficient, since a much higher share of electricity supply is based on domestic sources in the NZE than is the case for other fuels. However the increased importance of electricity means that any electricity system disruption would have larger impacts. Electricity infrastructure is often more vulnerable to physical shocks such as extreme weather events than pipelines and underground storage facilities, and climate change is likely to put increasing pressure on electricity systems, for example through more frequent droughts that might decrease the availability of water for hydropower and for cooling at thermal power plants. The resilience of electricity systems needs to be enhanced to mitigate these risks and maintain electricity security, including through more robust contingency planning, with solutions based on digital technologies and physical system hardening (IEA, 2021b).
Cybersecurity could pose an even greater risk to electricity security as systems incorporate more digitalised monitoring and controls in a growing number of power plants, electricity network assets and storage facilities. Policy makers have a central part to play in ensuring that the cyber resilience of electricity is enhanced, and there are a number of ways in which they can pursue this (IEA, 2021c).
Maintaining electricity security also requires a range of measures to ensure flexibility, adequacy and reliability at all times. Enhanced electricity system flexibility is of particular importance as the share of variable renewables in the generation mix rises. As a consequence, electricity system flexibility quadruples globally in the NZE in parallel with a more than two and a half fold increase in electricity supply.9 A portfolio of flexibility sources
– including power plants, energy storage and demand response supported by electricity
9 Electricity system flexibility is quantified here based on hour to hour ramping needs, which is only one aspect of flexibility that also includes actions on much shorter time scales to maintain frequency and other ancillary services.
176 |
International Energy Agency | Special Report |
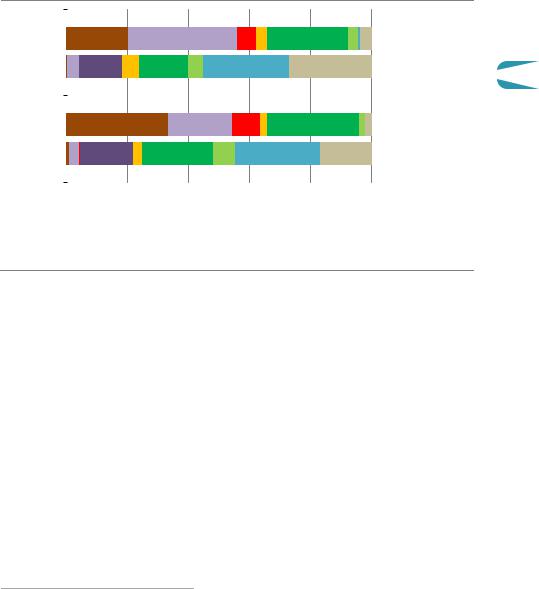
networks – is used to match supply and demand at all times of the year, under varying weather conditions and levels of demand. There is a significant shift in the NZE from using coal and gas fired power plants for the provision of flexibility to the use of renewables, hydrogen, battery storage, and demand side response (Figure 4.18).
Figure 4.18 Electricity system flexibility by source in the NZE
Advanced |
economies |
|
|
|
|
|
|
|
Coal |
|
|
|
|
|
|
|
|||
2020 |
|
|
|
|
|
|
Natural gas |
||
|
|
|
|
|
|
|
|
||
|
|
|
|
|
|
|
|
|
Oil |
|
|
|
|
|
|
|
|
|
|
|
|
2050 |
|
|
|
|
|
|
Hydrogen based |
|
|
|
|
|
|
|
|
||
|
|
|
|
|
|
|
|
Nuclear |
|
|
|
|
|
|
|
|
|
|
|
Emergingmarketand |
economiesdeveloping |
|
|
|
|
|
|
|
Hydro |
|
|
|
|
|
|
|
|||
|
|
|
|
|
|
|
Other renewables |
||
|
|
|
|
|
|
|
|||
|
|
|
|
|
|
|
Batteries |
||
|
|
|
|
|
|
|
|||
2020 |
|
|
|
|
|
|
Demand response |
||
|
|
|
|
|
|
|
|
||
|
|
|
|
|
|
|
|
||
|
|
2050 |
|
|
|
|
|
|
|
|
|
|
|
|
|
|
|
|
|
|
|
20% |
40% |
60% |
80% |
100% |
|
||
|
|
|
|
|
|
|
|
IEA. All rights reserved. |
|
To meet four-times the amount of hour-to-hour flexibility needs,
batteries and demand response step up to become the primary sources of flexibility
Electricity demand also becomes much more flexible as a result of the use of demand response measures, e.g. to shift consumption to times when renewable energy is plentiful. Conventional sources of demand response such as moderating industry activities remain important, but new areas of demand response such as smart charging of EVs unlock valuable new ways of supplementing them.10 As the EV fleet expands in the NZE, EVs provide a significant portion of total electricity system flexibility. Although the technology already exists, the roll out of smart charging has been slow to date due to institutional and regulatory barriers; these hurdles are overcome in the NZE. Measures are also implemented to ensure that the digitalisation of charging and other sources of flexibility does not compromise cybersecurity, and that potential social acceptance issues are addressed.
Energy storage also plays an important role in the provision of flexibility in the NZE. The deployment of battery storage systems is already starting to accelerate and to contribute to the management of short duration flexibility needs, but the massive scale up to 3 100 GW of storage in 2050 (with four hour duration on average) envisaged in the NZE hinges on overcoming current regulatory and market design barriers. Pumped hydropower offers an attractive means of providing flexibility over a matter of hours and days, while hydrogen has
10 Smart chargers share real time data with a centralised platform to allow system operators to optimise charging profiles based on how much energy the vehicle needs over a specified span of time, how much is available, the price of wholesale electricity, grid congestion and other parameters.
Chapter 4 | Wider implications of achieving net-zero emissions |
177 |
4
IEA. All rights reserved.

the potential to play an important part in longer term seasonal storage since it can be stored in converted gas storage facilities that have several orders of magnitude more capacity than battery storage projects.
Dispatchable power is essential to the secure transition of electricity systems, and in the NZE this comes increasingly from low emissions sources. Hydropower provides a significant part of flexibility in many electricity systems today, and this continues in the future, with particular emphasis on expanding pumped hydro facilities. Nuclear power and geothermal plants, though designed for baseload generation, also provide a degree of flexibility in the NZE, but there are constraints on how much these sources can be expanded. This leaves an important role for thermal power plants that are equipped with carbon capture or use low emissions fuels. For example, the use of sustainable biomass or low emissions ammonia in existing coal plants offers a way of allowing these facilities to continue to contribute to flexibility and capacity adequacy, while at the same time reducing CO2 emissions. Additional measures will also be necessary to maintain power system stability (Box 4.1).
Box 4.1 Power system stability with high shares of variable renewables
Stability is a key feature of electricity security, allowing systems to remain in balance and withstand disturbances such as sudden generator or grid outages. Historically, conventional generators such as nuclear, hydro and fossil fuels have been central to electricity system stability, providing inertia with rotating machines that allow stored kinetic energy to be instantly converted into power in case of a system disturbance, and generating a voltage signal that helps all generators remain synchronous.
In contrast, newer technologies such as solar PV, wind and batteries are connected to the system through converters. They generally do not contribute to system inertia and are configured as “grid following” units, synchronising to conventional generators. Maintaining system stability will call for new approaches as the share of converter based resources, and in particular variable renewables, rises much higher in electricity systems.
There is a growing body of knowledge and studies on stability in systems with high shares of variable renewables. For example, a recent joint study by the IEA and RTE, the transmission system operator in France, analyses the conditions under which it would be technically feasible to integrate high shares of variable renewables in France (IEA, 2021d). Based on the findings of this study:
One option to ensure stability for a net zero power system is to maintain a minimum amount of conventional generation from low carbon technologies during hours of high shares VRE output. This approach to maintain stability comes at the cost of solar and wind curtailment at high shares.
Updated grid codes can be used to call for variable renewables and batteries to provide fast frequency response services, which can help reduce the amount of conventional generation needed for stability.
178 |
International Energy Agency | Special Report |

Synchronous condensers are able to provide inertia without generating electricity. The technology is already proven at GW scale in Denmark and also in South Australia, but experience needs to be expanded at larger scale.
Grid forming converters can allow variable renewables and batteries to generate a voltage signal, though experience with this approach needs to move beyond micro grids and small islands to large interconnected systems.
Demonstration projects, stakeholder consultations and international collaboration will |
|
be critical to fully understand the merits of each of these four approaches and the scope |
|
for a portfolio of options that would most cost effectively achieve net zero emissions |
4 |
while maintaining electricity security. |
Electricity networks support and enable the use of all sources of flexibility, balancing demand and supply over large areas. Timely investment in grids to minimise congestion and expand the size of the areas where supply and demand are balanced will be critical to making the best use of solar PV and wind projects, and ensuring affordable and reliable supplies of electricity. Expanding long distance transmission also makes a key contribution in the NZE, since a lack of available land near demand centres and other factors mean new sources of generation are often located in remote areas. It is important that new transmission systems are built with variable, bidirectional operation in mind in order to maximise the use of available flexibility sources, and that regulatory and market arrangements support flexible connections between systems. The key value of interconnections comes from complementary electricity demand and wind patterns: solar PV output is more highly correlated than wind over large areas.
The NZE sees a major increase in demand for critical minerals such as copper, lithium, nickel, cobalt and rare earth elements that are essential for many clean energy technologies. There are several potential vulnerabilities that could hinder the adequate supply of these minerals and lead to price volatility (IEA, 2021a). Today’s production and processing operations for many minerals are highly concentrated in a small number of countries, making supplies vulnerable to political instability, geopolitical risks and possible export restrictions. In many cases, there are also concerns about land use changes, competition for scarce water resources, corruption and misuse of government resources, fatalities and injuries to workers, and human rights abuses, including the use of child labour. New critical mineral projects can have long lead times, so the rapid increase in demand in the NZE could lead to a mismatch in timing between supply and demand. The international trade and investment regime is key to maintaining reliable mineral supplies, but policy support and international co ordination will be needed to ensure the application of rigorous environmental and social regulations.
Chapter 4 | Wider implications of achieving net-zero emissions
179
IEA. All rights reserved.