

01 POWER ISLAND / 02 H2+NH3 / IEA 2022 NetZeroby2050-ARoadmapfortheGlobalEnergySector
.pdfretrofits play an important role where there are storage opportunities. In advanced economies, gas fired plants with CCUS play a bigger role, providing dispatchable electricity at relatively low cost in regions with cheap natural gas and existing networks. In 2030, around 50 GW of coal fired power plants (4% of the total at that time) and 30 GW of natural gas power plants (1% of the total) are equipped with CCUS, and this rises to 220 GW of coal (almost half of the total) and 170 GW of natural gas (7% of the total) capacity in 2050. A further 30% of CO2 captured in 2050 comes from fuel transformation, including hydrogen and biofuels production as well as oil refining. The remaining 10% is from DAC, which is rapidly scaled up from several of pilot projects today to 90 Mt CO2 per year in 2030 and just under 1 Gt CO2 per year by 2050.
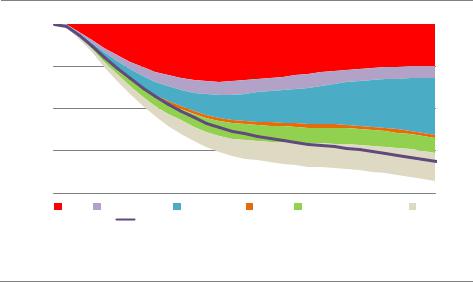
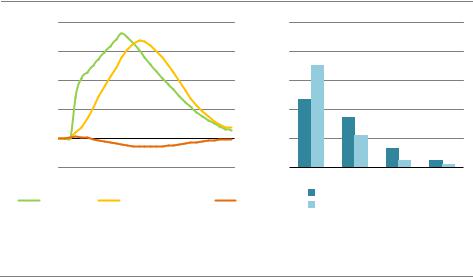
Figure 2.21 Global CO2 capture by source in the NZE
Gt CO
8 |
|
|
|
|
|
|
|
Other |
||
|
|
|
|
|
|
|
|
|
|
Direct air capture |
|
|
|
|
|
|
|
|
|
|
|
|
|
|
|
|
|
|
|
|
|
|
|
|
|
|
|
|
|
|
|
Fuel supply |
|
6 |
|
|
|
|
|
|
|
|
|
Hydrogen production |
|
|
|
|
|
|
|
|
|
||
|
|
|
|
|
|
|
|
|
||
|
|
|
|
|
|
|
|
|
Biofuels production |
|
|
|
|
|
|
|
|
|
|
|
|
|
|
|
|
|
|
|
|
|
|
|
|
|
|
|
|
|
|
|
|
|
Other |
|
|
|
|
|
|
|
|
|
|
|
|
|
|
|
|
|
|
|
|
|
|
4 |
|
|
|
|
|
|
|
Industry |
||
|
|
|
|
|
|
|
|
|
|
Industry combustion |
|
|
|
|
|
|
|
|
|
|
|
|
|
|
|
|
|
|
|
|
|
Industry processes |
|
|
|
|
|
|
|
|
|
|
|
|
|
|
|
|
|
|
|
|
|
|
2 |
|
|
|
|
|
|
|
Electricitysector |
||
|
|
|
|
|
|
|
|
|
Bioenergy |
|
|
|
|
|
|
|
|
|
|
|
|
|
|
|
|
|
|
|
|
|
|
|
|
|
|
|
|
|
|
|
|
|
Gas |
|
|
|
|
|
|
|
|
|
|
|
|
|
|
|
|
|
|
|
|
|
|
|
|
|
|
|
|
|
|
|
|
Coal |
|
|
|
|
|
|
|
|
|
|
|
|
|
|
|
|
|
|
|
|
|
|
|
|
|
|
|
|
|
|
|
|
|
2020 |
2025 |
2030 |
2035 |
2040 |
2045 |
2050 |
|
|
|
|
IEA. All rights reserved.
By 2050, 7.6 Gt of CO2 is captured per year from a diverse range of sources. A total of 2.4 Gt CO2 is captured from bioenergy use and DAC, of which 1.9 Gt CO2 is permanently stored.
Table 2.9 |
Key global milestones for CCUS |
|
|
|
||
|
|
|
|
2020 |
2030 |
2050 |
Total CO2 captured (Mt CO2) |
|
|
40 |
1 670 |
7 600 |
|
|
|
|
|
|
|
|
CO2 captured from fossil fuels and processes |
|
|
39 |
1 325 |
5 245 |
|
Power |
|
|
|
3 |
340 |
860 |
Industry |
|
|
|
3 |
360 |
2 620 |
Merchant hydrogen production |
|
|
3 |
455 |
1 355 |
|
Non biofuels production |
|
|
30 |
170 |
410 |
|
|
|
|
|
|
|
|
CO2 captured from bioenergy |
|
|
1 |
255 |
1 380 |
|
Power |
|
|
|
0 |
90 |
570 |
Industry |
|
|
|
0 |
15 |
180 |
Biofuels production |
|
|
1 |
150 |
625 |
|
|
|
|
|
|
|
|
Direct air capture |
|
|
|
0 |
90 |
985 |
Removal |
|
|
|
0 |
70 |
630 |
|
|
|
||||
80 |
|
International Energy Agency | Special Report |
||||
2.6Investment
The radical transformation of the global energy system required to achieve net zero CO2 emissions in 2050 hinges on a big expansion in investment and a big shift in what capital is spent on. The NZE expands annual investment in energy from just over USD 2 trillion globally
on average over the last five years to almost USD 5 trillion by 2030 and to USD 4.5 trillion by 2 2050 (Figure 2.22).17 Total annual capital investment in energy in the NZE rises from around
2.5% of global GDP in recent years to about 4.5% in 2030 before falling back to 2.5% by 2050.
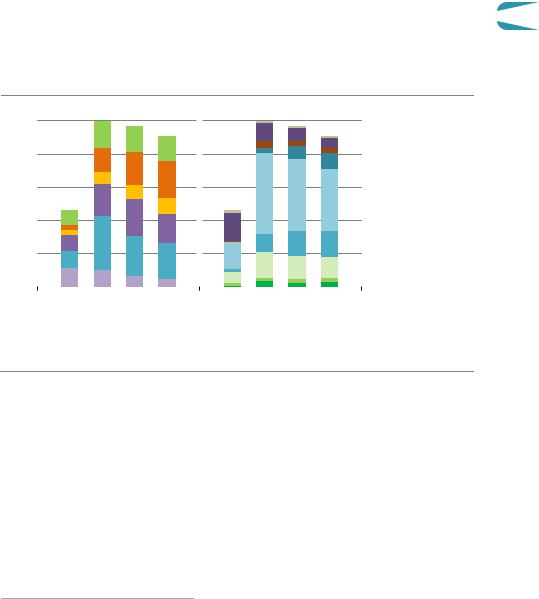
Figure 2.22 Annual average capital investment in the NZE
Trillion USD (2019)
5 |
By sector |
By technologyarea |
Technologyarea |
||
|
|
|
|
Other |
|
|
|
|
|
||
|
|
|
|
|
Fossil fuels |
|
|
|
|
|
|
4 |
|
|
|
|
CCUS |
|
|
|
|
||
|
|
|
|
Hydrogen |
|
|
|
|
|
||
|
|
|
|
|
Electricity system |
|
|
|
|
|
|
|
|
|
|
|
|
3 |
|
|
|
|
Electrification |
|
|
|
|
||
|
|
|
|
Efficiency |
|
|
|
|
|
||
|
|
|
|
|
|
|
|
|
|
|
Other renewables |
|
|
|
|
|
|
2 |
|
|
|
|
Bioenergy |
|
|
|
|
||
|
|
|
Sector |
||
|
|
|
|
||
|
|
|
|
|
Buildings |
|
|
|
|
|
|
1 |
|
|
|
|
Transport |
|
|
|
|
||
|
|
|
|
|
Industry |
|
|
|
|
|
|
|
|
|
|
|
|
|
|
|
|
|
Infrastructure |
|
|
|
|
|
|
|
|
|
|
|
Electricity generation |
|
|
|
|
|
|
|
2016 20 2030 2040 2050 |
2016 20 2030 2040 2050 |
|||
|
|
|
Fuel production |
||
|
|
|
|||
|
|
|
|||
IEA. All rights reserved.
Capital investment in energy rises from 2.5% of GDP in recent years to 4.5% by 2030; the majority is spent on electricity generation, networks and electric end-user equipment
Notes: Infrastructure includes electricity networks, public EV charging, CO2 pipelines and storage facilities, direct air capture and storage facilities, hydrogen refuelling stations, and import and export terminals for hydrogen, fossil fuels pipelines and terminals. End use efficiency investments are the incremental cost of improving the energy performance of equipment relative to a conventional design. Electricity systems include electricity generation, storage and distribution, and public EV charging. Electrification investments include spending in batteries for vehicles, heat pumps and industrial equipment for electricity based material production routes.
The shift in what capital is spent on leads to annual investment in electricity generation rising from just over USD 500 billion over the last five years to more than USD 1 600 billion in 2030, before falling back as the cost of renewable energy technologies continues to decline. Annual nuclear investment rises too: it more than doubles by 2050 compared with current levels. Annual investment in fuel supply however drops from about USD 575 billion on average over
17 Investment levels presented in this report include a broader accounting of efficiency improvements in buildings than reported in the IEA World Energy Investment (IEA, 2020c) and so differ from the numbers presented there.
Chapter 2 | A global pathway to net-zero CO emissions in 2050 |
81 |
IEA. All rights reserved.
the last half decade to USD 315 billion in 2030 and USD 110 billion in 2050. The share of fossil fuel supply in total energy sector investment drops from its 25% level in recent years to just 7% by 2050: this is partly offset by the rise in spending on low emissions fuel supply, such as hydrogen, hydrogen based fuels and bioenergy. Annual investment in these fuels increases to nearly USD 140 billion in 2050. Investment in transport increases significantly in the NZE from USD 150 per year in recent years to more than USD 1 100 billion in 2050: this stems mainly from the upfront cost of electric cars compared with conventional vehicles despite the decline in the cost of batteries.
By technology area, electrification is the dominant focus in the NZE. In addition to more investment in electricity generation, there is a huge increase in investment in expansion and modernisation of electricity networks. Annual investment rises from USD 260 billion on average in recent years to around USD 800 billion in 2030 and remains about that level to 2050. Such investment is needed to ensure electricity security in the face of rising electricity demand and the proportion of variable generation in the power mix. There is also a large increase in investment in the electrification of end use sectors, which includes spending on EV batteries, heat pumps and electricity based industrial equipment. In addition to investment in electrification, there is a moderate increase in investment in hydrogen to 2030 as production facilities are scaled up, and larger increases after as hydrogen use in transport expands: annual investment in hydrogen, including production facilities, refuelling stations and end user equipment, reaches USD 165 billion in 2030 and over USD 470 billion in 2050. There is also an increase in global investment in CCUS (annual investment exceeds USD 160 billion by 2050 and in efficiency (around USD 640 billion annual investment by 2050, mostly for deep building retrofits and efficient appliances in the industry and buildings sectors).
Financing the investment needed in the NZE involves redirecting existing capital towards clean energy technologies and substantially increasing the overall level of investment in energy. Most of this increase in investment comes from private sources, mobilised by public policies that create incentives, set appropriate regulatory frameworks and reform energy taxes. However, direct government financing is also needed to boost the development of new infrastructure projects and to accelerate innovation in technologies that are in the demonstration or prototype phase today. Projects in many emerging market and developing economies are often relatively reliant on public financing, and policies that ensure a predictable flow of bankable projects have an important role in boosting private investment in these economies, as does the scaling up of concessional debt financing and the use of development finance. There are extensive cross country co operation efforts in the NZE to facilitate the international flow of capital.
The large increase in capital investment in the NZE is partly compensated for by lower operating expenditure. Operating costs account today for a large share of the total cost of upstream fuel supply projects and fossil fuel generation projects: the clean technologies that play an increasing role in the NZE are characterised by much lower operating costs.
82 |
International Energy Agency | Special Report |
2.7Key uncertainties
The road to net zero emissions is uncertain for many reasons: we cannot be sure how underlying economic conditions will change, which policies will be most effective, how people and businesses will respond to market and policy signals, or how technologies and
their costs will evolve from within or outside the energy sector. The NZE therefore is just one 2 possible pathway to achieve net zero emissions by 2050. Against this background, this
section looks at what the implications would be if the assumptions in the NZE turn out to be off the mark with respect to behavioural change, bioenergy and CCUS for fossil fuels. These three areas were selected because the assumptions made about them involve a high degree of uncertainty and because of their critical contributions to achieve net zero emissions by 2050.
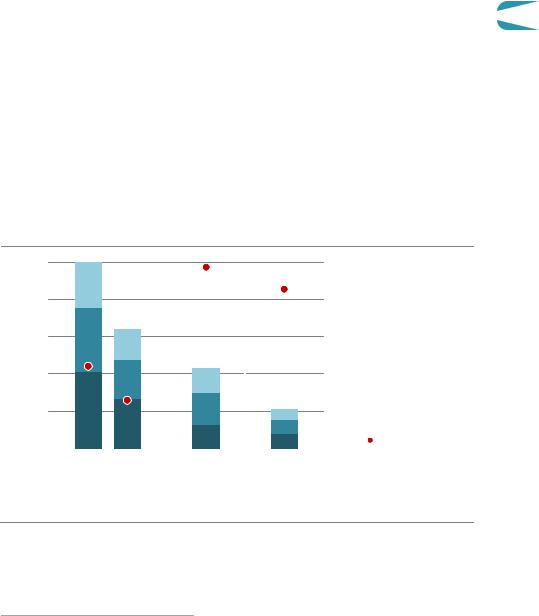
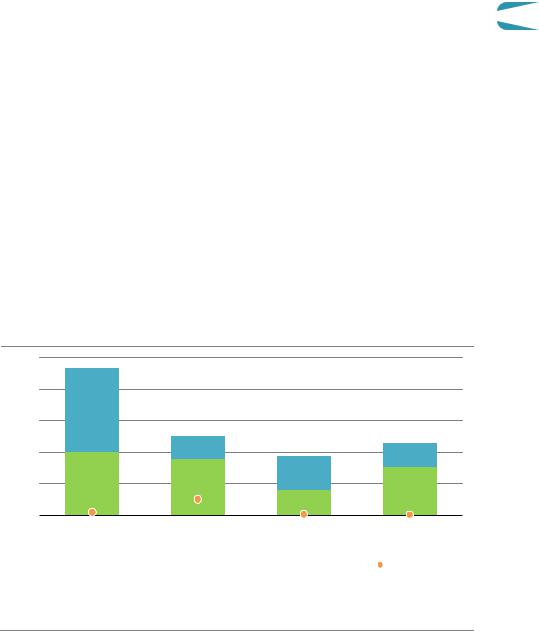
Figure 2.23 Additional electricity demand in 2050 and additional investment between 2021-2050 for selected areas of uncertainty
Thousand TWh
|
|
Electricitydemand |
|
|
Investment |
||
13 |
|
20% |
(2019) |
16 |
20% |
||
10 |
|
16% |
12 |
16% |
|||
|
|
|
|
USD |
|
|
|
8 |
|
12% |
|
12% |
|||
|
Trillion |
8 |
|||||
5 |
|
8% |
8% |
||||
|
|
|
|
|
|
|
|
3 |
|
4% |
|
4 |
4% |
||
|
|
|
|||||
|
|
|
|
|
|
|
|
|
No |
Restricted Low fossil |
|
|
No Restricted Low fossil |
||
|
behaviour bioenergy CCUS |
|
|
behaviour bioenergy CCUS |
|||
 Increase from NZE (right axis)
IEA. All rights reserved.
The absence of behaviour change, restrictions on bioenergy use and failure to develop fossil fuel CCUS would each raise investment to meet net-zero emissions by USD 4-15 trillion
Notes: No behaviour assumes none of the behavioural changes included in the NZE. Restricted bioenergy assumes no increase in land use for bioenergy production. Low fossil CCUS assumes no increase in fossil fuel based CCUS apart from projects already approved or under construction.
Our analysis clearly highlights that more pessimistic assumptions would add considerably to both the costs and difficulty of achieving net zero emissions by 2050 (Figure 2.23).
Behavioural changes are important in reducing energy demand in transport, buildings and industry. If the changes in behaviour assumed in the NZE were not attainable, emissions would be around 2.6 Gt CO2 higher in 2050. Avoiding these emissions through the use of additional low carbon electricity and hydrogen would cost an additional USD 4 trillion.
Chapter 2 | A global pathway to net-zero CO emissions in 2050 |
83 |
IEA. All rights reserved.
Bioenergy use grows by 60% between 2020 and 2050 in the NZE and land use for its propagation increases by around 25%. Bioenergy use in 2050 in the NZE is well below current best estimates of global sustainable bioenergy potential, but there is a high degree of uncertainty concerning this level. If land use for bioenergy remains at today’s level, bioenergy use in 2050 would be around 10% lower, and achieving net zero emissions in 2050 would require USD 4.5 trillion extra investment.
A failure to develop CCUS for fossil fuels would substantially increase the risk of stranded assets and would require around USD 15 trillion of additional investment in wind, solar and electrolyser capacity to achieve the same level of emissions reductions. It could also critically delay progress on BECCS and DACCS: if these cannot be deployed at scale, then achieving net zero emissions by 2050 would be very much harder.
2.7.1Behavioural change
Impact of behavioural changes in selected sectors in the NZE
Changes in the behaviour of energy consumers play an important role in cutting CO2 emissions and energy demand growth in the NZE. Behavioural changes reduce global energy demand by 37 EJ in 2050, a 10% reduction in energy demand at that time, and without them cumulative emissions between 2021 and 2050 would be around 10% higher (Figure 2.24). Behavioural change plays a particularly important role in the transport sector.
Figure 2.24 Reduction in total final consumption due to behavioural changes by fuel in the NZE
2020 |
2030 |
2040 |
2050 |
||
|
|
|
|
|
|
EJ
10 |
|
|
|
|
3% |
20 |
|
|
|
|
6% |
30 |
|
|
|
|
9% |
40 |
|
|
|
|
12% |
Oil |
Natural gas |
Electricity |
Heat |
Modern bioenergy |
Other |
|
Change in final energy consumption (right axis) |
|
|||
IEA. All rights reserved.
The impact of behaviour changes and materials efficiency on final energy consumption increases over time
Note: Other includes coal, hydrogen, geothermal, solar thermal, synthetic oil and synthetic gas.
Passenger aviation. Demand would grow more than threefold globally between 2020 and 2050 in the absence of the assumed changes in behaviour in the NZE. About 60% of this
84 |
International Energy Agency | Special Report |
growth would occur in emerging market and developing economies. In the NZE, three changes lead to a 50% reduction in emissions from aviation in 2050, while reducing the number of flights by only 12% (Figure 2.25).
Keeping air travel for business purposes at 2019 levels. Although business trips fell to almost zero in 2020, they accounted for just over one quarter of air travel before the
pandemic. This avoids around 110 Mt CO2 in 2050 in the NZE.
Keeping long haul flights (more than six hours) for leisure purposes at 2019 levels. Emissions from an average long haul flight are 35 times greater than from a regional flight (less than one hour). This affects less than 2% of flights but avoids 70 Mt CO2 in 2050.
A shift to high speed rail. The opportunities for shifting regional flights to high speed rail vary by region. Globally, we estimate that around 15% of regional flights in 2019 could have been shifted given existing rail infrastructure; future high speed rail lines ensure that by 2050 around 17% could be shifted (IEA, 2019).18 This would reduce emissions by around 45 Mt CO2 in 2050 (high speed trains generate no emissions in 2050 in the NZE).
Figure 2.25 Global CO2 emissions from aviation and impact of behavioural changes in the NZE
2 |
1.0 |
|
|
|
|
|
|
|
100 |
Emissions |
||
CO |
|
|
|
|
|
|
|
|
|
|
|
Long haul |
|
|
|
|
|
|
|
|
|
|
|
||
Gt |
0.8 |
|
|
|
|
|
|
|
80 |
|
|
Medium haul |
|
|
|
|
|
|
|
|
|
||||
|
|
|
|
|
|
|
|
|
|
|||
|
|
|
|
|
|
|
|
|
|
Regional |
||
|
|
|
|
|
|
|
|
|
|
|
|
|
|
|
|
|
|
|
|
|
|
|
|
|
|
|
0.6 |
|
|
|
|
|
|
|
60 |
Emissionsreductions |
||
|
|
|
|
Behaviour |
|
|
|
Cap long haul |
||||
|
|
|
|
|
|
|
||||||
|
0.4 |
|
|
reductions |
40 |
|
|
leisure flights |
||||
|
|
|
|
|
|
50% |
|
|
Cap business |
|||
|
|
|
|
|
|
|
|
|||||
|
|
|
|
|
|
|
|
|
|
flights |
||
|
0.2 |
|
|
|
|
|
|
|
20 |
|
|
Shift to high speed |
|
|
|
|
|
|
|
|
|
|
|
|
rail |
|
|
|
|
|
|
|
|
|
|
|
|
Million flights |
|
2019 |
2020 |
2050 |
|
|
|
|
|
(right axis) |
|||
|
|
|
|
|
|
|
||||||
IEA. All rights reserved.
Demand for passenger aviation is set to grow significantly by 2050, but behavioural changes reduce emissions by 50% in 2050 despite reducing flights by only 12%
Notes: Long haul = more than 6 hour flight; medium haul = 1 6 hour flight; regional = less than 1 hour. Business flights = trips for work purposes; leisure flights = trips for leisure purposes. Average speeds vary by flight distance and range from 680 750 km/h.
18 This assumes that: new rail routes avoid water bodies and tunnelling through elevated terrain; travel times are similar to aviation; and centres of demand are sufficiently large to ensure that high speed rail is economically viable.
Chapter 2 | A global pathway to net-zero CO emissions in 2050 |
85 |
2
IEA. All rights reserved.
Caruse.A variety of new measures that aim to reduce the use of cars in cities and overall car ownership levels are assumed in the NZE. They lead to rapid growth in the rideshare market in urban areas, as well as phasing out polluting cars in large cities and replacing them with cycling, walking and public transport. The timing of these changes in the NZE depends on cities having the necessary infrastructure and public support to ensure a shift away from private car use. Between 20 50% of car trips are shifted to buses, depending on the city in question, with the remainder replaced by cycling, walking and public transport. These changes reduce emissions from cars in cities by more than 320 Mt CO2 in total in the mid 2030s (Figure 2.26). Their impact on emissions fades over time as cars are increasingly electrified, but they still have a significant impact on curbing energy use in 2050.
Figure 2.26 Global CO2 emissions savings and car ownership per household due to behavioural change in the NZE
Mt CO2
200 |
CO2 emissionssavings |
100% |
Carsper household in 2050 |
|||||
|
|
|
|
|
|
|||
150 |
|
|
|
80% |
|
|
|
|
100 |
|
|
|
60% |
|
|
|
|
50 |
|
|
|
40% |
|
|
|
|
0 |
|
|
|
20% |
|
|
|
|
502020 |
|
2030 |
2040 |
2050 |
0 cars |
1 car |
2 cars 3+ cars |
|
Ridesharing |
Cycling and walking |
Buses |
Before behaviour change |
|||||
After behaviour change |
||||||||
|
|
|
|
|
||||
IEA. All rights reserved.
Policies discouraging car use in cities lead to rapid reductions in CO2 emissions and lower car ownership levels, though the impact diminishes over time as cars are electrified
The gradual move away from cars in cities also has an impact on car ownership levels. Survey data indicates that car share schemes and the provision of public transport reduces car ownership by up to 35%, with the biggest changes taking place in multiple car households (Jochem et al., 2020; Martin, Shaheen and Lidiker, 2010). Without behavioural changes, 35% of households would have a car in 2050; with behavioural changes this share falls to around 20% in the NZE, and two car households fall from 13% of the total to less than 5%.
The changing patterns of mobility in cities in NZE have implications for materials demand. Reduced car ownership leads to a small drop in steel demand in 2050, saving around 40 Mt CO2 in steel production. Increased cycling would need to be supported by building an estimated 80 000 km of new cycle lanes globally over the period to 2050, generating increased demand for cement and bitumen. This effect is small, however: the extra emissions associated with this would be less than 5% of the emissions avoided by lower car use.
86 |
International Energy Agency | Special Report |

How to bring about the behavioural changes in NZE
Regulations and mandates could enable roughly 70% of the emissions saved by behavioural changes in the NZE. Examples include:
Upper speed limits, which are reduced over time in the NZE from their current levels to
100 km/h, cutting emissions from road vehicles by 3% in 2050. |
2 |
|
Appliance standards, which maximise energy efficiency in the buildings sector. |
||
|
||
Regulations covering heating temperatures in offices and default cooling temperatures |
|
|
for air conditioning units, which reduce excessive thermal demand. |
|
|
Changes initially tackled by market based mechanisms, e.g. swapping regional flights for |
|
|
high speed rail,19 which can be addressed by regulation over time to mirror changes in |
|
|
public sentiment and consumer norms. |
|
|
Market based instruments use a mix of financial incentives and disincentives to influence |
|
|
decision making. They could enable around two thirds of the emissions saved by behavioural |
|
|
changes in the NZE. Examples include: |
|
Congestion pricing and targeted interventions differentiated by vehicle type,20 such as charges aimed at the most polluting vehicles, or preferential parking for clean cars.
Transport demand measures that reduce travel, such as fuel taxes and distance based vehicle insurance and registration fees (Byars, Wei and Handy, 2017).
Information measures that help consumers to drive change, such as mandatory labelling of embodied or lifecycle emissions in manufacturing and a requirement for companies to disclose their carbon emissions.
Information and awareness measures could enable around 30% of the emissions saved by behavioural changes in the NZE. Examples include:
Personalised and real time travel planning information, which facilitates a switch to walking, cycling and public transport.
Product labelling and public awareness campaigns in combination, which help make recycling widespread and habitual.
Comparisons with consumption patterns of similar households, which can reduce wasteful energy use by up to 20% (Aydin, Brounen and Kok, 2018).
Not all the behavioural changes in the NZE would be equally easy to achieve everywhere, and policy interventions would need to draw on insights from behavioural science and take into account existing behavioural norms and cultural preferences. Some behavioural changes may be more socially acceptable than others. Citizen assemblies in the United Kingdom and
19 A law banning domestic flights where a rail alternative of under two and a half hours exists has been proposed in France (Assemblee Nationale, 2021).
20 Congestion charging is currently used in 11 major cities and has been shown to reduce traffic volumes by up |
reserved. |
||
to 27%. Low emissions zones charge vehicles to enter urban zones based vehicle type and currently exist in |
|||
|
|||
15 countries (TFL, 2021; Tools of Change, 2014; European Commission, 2021). |
|
|
|
Chapter 2 | A global pathway to net-zero CO emissions in 2050 |
87 |
IEA. All rights |
|

France indicate a large level of support for taxes on frequent and long distance flyers and for banning polluting vehicles from city centres; conversely, measures that limit car ownership or reduce speed limits have gained less acceptance (Convention Citoyenne pour le Climat, 2021; Climate Assembly UK, 2020). Behavioural changes which reduce energy use in homes may be particularly well supported: a recent survey showed 85% support for line drying clothes and switching off appliances, and only 20% of people felt that reducing temperature settings in homes was undesirable (Newgate Research and Cambridge Zero, 2021).
Table 2.10 Key behavioural changes in the NZE
Policy options
Low car cities
Phase out ICE cars from large cities.
Rideshare all urban car trips.
Low emissions zones.
Access restrictions.
Parking restrictions.
Registration caps.
Parking pricing.
Congestion charges.
Investment in cycling lanes and public transportation.
Fuel efficient driving |
Speed limits. |
Reduce motorway speeds to |
|
less than 100 km/h. |
Real time fuel efficiency |
Eco driving. |
displays. |
Raise air conditioning |
Awareness campaigns. |
temperature in cars by 3 °C. |
|
|
|
Reduce regional flights |
High speed rail investment. |
Replace all flights <1h where |
|
high speed rail is a feasible |
Subsidies for high speed rail |
alternative. |
travel. |
|
Price premiums. |
Reduce international flights |
Awareness campaigns. |
Keep air travel for business |
|
purposes at 2019 levels. |
Price premiums. |
Keep long haul flights for |
Corporate targets. |
leisure at 2019 levels. |
Frequent flyer levies. |
|
|
Space heating |
Awareness campaigns. |
Target average set point |
|
temperatures of 19 20 °C. |
Consumption feedback. |
|
Corporate targets. |
Space cooling |
Awareness campaigns. |
Target average set point |
|
temperatures of 24 25 °C. |
Consumption feedback. |
|
Corporate targets. |
Related policy goals |
Cost |
effectiveness Timeliness Social acceptability emissionsCO2 impact |
|
|
Air pollution mitigation.
Public health.
Reduced congestion.
Urban space.
Beautification and liveability.
Road safety.
Reduced noise pollution.
Lower air pollution.
Lower noise pollution.
Lower air pollution.
Lower noise pollution.
Public health.
Energy affordability.
Public health.
Energy affordability.
= poor match |
= neutral match |
= good match |
Notes: Large cities = cities over 1 million inhabitants. ICE = internal combustion engine. CO2 emissions impact = cumulative reductions 2020 2050. Eco driving = early upshifting as well as avoiding sudden acceleration, stops or idling. The number of jobs that can be done at home varies considerably by region, globally, an average of 20% of jobs can be done at home.
88 |
International Energy Agency | Special Report |
The behavioural changes in the NZE would bring wider benefits in terms of air pollution in cities, road safety, noise pollution, congestion and health. Attitudes to policy interventions can change quickly when co benefits become apparent. For example, support for congestion charging in Stockholm jumped from less than 40% when the scheme was introduced to around 70% three years later; a similar trend was seen in Singapore, London and other cities,
all of which experienced declines in air pollution after the introduction of charging (Tools of 2 Change, 2014; DEFRA, 2012).
Are net zero emissions by 2050 still possible without behavioural change?
If the behavioural changes described in the NZE were not to materialise, final energy use would be 27 EJ and emissions 1.7 Gt CO2 higher in 2030, and they would be 37 EJ and 2.6 Gt CO2 higher in 2050. This would further increase the already unprecedented ramp up needed in low carbon technologies. The share of EVs in the global car fleet would need to increase from around 20% in 2030 to 45% to ensure the same level of emissions reductions (Figure 2.27). Achieving the same reduction in emissions in homes would require electric heat pumps sales to reach 680 million in 2030 (compared with 440 million in the NZE). Without gains in materials efficiency, the share of low carbon primary steel production would need to be more than twice as high in 2030 as in the NZE. In 2050, the use of sustainable aviation fuels would also need to rise to 7 mboe/d (compared with 5 mboe/d in the NZE). Emissions from cement and steel production would be 1.7 Gt CO2 higher in 2050 than in the NZE, and so require increased deployment of CCUS in industry, deployment of electric arc furnaces and more use of low carbon hydrogen.
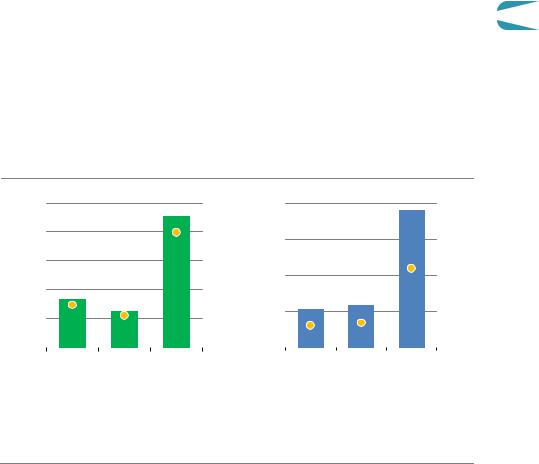
Figure 2.27 Share of low-carbon technologies and fuels with and without behavioural change in 2030 in the NZE
50%
40%
30%
20%
10%
Electric cars |
|
|
Heat pumps in |
Low carbon steel |
Sustainable aviation |
||
|
|
|
residential buildings |
|
fuels |
||
|
|
NZE |
|
|
Additional without behaviour changes |
2020 |
|
|
|
|
|||||
|
|
|
|||||
|
|
|
|
|
|
|
IEA. All rights reserved. |
In the absence of behavioural changes, the share of low-emissions technologies in enduses in 2030 would need to be much larger to achieve the same emissions as in the NZE
Notes: Electric cars = share of electric cars on the road globally. Sustainable aviation fuels = biojet kerosene and synthetic jet kerosene. Low carbon steel refers to primary steel production.
Chapter 2 | A global pathway to net-zero CO emissions in 2050 |
89 |
IEA. All rights reserved.