

Biomedical EPR Part-B Methodology Instrumentation and Dynamics - Sandra R. Eaton
.pdfxxii
6.Conclusion  220
220
7.References  221
221
Chapter 8
Measurement of Distances Between Electron Spins Using Pulsed EPR
Sandra S. Eaton and Gareth R. Eaton
1.Introduction  223
223
2.Fundamental Principles of Interaction between Electron Spins  224
224
3.Distance between Two Slowly Relaxing Centers  227
227
4.Distance between a Slowly Relaxing Center and a Rapidly-Relaxing Center  228
228
5.Some Practical Considerations  229
229
6.Recent Examples for Distances between Two
Slowly-Relaxing Radicals 230
230
7. |
Recent Examples for Distances |
between a Rapidly-Relaxing |
|
and a Slowly-Relaxing Spin |
232 |
8.Prognosis 234
234
9.References 235
235
Section II. Motion, Proteins, and Membranes
Chapter 9
ESR and Molecular Dynamics
Jack H. Freed
1.Motional Narrowing and Organic Radicals  239
239
2.Double Resonance and Molecular Dynamics  241
241
3.Slow Motional ESR and Molecular Dynamics  242
242
4.High Field ESR and Molecular Dynamics 246
246
5.Spin-Echoes and Molecular Dynamics 251
251
6.Two-Dimensional Fourier Transform ESR  256
256
7.Prospectus  263
263
8.Glossary of Abbreviations  264
264
9.References 264
264
Chapter 10
xxiii
SDSL: A Survey of Biological Applications
Candice S. Klug and Jimmy B. Feix
1.Introduction 269
269
2.Solvent accessibility  271
271
3.Motion  280
280
4.Distance measurements 290
290
5.Methodology  298
298
6.Conclusion  300
300
7.References  300
300
Chapter 11
Saturation Transfer Spectroscopy of Biological Membranes
Derek Marsh, László I. Horváth, Tibor Páli And Vsevolod A. Livshits
1.Introduction  309
309
2.Historical Development  311
311
3.Rapid-Passage Saturation-Transfer-EPR Displays  313
313
4.Modulation-Coupled Bloch Equations  315
315
5.Slow Rotational Diffusion  320
320
6.Applications: Slow Rotation  324
324
7. Nonlinear EPR Displays
  331
331
8.Slow Exchange and Paramagnetic Enhancements 339
339
9.Applications: Relaxation Enhancements  348
348
10.Outlook  358
358
11.References  363
363
Chapter 12
Saturation Transfer EPR: Rotational Dynamics of Membrane Proteins
Albert H. Beth and Eric J. Hustedt
1.Introduction  369
369
2.Methods for Analysis of ST-EPR Data  373
373
3.Overview of Theory for Calculation of ST-EPR Spectra  376
376
4.Nonlinear Least Squares Methods of Data Analysis  382
382
xxiv
5.Model Calculations of ST-EPR Spectra Using the
Transition Rate Matrix Approach  383
383
6.Applications of ST-EPR to Membrane Proteins  396
396
7.References  401
401
Chapter 13
Trends in EPR Technology
James S. Hyde
1.Introduction 409
409
2.Resonators 410
410
3.Noise  415
415
4.Multifrequency EPR  420
420
5.EPR for Routine Analysis 423
423
6.Discussion  425
425
7.References  426
426
Chapter 14
Prognosis
Sandra S. Eaton and Gareth R. Eaton
Contents of Previous Volumes
Index
I
Instrumentation and Methodology
Chapter 1
Saturation Recovery EPR
Sandra S. Eaton and Gareth R. Eaton
Department of Chemistry and Biochemistry, University of Denver, Denver, Colorado 80208
Abstract: Saturation recovery EPR measures electron spin relaxation times,  Measurement techniques and applications to relaxation mechanisms, oximetry, Heisenberg exchange and spin-spin distance measurements are discussed.
1.MOTIVATION
From early times, it has been noticed that the CW EPR spectra of some spin systems saturate at lower microwave powers than do other spin systems. There developed a qualitative and semi-quantitative understanding of ways to use these observations to characterize radicals, and in some cases to identify that a normally slowly-relaxing radical was in proximity to a fasterrelaxing radical. The general understanding of the effects of a rapidly relaxing metal ion predates the EPR measurements. Recall, for example, that transition metal ions were added to some of the earliest NMR samples to shorten the proton relaxation times. Also, by the late 1950s it was understood that  in solution broadened the lines of CW EPR spectra (see review by Hausser and Brunner, 1998).
A qualitative understanding of relaxation times is essential for selection of parameters for CW EPR and ENDOR experiments and for prediction of feasibility of pulsed EPR experiments. Quantitatively measured relaxation times provide insight into electronic structure, motion, and other processes that contribute to relaxation.
Early estimates of relaxation times were obtained from power saturation curves, however analysis of these data is complicated by the dependence of saturation on the  product rather than on either
  or
or  individually, and on spectral diffusion (Eaton and Eaton, 2000a). Most EPR signals in
3
4 |
SANDRA S. EATON AND GARETH R. EATON |
biomolecules are inhomogeneously broadened due to unresolved hyperfine structure. There is inherently more information in the relaxation times of individual spin packets and the rates of energy transfer among them than in the envelope of the CW line shape. Consequently, time-domain methods are of particular importance for the study of biomolecular systems. This chapter describes the saturation recovery (SR) method of measuring electron spin lattice relaxation  and examples of applications to biological samples. Some applications of
  measurements are discussed together with spin echo measurements of
  and related relaxation times, in the chapter on distance measurements (ch. 8)
2.BRIEF HISTORY
The measurement of  by CW SR was first demonstrated for nuclear spins by Bloembergen (1949). Subsequently there have been many applications to electron spins. Bloembergen and Wang (1954) measured the change in the z magnetization following a microwave pulse by using a pickup coil outside the resonant cavity. They mentioned, but did not apply, a technique in which recovery would be monitored in a low-level microwave field after the end of the saturating microwave pulse. This method became known as saturation recovery. Weissman and coworkers (1957) manually stepped the microwave amplitude in a measurement of a 20-minute
  of triphenylmethyl radical at 1.2 K. The first SR spectrometers capable of measurements faster than those that used manual switching were described in 1958 (Davis et al., 1958; Giordmaine et al., 1958), 1959 (Bowers and Mims, 1959) and 1960 (Pastor, et al., 1960). Collins et al. (1959) used a bimodal resonator and Scott and Jeffries (1962) demonstrated the use of a transmission cavity for SR. Early applications of SR to organic radicals were published by Venkataraman and coworkers (Rengen et al., 1972; 1974a,b, 1979; Lingam et al., 1972; Fessenden et al., 1981; Venkataraman, 1982). Theory of relaxation, applied to SR experiments, and illustrated with the case of nitroxyl radicals in fluid solution, was detailed by Freed (1974). The modern development of the field is largely due to Hyde and coworkers (Huisjen and Hyde, 1974a,b; Percival and Hyde, 1975, 1976; Hyde, 1979). Detailed descriptions of SR spectrometers have been published by Huisjen and Hyde (1974b), Percival and Hyde (1975), Mailer et al. (1985), Beck et al. (1991), and Quine et al. (1992, 1996). The development of SR at Varian Instruments has been described by Hyde (1998). Summaries of the early literature can be found in Standley and Vaughan (1969).
SATURATION RECOVERY EPR |
5 |
3.INFORMATION CONTENT OF SATURATION RECOVERY CURVES
It is important to distinguish between the experimentally determined response to a perturbation of the spin populations, which might be termed an “effective  and the “true
  that characterizes transitions between particular electron spin energy levels. In a short-pulse SR experiment there frequently will be contributions to the recovery curve from spectral diffusion processes including molecular tumbling (in fluid solution), nuclear spin relaxation or cross relaxation (Yin and Hyde, 1987a). In these cases a
  measurement” produces a recovery curve that is “the sum of all possible relaxation pathways rather than the relaxation between only the observed levels” (Hyde, 1979, page 27). The spectral diffusion processes can be characterized using electron-electron double resonance (ELDOR). The effects of these spectral diffusion processes on the SR response often can be mitigated in a long-pulse SR experiment (Hyde, 1979). However, we have observed that in some samples that contain methyl groups that are rotating at a rate that is comparable to the electron Larmor frequency, even long-pulse SR curves are not single exponentials. ELDOR curves indicate that electron spin cross relaxation is rapid for these samples (Harbridge et al., 2002), which may cause the deviation from single exponential behavior.
4.PRACTICAL ASPECTS OF EXPERIMENTAL METHODOLOGY
4.1Description of the Continuous Wave SR Experiment
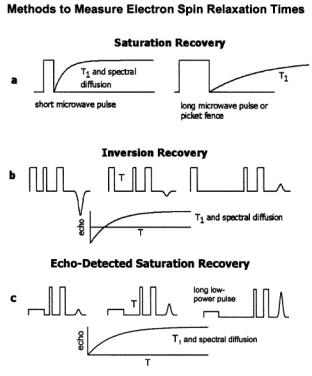
The pulse sequence for CW SR is sketched in Figure 1a. A higher-power pulse is applied to saturate the EPR transition. The length of this pulse defines whether the experiment is viewed as longor short-pulse SR. As soon as possible after this pump pulse, the EPR signal is detected with lower-power continuous wave microwaves. The minimum time between the end of the pulse and the beginning of observation is determined by switching transients and by the ring-down time of the resonator. In principle, there should be no signal when the magnetic field is set off resonance. However, in reality, there are switching transients and responses of the resonator to heating that result in a “background” signal that is observed even when the field is set off resonance. Correction for these artifacts is performed by taking the difference between onand off-resonance responses. The spectrometers in the Hyde laboratory employ dual-channel boxcar detection with low-frequency (e.g., 28 Hz) modulation of the magnetic field to
6 |
SANDRA S. EATON AND GARETH R. EATON |
alternately collect onand off-resonance responses at each point in the recovery curve (Percival and Hyde, 1975; Hyde, 1979). The field stepping also eliminates noise at frequencies lower than the pulse repetition rate and the field-stepping rate. Modulation of the magnetic field is not an effective way to correct for non-resonance artifacts if the spectral width exceeds the field modulation range. In our laboratory we signal average blocks of SR responses onand offresonance and take the difference between the two sets of data (Quine et al., 1992), which permits measurements to be performed for broad transition metal signals.
Figure 1. Pulse sequences for measurement of as discussed in the text. The sketches emphasize that in many cases the time constant that is measured is an “effective”
  that includes spectral diffusion contributions.
4.2Contributions from Spectral Diffusion
In a CW-detected SR experiment (just as in CW EPR) the resonator is critically coupled and the resonator Q typically is relatively high. For

SATURATION RECOVERY EPR |
|
7 |
|
example, at X-band the rectangular |
resonator has Q about |
3600 where |
|
|
At 9.5 GHz this value of Q corresponds to a |
half-power |
|
bandwidth, |
of 2.6 MHz. At g = 2 there is about 2.8 MHz/G so 2.6 MHz |
||
is about 1 Gauss (0.1 mT) at g = 2. Thus, this bandwidth means that any process that moves the resonant field by about a gauss on the time scale of the experiment can appear to be a relaxation process. Typical Q-values for X-band loop-gap resonators are roughly 1000 (depending on sample size and solvent lossiness), which means that the bandwidth for the LGR is about a factor of four greater than for the  cavity, although the bandwidth still is small compared with the widths of EPR spectra, even for many radicals.
If it is observed that the experimental recovery time constant depends upon the length of the saturating pulse, then it can be concluded that spectral diffusion processes are contributing to the recovery. The length of the saturating pulse is then increased until a limiting value of the apparent relaxation time constant is observed. This limiting time constant is the best
approximation to |
that can be obtained by SR. Cases in which the limiting |
|
value of the time constant still is not a“true |
were documented in a series |
|
of papers by Manenkov and coworkers (Manenkov et al., 1962; Manenkov and Prokhorov, 1962; Manenkov and Pol’skii, 1964). They showed that although long pulses often suppress the effects of spectral diffusion on the recovery curve, it is possible to achieve conditions where the observed recovery is independent of the pulse width, but there is a steady state where the effect of spectral or spin diffusion is roughly balancing  In this case the recovery following the pump pulse exhibits contributions from spectral or spin diffusion. Manenkov et al. focused specifically on the importance of two paths, spin-lattice relaxation and cross relaxation to other states of neighboring multi-level paramagnetic centers, such as Cr(III), Fe(III), Nd(III) and Gd(III). In the Cr(III) systems studied, at various concentrations
and at 1.7 and 4.2 K, cross relaxation, |
was always shorter than |
and |
therefore contributed to the recovery curve. However, if |
cross |
|
relaxation would not contribute to the long-pulse SR curves. Daraseliya and Manenkov (1970) showed that one could “quench” the effect of cross relaxation by sweeping rapidly through the line during the saturating pulse, which saturated all sublevels, and the recovery was a true  This paper also pointed out that in an inhomogeneously broadened line there could be
“a spectrum of cross-relaxation times |
These ideas were applied to |
||
Fe(III) |
in |
crystals (Manenkov and Milyaev, 1970) and to |
|
Nd(III) |
(Daraseliya et al., |
1970). The |
latter paper presented a theoretical |
basis for the prior papers, and showed that for many sets of assumptions the
recovery curve will not |
be a |
simple exponential in |
For Nd(III) the |
experimental data reveal |
longer |
when the method of rapid scan through |
|
the line during saturation is used than when the recovery is deconvoluted
8 |
SANDRA S. EATON AND GARETH R. EATON |
into  and
and  Unfortunately, the quantitative basis for this analysis was not presented.
In our studies of radicals trapped in irradiated solids (Harbridge et al., 2002) we observed that long pump pulses removed the contributions from rapid nuclear spin relaxation. However when  residual contributions from
  were present in the SR curves even after long pump pulses.
4.3Selection of Pump and Observe Powers
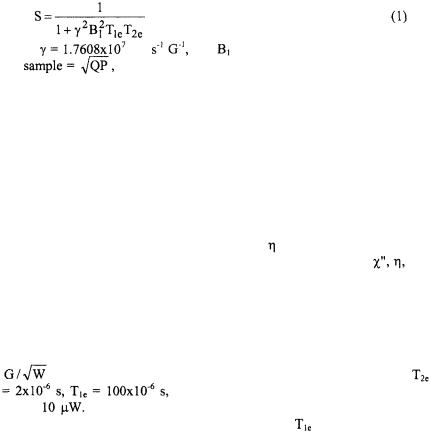
The saturation factor, S, for an EPR signal is given by equation (1).
where |
rad |
and |
is the microwave magnetic field at |
the |
P is the power incident on the resonator in watts and Q |
||
is the resonator quality factor. The pump power is selected to make S small. Typical values of P that are currently used in SR spectrometers are 10’s to a few hundred mW. It might seem that higher pump power would always be better. However, higher pump powers cause greater resonator heating, which can cause baseline and frequency drift so there often is an optimum pump power for a particular sample and spectrometer configuration.
If S is small during the pump pulse, the amplitude of the SR signal changes from almost zero immediately after the pump pulse, back to the normal unsaturated signal amplitude, which is proportional to 
is the imaginary component of the RF susceptibility, which is proportional to
the number of unpaired |
spins in |
the sample. |
is the filling factor of the |
|
sample in the resonator. |
Q is the |
quality factor for the resonator. |
and |
|
Q are fixed by the sample and resonator properties. Thus, the dynamic range of the SR signal is linearly proportional to the square root of the observe power. To obtain an accurate value of  it is important to keep the observe power low enough that the saturation factor, S (eq. (1)), is approximately equal to 1 (Huisjen and Hyde, 1974b; Mailer et al., 1985; Fajer et al., 1986). For example, if the resonator has an efficiency of about 1
|
where W is the power incident on the resonator in watts, and if |
|||
|
then the observe power should |
be kept well |
||
below |
These are reasonable parameters for |
organic |
radicals |
near |
liquid nitrogen temperature. At lower temperature, |
increases by at |
least |
||
the inverse square of the temperature (Eaton and Eaton, 2000a), and the observe power should be reduced proportionately. At room temperature,  and
and  are much shorter than at lower temperatures and higher observe powers can be used.