

Wasserscheid P., Welton T. - Ionic Liquids in Synthesis (2002)(en)
.pdf136 Chris Hardacre
Figure 4.1-5: Schematic showing the changes in structure of N-alkylpyridinium tetrachlorocuprate salts with varying alkyl chain lengths. Reproduced from reference 23 with permission.
like structures based upon the smectic A structure. For n = 16, 18, in the cases of [PdCl4]2– and [PdBr4]2–, this is preceded by an ordered smectic E phase. Cupratebased pyridinium ionic liquids exhibit a range of structures depending on the alkyl chain length. For C12–C18, each solid-state structure has a layered periodicity. On melting, however, C12–C14 exhibit a columnar phase whereas C16–C18 simply form a smectic A phase. For n = 15, the solid melts into a cubic phase before transforming into the smectic A phase as seen for longer alkyl chains. Figure 4.1-5 illustrates the changes observed in the latter case.
Similar lamellar structures are formed for 1-alkyl-3-methylimidazolium cations with [PdCl4]2– when n > 12. As with the pyridinium systems, mesomorphic liquid crystal structures based on the smectic A structure are formed [24].
Martin [25] has also shown that ammonium salts display similar behavior. [Cetyltrimethylammonium]2[ZnCl4], for example, first melts to an SC-type liquid crystal at 70 oC and then to an SA-type mesophase at 160 oC. The broad diffraction features observed in the liquid-crystalline phases are similar to those seen in the original crystal phase and show the retention on melting of some of the order originating from the initial crystal, as shown in Figure 4.1-6.
Needham et al. [26] also used X-ray diffraction to show that, in the case of Mn(II)-, Cd(II)-, and Cu(II)-based C12- and C14-ammonium tetrachlorometalate salts, two mechanistic pathways were present on melting to the mesophase. Each pathway was shown to have a minor and major structural transformation. The minor change was thought to be a torsional distortion of the alkyl chains and the major change the melting of the chains, forming a disordered layer. The order in which the structural changes occur was found to be dependent on the metal and on the alkyl chain length.
4.1 Order in the Liquid State and Structure 137
Figure 4.1-6: Small-angle X-ray diffraction data from [cetyltrimethylammonium]2[ZnCl4] at (a) room temperature (solid), (b) 90 °C (SC phase) and (c) 200 °C (SA phase). Reproduced from reference 25 with permission.
Q / Å-1
Non-metal-containing systems
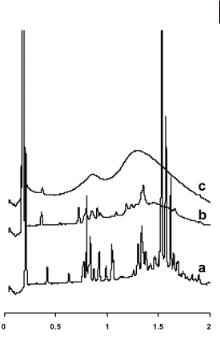
Non-metal-containing salts have been studied extensively. Bradley et al. [27] examined a range of 1-alkyl-3-methylimidazolium-based salts containing chloride, bromide, trifluoromethanesulfonate ([OTf]–), bis(trifluoromethanesulfonyl)imide, and [BF4]– anions. In the mesophase, the X-ray data of these salts were consistent with smectic A phases with interlayer spacings of between 22–61 Å, increasing uniformly with increasing alkyl chain length n. For a given cation, the mesophase interlayer spacing decreases in the order Cl– > Br– > [BF4]– > [OTf]–, with the bis(trifluoromethanesulfonyl)imide salts not exhibiting any mesophase structure. The anion dependence of the mesophase interlayer spacing is largest for the anions with greatest ability to form a three-dimensional hydrogen-bonding lattice. On melting to the isotropic liquid, a broad peak is observed in the X-ray scattering data for each salt, as shown in Figure 4.1-7. This peak indicates that some short-range associative structural ordering is still retained even within the isotropic liquid phase.
Similarly, N-alkylammonium [28] and alkylphosphonium [29] salts form lamellar phases with smectic bilayer structures. In both cases, X-ray scattering also showed the isotropic liquid not to be completely disordered and still displaying similar features to the mesophase. Buscio et al. [28] showed that in N-alkylammonium chlorides the feature was not only much broader than that observed in the mesophase but increased in width with decreasing chain length.
Other examples include ditholium salts, shown in Figure 4.1-8 [30]. The scattering data show that a range of mesophase behavior is present, dependent – as with the metal-containing systems – on alkyl chain length.

138 Chris Hardacre
|
|
|
|
|
|
|
|
|
|
(c) |
|
Intensity (arb. units) |
|
|
|
|
|
|
|
|
|
(b) |
|
|
|
|
|
|
|
|
|
|
(a) |
|
|
|
|
|
|
|
|
|
|
|
|
|
|
0 |
1 |
2 |
3 |
4 |
5 |
6 |
7 |
8 |
9 |
10 |
11 |
|
|
|
Scattering angle (2θ) |
|
|
|
|||||
Figure 4.1-7: Small-angle X-ray diffraction data from [C16MIM][OTf] at (a) 50 °C,
(b) 70 °C, and (c) 90 °C, in the crystal, SmA2, and isotropic phases, respectively, on cooling. Reproduced from reference 27 with permission.
For n = 12, for example, two transitions within the liquid crystalline region are observed: from a nematic columnar phase (Ncol) to a hexagonal columnar lattice (Dh), and then finally to a rectangular lattice (Dr). X-ray diffraction data for benzimidazolium salts have also been reported [31], and indicated a switch within the liquid crystalline region from a lamellar β phase to the α phase, which in some examples is not shown by differential scanning calorimetry. Using X-ray diffraction, Bruce and co-workers have propose a new structural model for N-alkylpyridinium alkylsulphates [32]. In these liquid-crystalline materials, the d spacings obtained are less than the molecular length, but are not associated with tilting of the alkyl chains. The new proposed model shows microdomains of interdigitated and non-interdig- itated molecules.
(a)
(b)
O |
|
|
|
OCnH2n+1 |
||||
|
|
|
|
|
|
|
|
OCnH2n+1 |
+ |
|
|
|
|||||
|
|
|
S |
|
S [BF ]- |
|||
|
||||||||
|
|
|
|
|
4 |
|
|
|
Figure 4.1-8: (a) Small-angle X-ray diffraction data relating to the ditholium salt shown in
(b) for n = 12. A and B correspond to the rectangular lattice vectors shown in Dr, and a
and b correspond to the Ncol to Dh and Dh to Dr phase tran-
sitions. Reproduced from reference 30 with permission.

4.1 Order in the Liquid State and Structure 139
Other liquid-crystalline materials that have been investigated by X-ray scattering include singleand double-chained pyridinium [33] and N-substituted 4-(5-alkyl-1,3- dioxan-2-yl)pyridinium salts [34]. In the former case, diffraction analysis allowed an explanation for the differences in monoand di-substituted salts to be proposed.
In general, X-ray data are used in conjunction with other techniques to obtain as full a picture as possible. For liquid-crystalline materials, differential scanning calorimetry (DSC) and polarizing optical microscopy (POM) are conventionally used.
4.1.7
Extended X-ray Absorption Fine-structure Spectroscopy
Extended X-ray absorption fine-structure (EXAFS) spectroscopy measures X-ray absorption as a function of energy and allows local arrangements of atoms to be elucidated. The absorption results from the excitation of a core electron in an atom. Conventional EXAFS is usually associated with hard X-rays (that is, >3–4 keV), in order to allow measurements to be made outside a vacuum, and requires synchrotron radiation to provide the intensity at the energies involved. At these energies, the core electrons ejected correspond to the 1s (K-edge), 2s (LI-edge), 2p1/2(LII-edge), and 2p3/2(LIII-edge) states. As the photon energy is increased past the absorption edge, an oscillatory structure is found, described as the X-ray fine structure. The X- ray fine structure starts at approximately 30 eV past the edge and extends to a range of 1000 eV.
EXAFS is observed as a modulating change in the absorption coefficient caused by the ejected electron wave back-scattering from the surrounding atoms, resulting in interference between ejected and back-scattered waves. It is defined as:
χ (k) = |
µ (k) – µ |
0(k) |
|
∆µ 0 |
|
(4.1-4) |
|
|
|
|
|
where χ(k) is the EXAFS as a function of the wavenumber of the photoelectron k, µ(k) is the measured absorption above the absorption edge, µ0(k) is the absorption spectrum without the EXAFS oscillations (that is, the background), and ∆µ0 is a normalization factor.
The wavenumber is defined at a photon energy E above the absorption edge energy E0, with respect to the mass of the electron me.
k = |
2me |
(E − E ) |
(4.1-5) |
|
h2 |
||||
|
0 |
|
The EXAFS is related to the wavenumber by:
χ (k) ≈ ∑ |
N |
f |
i |
(k) |
e-2σ i |
k |
e-2ri / λ sin[2kri + α i (k)] |
(4.1-6) |
i |
|
2 |
||||||
|
|
|
|
|
2 |
2 |
|
|
i |
|
kri |
|
|
|
|
|
|

140 Chris Hardacre
Where, χ(k) is the sum over Ni back-scattering atoms i, where fi is the scattering amplitude term characteristic of the atom, σi is the Debye–Waller factor associated with the vibration of the atoms, ri is the distance from the absorbing atom, λ is the mean free path of the photoelectron, and αi is the phase shift of the spherical wave as it scatters from the back-scattering atoms. By taking the Fourier transform of the amplitude of the fine structure (that is, χ(k)), a real-space radial distribution function of the back-scattering atoms around the absorbing atom is produced.
On analysis of the EXAFS data, the local environment around a given absorbing atom – that is, the type, number and distance of the back-scattering atoms – can be obtained. It should be noted that it is not necessary for the surrounding atoms to be formally bonded to the absorbing atom. Typically the distance has an uncertainty of
± 1 % within a radius of approximately 6 Å; however, the error in the coordination number is strongly dependent on the system studied and can be high. In this regard, comparison with standard materials and the use of EXAFS in conjunction with other techniques to ensure a realistic interpretation of the data is vital.
Since the fine structure observed is only associated with the particular absorption edge being studied, and the energy of the absorption edge is dependent on the element and its oxidation state, EXAFS examines the local structure around one particular element, and in some cases, an element in a given oxidation state. A fuller picture can therefore be obtained by studying more than one absorbing element in the sample.
4.1.7.1Experimental
Measuring EXAFS spectra In general, transmission EXAFS can be used, provided that the concentration of the element to be investigated is sufficiently high. The sample is placed between two ionization chambers, the signals of which are proportional to the incident intensity I0 and the transmitted intensity through the sample It. The transmission of the sample is dependent on the thickness of the sample x and on the absorption coefficient, µ, in a Beer–Lambert relationship:
It = I0e− x |
(4.1-7) |
For good spectra to be obtained, the difference between the ln(It/I0) before and after the absorption edge, the edge jump, should be between 0.1 and 1. This may be calculated from the mass absorption coefficient of a sample:
|
µ |
|
|
µ |
(4.1-8) |
|
|
= ∑wi |
|
|
|
|
ρ sample |
i |
|
ρ i |
|
where ρ is the sample density and the mass-weighted average of the mass absorption coefficients of each element in the sample, using weight fractions wi.
If the edge jump is too large, the sample should be diluted or the path-length decreased. If the edge jump is too small, then addition of more sample is one possibility, although this is dependent on the matrix in which the sample is studied.

4.1 Order in the Liquid State and Structure 141
For low atomic weight matrices such as carbon-based materials, the path-length can be increased without the transmission of the X-rays being adversely affected. In matrices containing high atomic weight elements, such as chlorine, increasing path-length will result in a larger edge jump, but it will also decrease the overall transmission of the X-rays. For such samples, fluorescence EXAFS may be performed. In this geometry, the emitted X-rays are measured. Optimally, the sample is placed at 45o to the incident X-rays and the X-ray fluorescence is detected at 90o to the direction of the exciting X-rays by use of, for example, a solid-state detector. The X-ray florescence is proportional to the X-rays absorbed by the sample and therefore can be used to measure the EXAFS oscillations. In general, this technique has a poorer signal-to-noise ratio than transmission EXAFS and there are problems with self-absorption effects, requiring dilute or thin sample sizes.
Self-absorption occurs when the path-length is too large [35] and the X-rays emitted have a significant probability of being absorbed by the remainder of the sample before being detected. This has the consequence of reducing the amplitude of the EXAFS oscillations and producing erroneous results. As the sample becomes more dilute this probability decreases. All the atoms in the sample determine the amount of self-absorption: hence the need for thin samples.
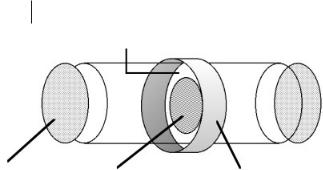
Liquid set-ups There are two major methods by which liquid samples are studied; these are shown in Figure 4.1-9.
These consist either of supporting the liquid in an inert, low atomic weight matrix such as graphite or boron nitride, or of sandwiching thin films between low atomic weight plates. The choice of the matrix material used is a balance between its chemical inertness towards the liquid being studied whilst being thermally stable and its being transparent to the X-rays at the absorption energy. The latter becomes less problematic as the energy of the absorption edge increases. Figure 4.1-10 shows an experimental cell which has been used to measure the EXAFS of ionic liquid samples [36].
Analysis A number of commercial software packages to model EXAFS data are available, including the FEFF program developed by Rehr and co-workers [37], GNXAS, developed by Filipponi et al. [38], and EXCURV, developed by Binsted [39]. These analysis packages fit the data to curve wave theory and describe multiple scattering as well as single scattering events. Before analysis, the pre-edge and a smooth
(a) |
(b) |
Figure 4.1-9: Schematic of the sample preparation methods used to study liquid EXAFS: (a) thin liquid film sandwich between low atomic weight plates, and
(b) the liquid (circles) dispersed in a low atomic number matrix (polyhedrons). The figure has been redrawn from reference 40 with permission.
142 Chris Hardacre
Thermocouple |
Figure 4.1-10: Schematic of |
|
transmission EXAFS cell. |
|
Reproduced from reference 36 |
|
with permission. |
‘o’-ring sealed |
Sample as a |
Band Heater |
|
Kapton window |
|||
pressed disc |
|
||
|
|
post-edge background function µ0(k) is subtracted from the measured spectra. This is one of the most important procedures and can, if performed poorly, result in loss of amplitude of the EXAFS oscillations or unphysical peaks in the Fourier transform.
Two review articles treating the theory more rigorously and summarizing much of the data on general liquid systems have recently been published [40, 41].
4.1.7.2Examples
Ionic liquid structure To date, EXAFS has only been used to examine the structure of high-temperature molten salts in detail.
Di Cicco and co-workers [42, 43] have examined the structure of molten CuBr with Cu and Br K-edge EXAFS. From the EXAFS data, the Cu–Br bond length distribution was found to be shorter than that derived from neutron data and theoretical models, indicating a more covalent character than previously thought. Similar EXAFS studies on KBr and RbBr are in good agreement with theory, showing high levels of ionicity [43].
Zn and Rb K-edge EXAFS have also been used to examine the melting of Rb2ZnCl4 in comparison with the liquid structure of ZnCl2 and RbCl [44]. In molten ZnCl2, the zinc is found to be tetrahedrally coordinated, with the tetrahedra linked by corner-sharing chlorines in a weak extended network. In RbCl, significant disorder is evident in the chloride shell around the rubidium and indicates significant movement of the Rb+ and Cl– in the molten state. In the crystal structure of Rb2ZnCl4, the chlorine coordination number around the Rb is between 8 and 9, whilst the Zn is found in isolated ZnCl4 units. In the molten state, the EXAFS also indicates isolated ZnCl4 units with a chlorine coordination of 7.6 around the Rb. This may be compared with a chlorine coordination of 4.8 in liquid RbCl. The EXAFS clearly shows that the solid and liquid structures of Rb2ZnCl4 are similar and that the melt does not rearrange into a simple combination of the component parts.
In the studies described above, the samples were supported in low atomic weight matrices, melted in situ, and measured in transmission mode. Similarly, second
4.1 Order in the Liquid State and Structure 143
generation ionic liquids have been studied. Carmichael et al. [45] showed that it was possible to support and melt [EMIM]2[NiCl4] and [C14MIM]2[NiCl4] in inert matrices such as boron nitride, graphite, and lithium fluoride without the EXAFS being affected by the sample matrix used. In these samples, the Ni K-edge EXAFS was investigated between room temperature and 131 oC. Even in LiF, where halide exchange was possible, little difference was found in the Ni coordination on melting.
Species dissolved in ionic liquids A number of systems have been investigated in both chloroaluminate and second generation ionic liquids
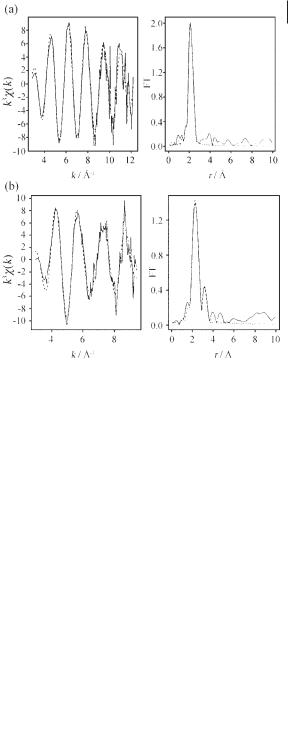
Dent et al. [46] studied the dissolution of [EMIM][MCl4] in [EMIM]Cl/AlCl3 binary mixtures, for M = Mn, Co, and Ni, at AlCl3 mole fractions of 0.35 and 0.60 using the M K-edges. Because of problems associated with the high concentration of chloride it was not possible to perform transmission experiments, and so fluorescence measurements were used. In this case, self-absorption problems were overcome by use of a thin film of liquid pressed between two sheets of polythene sealed in a glove-box. The coordination of Ni, Co, and Mn was found to change from [MCl4]2– to [M(AlCl3)4]– as the mole fraction of AlCl3 increased. Figure 4.1-11 shows the EXAFS and pseudo-radial distribution functions for M = Co in both the acidic and basic chloroaluminate ionic liquids.
Figure 4.1-11: The EXAFS data and pseudo-radial distribution functions of Co(II) in
(a) basic and (b) acidic chloroaluminate ionic liquid. Reproduced from reference 46 with permission.

144 Chris Hardacre
Aluminium coordination was only observed in acidic mixtures (that is, at AlCl3 mole fractions greater than 0.5). The latter was surprising given that at 0.60 AlCl3, almost half the anion species are in the form [Al2Cl7]–, yet no coordinating [Al2Cl7]– was observed.
Dent et al. [47] also investigated the V K-edge EXAFS for the dissolution of [EMIM][VOCl4] and [NEt4][VO2Cl2] in basic [EMIM]Cl/AlCl3 and compared the data with those of solid samples. In both cases the dissolved and the solid samples showed similar EXAFS and no coordination of the chloroaluminate species to, for example, the vanadyl oxygen was found.
Thanks to the decrease in the average atomic weight of the medium compared with chloroaluminate systems, second generation ionic liquids may be studied in transmission. Carmichael et al. [45] have shown that solutions of [EMIM]2[NiCl4] in [BMIM][PF6] may be studied by supporting the liquid between two boron nitride discs. The resulting Ni K-edge EXAFS showed a local structure similar to that of the molten [EMIM]2[NiCl4] described above.
Baston et al. [48] studied samples of ionic liquid after the anodization of uranium metal in [EMIM]Cl, using the U LIII-edge EXAFS to establish both the oxidation state and the speciation of uranium in the ionic liquid. This was part of an ongoing study to replace high-temperature melts, such as LiCl/KCl [49], with ionic liquids. Although it was expected that, when anodized, the uranium would be in the +3 oxidation state, electrochemistry showed that the uranium was actually in a mixture of oxidation states. The EXAFS of the solution showed an edge jump at 17166.6 eV, indicating a mixture of uranium(IV) and uranium(VI). The EXAFS data and pseu- do-radial distribution functions for the anodized uranium in [EMIM]Cl are shown in Figure 4.1-12.
Two peaks, corresponding to a 1:1 mixture of [UCl6]2– and [UO2Cl4]2–, were fitted, in agreement with the position of the edge. Oxidation to uranium(VI) was surpris-
|
(a) |
|
|
|
-3 |
|
|
|
units |
|
|
|
arb. |
|
/ Å |
|
|
|
|
(k) |
|
|
|
/ |
3χ |
|
|
|
Amplitude |
k |
|
|
|
|
3.0 |
5.0 |
7.0 |
9.0 |
11.0 |
Wavenumber / Å-1
|
(b) |
|
|
|
|
|
|
|
0.0 |
1.0 |
2.0 |
3.0 |
4.0 |
5.0 |
6.0 |
7.0 |
8.0 |
|
|
|
Distance / Å |
|
|
|
|
|
Figure 4.1-12: The experimental (solid line) and fitted (dashed line) U L(III)-edge (a) EXAFS data and (b) pseudo-radial distribution function after anodization of uranium in [EMIM]Cl. The figure has been redrawn from reference 48 with permission.

4.1 Order in the Liquid State and Structure 145
-3 |
|
|
|
|
units |
/ Å |
|
|
|
|
|
(k) |
|
|
|
|
/ arb. |
3χ |
|
|
|
|
|
k |
|
|
|
|
Amplitude |
3.0 |
5.0 |
7.0 |
9.0 |
11.0 |
13.0 |
Wavenumber / Å-1
|
|
|
|
Pd-Pd |
|
|
|
|
|
Pd-O |
|
|
Pd-P |
|
|
|
|
|
|
|
|
|
|
|
|
|
0.0 |
1.0 |
2.0 |
3.0 |
4.0 |
5.0 |
6.0 |
7.0 |
8.0 |
|
|
|
Distance / Å |
|
|
|
|
|
Figure 4.1-13: Comparison of the experimental (solid line) and fitted (dashed line) (a) EXAFS and (b) pseudo-radial distribution functions from palladium ethanoate in [BMIM][PF6]
without (—) and with (—) triphenylphosphine at 80 °C and in the presence of triphenylphosphine and reagents at 50 °C for 20 min (—). Reproduced from reference 50 with permission.
ing in this system and may have arisen from the presence of water due to the highly hygroscopic nature of [EMIM]Cl.
In none of the above cases has a reaction been performed whilst taking the EXAFS data. Hamill et al. [50] have investigated catalysis of the Heck reaction by palladium salts and complexes in room-temperature ionic liquids. On dissolution of palladium ethanoate in [BMIM]+ and N-butylpyridinium ([BP]+) hexafluorophosphate and tetrafluoroborate ionic liquids, and triethyl-hexyl ammonium bis(trifluoromethanesulfonyl)imide, a gradual change from ethanoate coordination to the formation of palladium metal was observed in the Pd K-edge EXAFS, as shown in Figure 4.1-13.
In pyridinium chloride ionic liquids and in 1,2-dimethyl-3-hexylimidazolium chloride ([HMMIM]Cl) , where the C(2) position is protected by a methyl group, only [PdCl4]2– was observed, whereas in [HMIM]Cl, the EXAFS showed the formation of a bis-carbene complex. In the presence of triphenylphosphine, Pd–P coordination was observed in all ionic liquids except where the carbene complex was formed. During the Heck reaction, the formation of palladium was found to be quicker than in the absence of reagents. Overall, the EXAFS showed the presence of small palladium clusters of approximately 1 nm diameter formed in solution.
4.1.8
X-ray Reflectivity
Reflectometry is a useful probe with which to investigate the structure of multilayers both in self-supporting films and adsorbed on surfaces [51]. Specular X-ray reflectivity probes the electron density contrast perpendicular to the film. The X- rays irradiate the substrate at a small angle (<5 o) to the plane of the sample, are reflected, and are detected at an equal angle. If a thin film is present on the surface