

Wasserscheid P., Welton T. - Ionic Liquids in Synthesis (2002)(en)
.pdf166 Joachim Richter, Axel Leuchter, Günter Palmer
in the step-profile is associated with the change of the optical phase profile, which can be scanned by a coherent laser beam passing perpendicular to the diffusion axis z through the diffusion cell. The state of the diffusion cell at a certain time is stored as a hologram on a CCD camera. The hologram is processed with holograms taken at different times to produce interference patterns, which indicate the change in the diffusion cell with time. By use of Fick´s second law, the diffusion coefficient can be calculated from a single interference pattern. Mutual diffusion coefficients are accessible over the whole composition range of binary mixtures [15].
With electrochemical methods such as chronoamperometry, cyclovoltammetry (CV), or conductivity measurements, the diffusion coefficients of charged chemical species can be estimated in highly dilute solutions [16, 17].
4.4.4
Results for Ionic Liquids
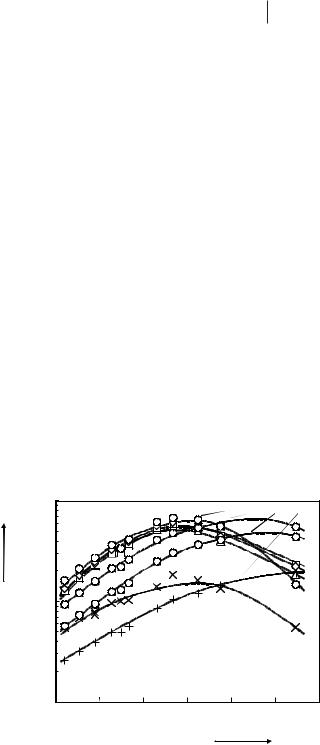
Typical values of self-diffusion coefficients and mutual diffusion coefficients in aqueous solutions and in molten salt systems such as (K,Ag)NO3 are of the order of 10–9 m2s–1, and the coefficients do not usually vary by more than a factor of 10 over the whole composition range [1, 2, 15]. From measurements in pure ionic liquids we have learned that their self-diffusion coefficients are only of the order of 10–11 m2s–1. From this point of view it is interesting to investigate systems of “ordinary” and ionic liquids. Figure 4.4-3 shows the results of first measurements in the methanol/[BMIM][PF6] system, which can be seen as a prototype for a system in which an organic and an ionic liquid are mixed.
Figure 4.4-3: Self-diffusion and mutual diffusion coefficients in the methanol/[BMIM][PF6] system. x2: mole fraction of [BMIM][PF6], D: mutual diffusion coefficient, Ds1: self-diffusion coefficient of methanol, Ds2+: self-diffusion coefficient of [BMIM]+.

4.4 Translational Diffusion 167
Self-diffusion coefficients were measured with the NMR spin-echo method and mutual diffusion coefficients by digital image holography. As can be seen from Fig-
ure 4.4-3, the diffusion coefficients show the whole bandwidth of diffusion coefficient values, from 10–9 m2s–1 on the methanol-rich side, down to 10–11 m2s–1 on the
[BMIM][PF6]-rich side. The concentration dependence of the diffusion coefficients on the methanol-rich side is extreme, and shows that special care and attention should be paid in the dimensioning of chemical processes with ionic liquids.
Since this is just the beginning of investigations into the diffusion behavior and intermolecular forces in ionic liquid systems, further experimental work needs to be done both with pure ionic liquids and with systems of mixtures of ionic and organic liquids.
References
1 |
H.J.V. Tyrrell and K.R. Harris, Diffu- |
8 |
J.-F. Huang, P.-Y. Chen, I.W. Sun, and |
|
sion in Liquids, Butterworths, London, |
|
S.P. Wang, Inorganica Chimica Acta |
|
1984. |
|
2001, 320, 7. |
2 |
E.L. Cussler, Diffusion - Mass Transfer |
9 |
C.K. Larive, M. Lin, B.J. Piersma, and |
|
in Fluid Systems, Cambridge Universi- |
|
W.R. Carper, J. Phys. Chem. 1995, 99, |
|
ty Press, Cambridge, 1984. |
|
12,409. |
3 |
R. Haase, Thermodynamics of irre- |
10 |
W.S. Price, Concepts Magn. Reson. |
|
versible processes, Dover Publications, |
|
1997, 9, 299. |
|
Mineola (NY), 1990. |
11 |
W.S. Price, Concepts Magn. Reson. |
4 |
J. Crank, The Mathematics of Diffusion, |
|
1998, 10, 197. |
|
2nd ed., Clarendon Press, Oxford, |
12 |
U. Matenaar, J. Richter, and M.D. Zeid- |
|
1975. |
|
ler, J. Magn. Reson. A 1996, 122, 72. |
5 |
H. Weingärtner, in: Diffusion in Con- |
13 |
E. Marquardt and J. Richter, Opt. Eng. |
|
densed Matter (J. Kärger, P. Heitjans, |
|
1998, 37, 1514. |
|
and R. Haberlandt eds.), Vieweg, |
14 |
E. Marquardt, N. Großer, and |
|
Wiesbaden, 1998. |
|
J. Richter, Opt. Eng. 1997, 36, 2857. |
6 |
W.R. Carper, G.J. Mains, B.J. Piersma, |
15 |
A. Leuchter and J. Richter, High Temp. |
|
S.L. Mansfield, and C.K. Larive, |
|
Material Processes 1998, 2, 521. |
|
J. Phys. Chem. 1996, 100, 4724. |
16 |
C.L. Hussey, I.-W. Sun, S.K.D. Strub- |
7 |
N. Weiden, B. Wittekopf, and K.G. |
|
inger, and P.A. Barnard, J. Elec- |
|
Weil, Ber. Bunsenges. Phys. Chem. |
|
trochem. Soc. 1990, 137, 2515. |
|
1990, 94, 353. |
17 |
R.A. Osteryoung and M. Lipsztajn, |
|
|
|
J. Electrochem. Soc. 1985, 132, 1126. |

168Andreas Dölle, W. Robert Carper
4.5
Molecular Reorientational Dynamics
Andreas Dölle and W. Robert Carper
4.5.1
Introduction
Models for description of liquids should provide us with an understanding of the dynamic behavior of the molecules, and thus of the routes of chemical reactions in the liquids. While it is often relatively easy to describe the molecular structure and dynamics of the gaseous or the solid state, this is not true for the liquid state. Molecules in liquids can perform vibrations, rotations, and translations. A successful model often used for the description of molecular rotational processes in liquids is the rotational diffusion model, in which it is assumed that the molecules rotate by
small angular steps about the molecular rotation axes. One quantity to describe the rotational speed of molecules is the reorientational correlation time τ, which is a measure for the average time elapsed when a molecule has rotated through an angle of the order of 1 radian, or approximately 60°. It is indirectly proportional to the velocity of rotational motion.
4.5.2
Experimental Methods
A particularly important and convenient experimental method with which to obtain information on the reorientational dynamics of molecules is the measurement of
longitudinal or spin–lattice relaxation times T1 of peaks in nuclear magnetic resonance (NMR) spectra [1, 2]. These relaxation times describe how quickly a nuclear spin system reaches thermal equilibrium after disturbance of the system. Longitudinal relaxation is the relaxation process for the magnetization along the z axis, being parallel to the static magnetic field used in NMR spectroscopy. During this
relaxation process, energy is exchanged between the spin system and its environmentthe lattice. The measurement of 13C relaxation data [3] has great advantages for the study of the reorientational behavior of organic molecules; only one signal is usually obtained for each carbon atom in the molecule, so that the mobility or
flexibility of different molecular segments can be studied. Spin diffusion processes, dipolar 13C–13C interactions, and – for 13C nuclei with directly bonded protons – intermolecular interactions can be neglected. The dipolar 13C spin–lattice relaxation
rates 1/T1DD, which are related to the velocity of the molecular rotational motions (see below), are obtained by measurement of 13C spin–lattice relaxation rates 1/T1 and the nuclear Overhauser enhancement (NOE) factors η of the corresponding carbon atoms:
1 |
= |
h |
|
1 |
. |
(4.5-1) |
T DD |
1.988 |
|
T |
|
||
1 |
|
|
|
1 |
|
|

4.5 Molecular Reorientational Dynamics 169
A simple, but accurate way to determine spin–lattice relaxation rates is the inver- sion–recovery method [4]. In this experiment, the magnetization is inverted by a 180° radio frequency pulse and relaxes back to thermal equilibrium during a variable delay. The extent to which relaxation is gained by the spin system is observed after a 90° pulse, which converts the longitudinal magnetization into detectable transversal magnetization. The relaxation times for the different peaks in the NMR spectrum can be obtained by means of a routine for determination of the spin–lat- tice relaxation time, which is usually implemented in the spectrometer software. When the inversion–recovery pulse sequence is applied under 1H broadband decoupling conditions, only one signal is observed for each 13C nucleus and the relaxation is governed by only one time constant 1/T1. The NOE factors are obtained by comparing signal intensities Idec from 1H broadband decoupled 13C NMR spectra with those from inverse gated decoupled spectra Iigdec with the relationship
h = |
Idec |
−1. |
(4.5-2) |
|
|||
|
Iigdec |
|
|
4.5.3
Theoretical Background
Usually, nuclear relaxation data for the study of reorientational motions of molecules and molecular segments are obtained for non-viscous liquids in the extreme narrowing region where the product of the resonance frequency and the reorientational correlation time is much less than unity [1, 3, 5]. The dipolar 13C spin–lattice relaxation rate of 13C nucleus i is then directly proportional to the reorientational correlation time τi
( |
1 |
)ij = nH (2π Dij )2τp |
(4.5-3) |
|||||
DD |
||||||||
|
T |
|
|
|
|
|
|
|
1 |
|
|
|
|
|
|
|
|
with the dipolar coupling constant |
|
|||||||
Dij |
= |
|
m0 |
γCγH |
|
rij−3, |
(4.5-4) |
|
|
|
|||||||
|
|
|
|
4p |
2p |
|
||
where µ0 is the magnetic permeability of the vacuum, γC and γH are the magnetogyric ratios of the 13C and 1H nuclei, respectively, = h/2π , with the Planck constant , and rij is the length of the internuclear vector between 13C nucleus i and interacting proton j. For the relaxation of 13C nuclei with nH directly bonded protons, only interaction with these protons has to be taken into account.
Ionic liquids, however, are often quite viscous, and the measurements are thus beyond the extreme narrowing region. The relaxation rates hence become frequen- cy-dependent. Under these conditions, the equation for the spin–lattice relaxation rate becomes more complex:
|
1 |
|
= |
1 |
2 |
. (4.5-5) |
|
(T DD )ij |
20 |
(2pDij ) |
|||||
[Ji (wC − wH ) + 3Ji (wC ) + 6Ji (wC + wH )] |
|||||||
1 |
|
|
|
|
|
||

170 Andreas Dölle, W. Robert Carper
Here, the Ji terms are the spectral densities with the resonance frequencies ω of the 13C and 1H nuclei, respectively. It is now necessary to find an appropriate spectral density to describe the reorientational motions properly (cf. [6, 7]). The simplest spectral density commonly used for interpretation of NMR relaxation data is the one introduced by Bloembergen, Purcell, and Pound [8].
JBPP,i (w) = |
2tBPP,i |
(4.5-6) |
1+ (wtBPP,i )2 |
Cole and Davidson’s continuous distribution of correlation times [9] has found broad application in the interpretation of relaxation data of viscous liquids and glassy solids. The corresponding spectral density is:
J |
|
(w,t |
|
, b |
) = 2 |
|
sin (bi arctan (wtCD,i )) |
|
||
|
CD,i |
|
CD,i |
i |
|
w |
|
(1+(wtCD,i )2 )bi 2 |
. |
(4.5-7) |
Another way to describe deviations from the simple BPP spectral density is the socalled model-free approach of Lipari and Szabo [10]. This takes account of the reduction of the spectral density usually observed in NMR relaxation experiments. Although the model-free approach was first applied mainly to the interpretation of relaxation data of macromolecules, it is now also used for fast internal dynamics of small and middle-sized molecules. For very fast internal motions the spectral density is given by:
JLS,i (w) = Si2 Ji , |
(4.5-8) |
which simply means a reduction of the BPP or CD spectral density Ji by the generalized order parameter S2.
The resonance frequencies of the nuclei are given by the accessible magnetic field strengths through the resonance condition. Since the magnets used for NMR spectroscopy usually have fixed field strengths, the correlation times (that is, the rotational dynamics) have to be varied to leave the extreme narrowing regime. One way to vary the correlation times, and thus the spectral densities and relaxation data, is to change the temperature. The temperature dependence of the correlation times is often given by an Arrhenius equation:
ti = tA,i exp(EA,i / RT ), |
(4.5-9) |
with the gas constant R and the activation energy EA, interpreted below as a fit parameter representing a measure of the hindrance of the corresponding reorientational process.
4.5 Molecular Reorientational Dynamics 171
4.5.4
Results for Ionic Liquids
The measurement of correlation times in molten salts and ionic liquids has recently been reviewed [11] (for more recent references refer to Carper et al. [12]). We have measured the 13C spin–lattice relaxation rates 1/T1 and nuclear Overhauser factors η in temperature ranges in and outside the extreme narrowing region for the neat ionic liquid [BMIM][PF6], in order to observe the temperature dependence of the spectral density. Subsequently, the models for the description of the reorientational dynamics introduced in the theoretical section (Section 4.5.3) were fitted to the experimental relaxation data. The 13C nuclei of the aliphatic chains can be assumed to relax only through the dipolar mechanism. This is in contrast to the aromatic 13C nuclei, which can also relax to some extent through the chemical-shift anisotropy mechanism. The latter mechanism has to be taken into account to fit the models to the experimental relaxation data (cf. [1] or [3] for more details). Preliminary results are shown in Figures 4.5-1 and 4.5-2, together with the curves for the fitted functions.
Table 4.5-1 gives values for the fit parameters and the reorientational correlation times calculated from the dipolar relaxation rates.
The largest correlation times, and thus the slowest reorientational motion, were shown by the three 13C-1H vectors of the aromatic ring, with values of between approximately 60 and 70 ps at 357 K, values expected for viscous liquids like ionic liquids. The activation energies are also in the typical range for viscous liquids. As can be seen from Table 4.5-1, the best fit was obtained for a combination of the Cole–Davidson with the Lipari–Szabo spectral density, with a distribution parame-
13C relaxation rates 1/T1 of [BMIM][PF6] in the neat liquid as a function of reciprocal temperature T (∆: C2, ■ and :
C4 and C5, X: CH3(ring), +: CH3(butyl group), ●: CH2, lines: functions calculated with the fitted parameters).
|
10.0 |
|
|
|
–CH2–CH2–CH2–CH3 |
||
|
|
|
|
|
|||
|
s-1 |
|
|
|
|
|
|
1/T1 |
1.00 |
|
|
|
|
|
|
|
0.10 |
|
|
|
|
|
|
|
2.75 |
3.00 |
3.25 |
3.50 |
3.75 |
10-3 K-1 |
4.25 |
|
|
|
|
1/T |
|
|
|

172 Andreas Dölle, W. Robert Carper
2.50 |
|
|
|
|
|
|
2.00 |
|
|
|
|
|
|
1.50 |
|
|
|
|
|
|
η 1.00 |
|
|
|
|
|
|
0.50 |
|
|
|
|
|
|
0.00 |
|
|
|
|
|
|
2.75 |
3.00 |
3.25 |
3.50 |
3.75 |
10-3 K-1 |
4.25 |
|
|
|
1/T |
|
|
|
Figure 4.5-2: {1H}-13C NOE factors η for [BMIM][PF6] in the neat liquid as a function of reciprocal temperature T (∆: C2, and : C4 and C5, lines: functions calculated with the fitted parameters).
ter β of about 0.45. Cole–Davidson spectral densities are often found for glass-form- ing liquids. The ring can be taken as the rigid part of the molecule without internal flexibility, although a generalized order parameter S2 of less than unity was observed. The value of approximately 0.70 for S2 is explained by very fast motions such as librations in the cage of the surrounding molecules and vibrations. The reorientational correlation times of the aliphatic 13C nuclei are smaller than those of their aromatic ring counterparts, indicating the internal motion of the corresponding molecular segments. The flexibility in the butyl chain increases from the methylene group bound to the rigid and slowly moving imidazolium ring to the methyl group at the end. The other methyl group also exhibits fast motion compared to the rigid aromatic ring. The correlation times of the aliphatic carbons relative to those of the ring and their graduation in the chain are similar to those of alkyl chains in hydrocarbons of comparable size [13]. The experimental 13C spin–lat- tice relaxation rates for the aliphatic carbons could be fitted by a combination of the Lipari–Szabo with the BPP spectral density. The activation energies and the generalized order parameters decrease from the methylene group bound at the ring to the
Table 4.5-1: Reorientational correlation times τ at 357 K and fit parameters activation energy EA, Cole–Davidson distribution parameter β, and generalized order parameter S2.
|
C2 |
|
C4/C5 |
CH3 |
CH2 |
CH2–CH2–CH2 |
CH2–CH3 |
CH2–CH3 |
|
|
|
|
(ring) |
(ring) |
|
|
|
|
|
|
|
|
|
|
|
|
τi(357 K) (ps) |
63 |
65 |
68 |
1.0 |
46 |
26 |
16 |
4.7 |
EA,i (kJ·mol–1) |
38 |
37 |
38 |
27 |
32 |
26 |
26 |
20 |
βi |
0.46 |
0.43 |
0.44 |
|
|
|
|
|
S 2 |
0.65 |
0.73 |
0.73 |
0.059 |
0.37 |
0.38 |
0.28 |
0.075 |
i |
|
|
|
|
|
|
|
|

4.5 Molecular Reorientational Dynamics 173
methyl group at the end of the chain, this again being an indication of the increasing flexibility. The methyl groups had the smallest S2 value, approximately one tenth of the value for the rigid part of the molecule, which is the typical value for fast methyl group rotation.
The highly detailed results obtained for the neat ionic liquid [BMIM][PF6] clearly demonstrate the potential of this method for determination of molecular reorientational dynamics in ionic liquids. Further studies should combine the results for the reorientational dynamics with viscosity data in order to compare experimental correlation times with correlation times calculated from hydrodynamic models (cf. [14]). It should thus be possible to draw conclusions about the intermolecular structure and interactions in ionic liquids and about the molecular basis of specific properties of ionic liquids.
References
1 |
T. C. Farrar, E. D. Becker, Pulse and |
12 C. E. Keller, B. J. Piersma, G. J. Mains, |
|
Fourier Transform NMR. Introduction |
W. R. Carper, Inorg. Chem. 1994, 33, |
|
to Theory and Methods, Academic |
5601; C. E. Keller, W. R. Carper, |
|
Press, New York, 1971. |
J. Phys. Chem. 1994, 98, 6865; C. E. |
2 |
M. L. Martin, J.-J. Delpuech, G. J. Mar- |
Keller, B. J. Piersma, G. J. Mains, |
|
tin, Practical NMR Spectroscopy, Hey- |
W. R. Carper, Inorg. Chim Acta 1995, |
|
den, London, 1980. |
230, 185; C. E. Keller, B. J. Piersma, |
3 |
J. R. Lyerla, G. C. Levy, Top. Carbon-13 |
W. R. Carper, J. Phys. Chem. 1995, 99, |
|
NMR Spectrosc. 1972, 1, 79. |
12998; C. E. Keller, W. R. Carper, |
4 |
R. L. Vold, J. S. Waugh, M. P. Klein, |
Inorg. Chim. Acta, 1995, 238, 115; |
|
D. E. Phelps, J. Chem. Phys. 1968, 48, |
C. K. Larive, M. Lin, B. J. Piersma, |
|
3831. |
W. R. Carper, J. Phys. Chem. 1995, 99, |
5 |
A. Abragam: The Principles of Nuclear |
12409; W. R. Carper, G. J. Mains, B. J. |
|
Magnetism. Oxford University Press, |
Piersma, S. L. Mansfield, C. K. Larive, |
|
Oxford 1989. |
J. Phys. Chem. 1996, 100, 4724; C. K. |
6 |
P. A. Beckmann. Phys. Rep. 1988, 171, |
Larive, M. Lin, B. S. Kinnear, B. J. |
|
85. |
Piersma, C. E. Keller, W. R. Carper, |
7 |
A. Dölle, to be published. |
J. Phys. Chem. B 1998, 102, 1717. |
8 |
N. Bloembergen, E. M. Purcell, R. V. |
13 P. Gruhlke, A. Dölle, J. Chem. Soc., |
|
Pound, Phys. Rev. 1948, 73, 679. |
Perkin Trans. 2 1998, 2159. |
9 |
D. W. Davidson, R. H. Cole, J. Chem. |
14 R. P. Klüner, A. Dölle, J. Phys. Chem. |
|
Phys. 1951, 19, 1484. |
A 1997, 101, 1657. |
10G. Lipari, A. Szabo, J. Am. Chem. Soc. 1982, 104, 4546.
11W. R. Carper, Molten Salts, in Encyclopedia of Nuclear Magnetic Resonance
(D. M. Grant, R. K. Harris eds.), John Wiley & Sons, New York, 1995.
|
|
Ionic Liquids in Synthesis. Edited by Peter Wasserscheid, Thomas Welton |
|
|
Copyright © 2002 Wiley-VCH Verlag GmbH & Co. KGaA |
174 |
1 Kolumnentitel |
ISBNs: 3-527-30515-7 (Hardback); 3-527-60070-1 (Electronic) |
|
|
|
5
Organic Synthesis
Martyn Earle, Alain Forestièr, Hélène Olivier-Bourbigou, and Peter Wasserscheid
5.1
Stoichiometric Organic Reactions and Acid-Catalyzed Reactions in Ionic Liquids
Martyn Earle
The field of reaction chemistry in ionic liquids was initially confined to the use of chloroaluminate(III) ionic liquids. With the development of “neutral” ionic liquids in the mid-1990s, the range of reactions that can be performed has expanded rapidly. In this chapter, reactions in both chloroaluminate(III) ionic liquids and in similar Lewis acidic media are described. In addition, stoichiometric reactions, mostly in neutral ionic liquids, are discussed. Review articles by several authors are available, including: Welton [1] (reaction chemistry in ionic liquids), Holbrey [2] (properties and phase behavior), Earle [3] (reaction chemistry in ionic liquids), Pagni [4] (reaction chemistry in molten salts), Rooney [5] (physical properties of ionic liquids), Seddon [6, 7] (chloroaluminate(III) ionic liquids and industrial applications), Wasserscheid [8] (catalysis in ionic liquids), Dupont [9] (catalysis in ionic liquids) and Sheldon [10] (catalysis in ionic liquids).
Ionic liquids have been described as “designer solvents” [11]. Properties such as solubility, density, refractive index, and viscosity can be adjusted to suit requirements simply by making changes to the structure of either the anion, or the cation, or both [12, 13]. This degree of control can be of substantial benefit when carrying out solvent extractions or product separations, as the relative solubilities of the ionic and extraction phases can be adjusted to assist with the separation [14]. Also, separation of the products can be achieved by other means such as, distillation (usually under vacuum), steam distillation, and supercritical fluid extraction (CO2).
To many chemists it may seem daunting to perform reactions in ionic liquids, and the range of ionic liquids or potential ionic liquids available is very large. However, many scientists have found that performing reactions in ionic liquids is straightforward and practical when compared with similar reactions in conventional organic solvents. This is particularly the case when considering reactions nor-

5.1 Stoichiometric Organic Reactions and Acid-Catalyzed Reactions in Ionic Liquids 175
mally carried out in noxious and difficult to remove solvents such as dipolar aprotic solvents like dimethyl sulfoxide.
With the growing interest in ionic liquids, reactions were initially performed in various chloroaluminate(III) ionic liquids. Their strong solvating ability was an advantage, but their sensitivity to moisture and strong interactions with certain commonly occurring functional groups limited the scope of reactions in these media. With the discovery of water-stable “neutral” ionic liquids, the range and scope of reactions that can be performed has grown to include most classes of reactions covered in organic chemistry textbooks [15], and the vast majority of reactions in ionic liquids are now carried out in these water-stable variants.
5.1.1
Stoichiometric Organic Reactions
Stoichiometric – or, more simply, non-catalytic – reactions are an important and rapidly expanding area of research in ionic liquids. This section deals with reactions that consume the ionic liquid (or molten salt) or use the ionic liquid as a solvent.
5.1.1.1Molten salts as reagents
Molten salts have been used for many years, in the form of reagents such as fused KOH, pyridinium chloride, and tetrabutylammonium fluoride (TBAF) [4]. One of the earliest molten salts to be used in synthesis is KOH, with examples dating from 1840 [16]. One common use is in the reaction of fused KOH with arenesulfonic acids to produce phenols. Although KOH has a high melting point (410 °C), impurities such as traces of water or carbonates bring the melting point down. An example is given in Scheme 5.1-1 [17, 18].
A number of examples of the use of molten pyridinium chloride (mp 144 °C) in chemical synthesis are known, dating back to the 1940’s. Pyridinium chloride can act both as an acid and as a nucleophilic source of chloride. These properties are exploited in the dealkylation reactions of aromatic ethers [4]. An example involving the reaction of 2-methoxynaphthalene is given in Scheme 5.1-2 [16, 18], and a mechanistic explanation in Scheme 5.1-3 [18].
Pyridinium chloride ([PyH]Cl) has also been used in a number of cyclization reactions of aryl ethers (Scheme 5.1-4) [4, 18]. Presumably the reaction initially proceeds by dealkylation of the methyl ether groups to produce the corresponding phenol. The mechanism of the cyclization is not well understood, but Pagni and Smith have suggested that it proceeds by nucleophilic attack of an Ar-OH or Ar-O– group on the second aromatic ring (in a protonated form) [4].
SO3- |
|
|
|
O |
- |
|
|
252 °C |
|
|
|
+ SO32- + 2 K+ |
|
+ 2 KOH |
|
|
|
|
||
|
|
|
|
|
+ H2O |
|
|
|
|
|
|
|
|
|
|
|
|
|
|
|
Scheme 5.1-1: The reaction of benzenesulfonates with fused KOH.