

Wasserscheid P., Welton T. - Ionic Liquids in Synthesis (2002)(en)
.pdf146 Chris Hardacre
of the substrate, the X-rays may be reflected from the top and the bottom of the film, which gives rise to interference and an oscillatory pattern with changing angle of incidence, known as Kiessig fringes. The pattern obtained is a function of the difference in electron density and roughness at each interface present; rough films give rise to a reduction in the amplitude of the oscillation observed. Analysis of this variation gives information principally about the interfaces, but may also be used to investigate chain layering, in metal soaps, for example [52].
4.1.8.1Experimental set-up
X-ray reflectivity experiments for thin films of liquids and so on are commonly performed on silicon single-crystal wafers, the X-rays being reflected off the surface of the wafer [53]. To enable good adhesion, the wafers have to be cleaned (in concentrated nitric acid with subsequent UV-O3 treatment, for example) to remove any trace organics. Deposition of the films can then be performed by spin coating from a solution of the salt in a volatile organic solvent. In general, the spin-coated films are too rough to give good reflectivity spectra and the films need to be pre-annealed. X-ray reflectivity measurements may be performed with a laboratory X-ray source as well as with synchrotron radiation. Figure 4.1-14 shows a typical cell used for reflectivity measurements.
4.1.8.2Examples
Carmichael et al. [54] have used this technique to compare the structures of thin
films of [C18MIM][PF6], [C18MIM][BF4], [BMIM]2[PdCl4], [C12MIM]2[PdCl4], and [C12MIM][PF6] to bulk solutions as studied by small-angle X-ray scattering. Bragg
features were clearly visible for all the salts studied; but in most cases the additional Kiessig fringes were not observed. Figure 4.1-15 shows an example of data collected on a thin film of [C18MIM][PF6].
The Bragg peaks indicated an ordered local structure within the sample film, and the interlayer spacings were reproduced compared with the bulk samples, with only
Figure 4.1-14: A typical cell used for X-ray reflectivity measurements.
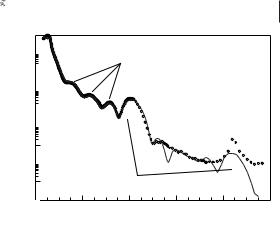
Figure 4.1-15: Experimental reflectivity data (points) compared with a five-bilayer model (solid line) for a 156 Å thick [C18MIM][PF6] films at 298 K. Reproduced from reference 54 with permission.
Intensity (a.u.)
4.1 Order in the Liquid State and Structure 147
1x100 
Kiessig Fringes
1x10⁻² 

1x10⁻⁴ 

1x10⁻⁶ |
|
1x10⁻⁸ |
Diffraction |
0 |
0.1 |
0.2 |
0.3 |
0.4 |
0.5 |
|
|
|
Qz / Å-1 |
|
|
minor shifts in layer spacing. The small changes in layer spacing would be expected, since the thin film structure is not constrained by long-range order effects and hence adopts a slightly different, lower-energy form. The similarity between the bulk samples and the thin film was further demonstrated in the case of [C18MIM][PF6] by modeling of the Kiessig fringes. This model was comprised of layers of associated 1-ethyl-3-methylimidazolium cation head-groups and hexafluorophosphate anions, denoted as the charged region, separated by hydrocarbon chains. Reasonable fits were only obtained with the charged region at the salt–sili- con and the salt–air interfaces.
Although this technique has not been used extensively, it does allow structures of adsorbed layers on solid substrates to be studied. Liquid reflectivity may also be performed with a similar set-up, which relies on a liquid–liquid interface acting as the reflective surface and measures the reflectivity of a thin supported liquid film. This technique has recently been used to investigate water–alkane interfaces [55] and is potentially useful in understanding the interaction of ionic liquids with molecular solvents in which they are immiscible.
4.1.9
Direct Recoil Spectrometry (DRS)
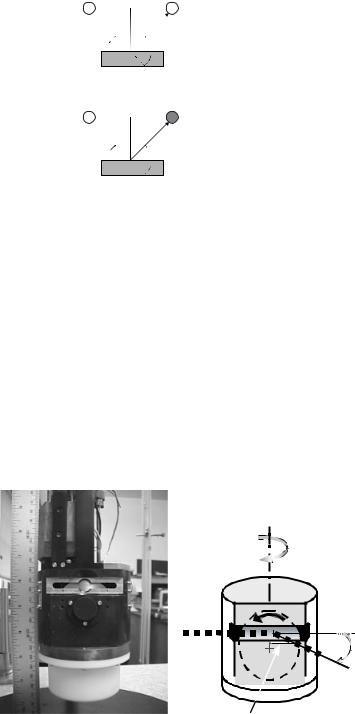
The surface structures of ionic liquids have been studied by direct recoil spectrometry. In this experiment, a pulsed beam of 2–3 keV inert gas ions is scattered from a liquid surface, and the energies and intensities of the scattered and sputtered (recoiled) ions are measured as a function of the incident angle, α, of the ions. Figure 4.1-16 shows a scheme of the process for both the scattered and sputtered ions.
The incident ions cause recoil in the surface atoms. In studies of ionic liquids, only direct recoil – that is, motion in the forward direction – was measured. Watson and co-workers [56, 57] used time-of-flight analysis with a pulsed ion beam to measure the kinetic energies of the scattered and sputtered ions and therefore determine the masses of the recoiled surface atoms. By relating the measured intensities of the
148 |
Chris Hardacre |
|
|
|
|
+ |
Figure 4.1-16: Schematic of the scattering process, showing |
+ |
|||
|
|
|
the scattered ions and the recoiled ions. The figure has been |
|
|
|
redrawn from reference 57 with permission. |
 α
α 
 θ
θ


Scattered ions
+
 α
α 
 φ
φ

Sputtered(recoiled) ions
sputtered atoms to the scattering cross section, the surface concentration may be found. The variation of intensity with incident angle also allowed the orientation of the atoms on the surface to be elucidated. The scattered and sputtered ions are detected at angles of θ and φ, respectively, measured with respect to the incident ion beam. For all experiments so far reported on ionic liquids, θ and φ have been equal.
4.1.9.1Experimental set-up
Direct recoil spectrometry requires high and ultra-high vacuum conditions for the transport of ions to the sample and to the detector. In this regard, the use of ionic liquids, with their corresponding low vapor pressures, is ideal. To prevent contamination of the surface and any surface charging effects, Watson and co-workers used a rotating stainless steel wheel partially submerged in a reservoir holding the liquid sample, to create a fresh liquid surface continually. Before analysis, the liquid film passed by a blade, leaving a fresh surface approximately 0.1–0.2 mm thick. Figure 4.1-17 shows the typical sample set-up [58].
ion beam
scraper blade
θ, φ = 45`
Figure 4.1-17: The experimental set-up used to generate thin films of ionic liquid for analysis by direct recoil spectrometry. Reproduced from reference 58 with permission.

4.1 Order in the Liquid State and Structure 149
4.1.9.2Examples
A number of ionic liquids – namely [OMIM][PF6], [BF4]–, Br–, Cl–; [BMIM][PF6], [BF4]–, and [C12MIM][BF4] – have been studied by DRS. The scattering profile as a function of the incident angle for [OMIM][PF6] is shown in Figure 4.1-18.
The charged species were in all cases found to concentrate at the surface of the liquid under vacuum conditions. Little surface separation of the anions and cations was observed. For the [PF6]– and [BF4]– ions, the cation ring was found to prefer a perpendicular orientation to the surface, with the nitrogen atoms closest to the surface. An increase in the alkyl chain length caused the cation to rotate so that the alkyl chain moved into the bulk liquid, away from the surface, forcing the methyl group closer to the surface. For halide ionic liquids, the data were less clear and the cation could be fitted to a number of orientations.
4.1.10
Conclusions
A wide range of structural techniques may be utilized for the study of ionic liquids and dissolved species. Overall, in both high-temperature and low-temperature ionic
Figure 4.1-18: Ion intensity as a function of incident angle measured using time of flight direct recoil spectrometry on [OMIM][PF6]. Reproduced from reference 57 with permission.

150 Chris Hardacre
liquids, as well as for mixtures, a close correlation between the solid structure and liquid is found. In many cases, significant intermediate order is observed, for example in the form of charge ordering.
Acknowledgements
CH would like to thank Daniel Bowron (CLRC, Rutherford Appleton Laboratory), Fred Mosselmanns (CLRC, Daresbury Laboratory), Will Pitner (The Queen’s University of Belfast), Nick Terrill (CLRC, Daresbury Laboratory), and Philip Watson (University of Oregon) for contributing figures, as well as for useful discussions and comments in the preparation of this manuscript.
References
1D.T. Bowron, J.L. Finney, A.K. Soper,
J. Phys. Chem. 1998, B102, 3551–3563.
2 C. Hardacre, J.D. Holbrey, S.E.J. McMath, J. Chem. Soc. Chem. Commun. 2001, 367–368.
3 F.G. Edwards, J.E. Enderby, R.A. Howe, D.I. Page, J. Phys. C 1975, 8, 3483–3490; S. Biggin, J.E. Enderby, J. Phys. C 1982, 15, L305–309.
4 M. Blander, E. Bierwagen, K.G. Calkins, L.A. Curtiss, D.L. Price, M.-L. Saboungi, J. Chem. Phys. 1992, 97, 2733–2741.
5 S.J. Cyvin, P. Klaeboe, E. Rytter, H.A. Øye, J. Chem. Phys. 1970, 52, 2776;
J. Hvistendahl, P. Klaeboe, E. Rytter, H.A. Øye, Inorg. Chem. 1984, 23, 706–715.
6 Y.S. Badyal, D.A. Allen, R.A. Howe,
J. Phys.: Condens. Matter 1994, 6,
10,193–10,220.
7 Y.-C. Lee, D.L. Price, L.A. Curtiss, M.A. Ratner, D.F. Shriver, J. Chem. Phys. 2001, 114, 4591–4594.
8 S. Takahashi, K. Suzuya, S. Kohara, N. Koura, L.A. Curtiss, M.-L. Saboungi, Z. Phys. Chem. 1999, 209, 209–221.
9 P.C. Truelove, D. Haworth, R.T. Car-
lin, A.K. Soper, A.J.G. Ellison, D.L. Price, Proc. 9th Int. Symp. Molten Salts, San Fransisco 1994, 3, 50–57, (Pennington, NJ: Electrochem. Soc.).
10F.R. Trouw, D.L. Price, Ann. Rev. Phys. Chem. 1999, 50, 571–601.
11D.T. Bowron, C. Hardacre, J.D. Holbrey, S.E.J. McMath, A.K. Soper,
J.Chem. Phys. Submitted.
12P.A. Egelstaff, D.I. Page, J.G. Powles,
Mol. Phys. 1971, 20, 881 and Mol. Phys.
1971, 22, 994.
13A.K. Soper, Chem. Phys. 1996, 202, 295–306; A.K. Soper, Chem. Phys. 2000, 258, 121–137.
14F. Vaslow, A.H. Narten, J. Chem. Phys. 1973, 59, 4949–4954.
15S. Takahashi, K. Maruoka, N. Koura,
H.Ohno, J. Chem. Phys. 1986, 84, 408–415; S. Takahashi, T.N. Muneta,
N.Koura, H. Ohno, J. Chem. Soc. Faraday Trans. II 1985, 81, 1107–1115.
16K. Igarashi, Y. Okamoto, J. Mochinaga, H. Ohno, J. Chem. Soc. Faraday Trans. I 1988, 84, 4407–4415.
17S. Takahashi, N. Koura, M. Murase,
H.Ohno, J. Chem. Soc. Faraday Trans.
II1986, 82, 49–60.
18C.J. Bowlas, D.W. Bruce, K.R. Seddon,
J.Chem. Soc. Chem. Commun. 1996, 1625–1626.
19R. Kind, S. Plesko, H. Arend, R. Blinc,
B.Zeks, J. Seliger, B. Lozar, J. Slak,
A. Levstik, C. Filipic, V. Zagar,
G. Lahajnar, F. Milia, G. Chapuis,
J. Chem. Phys. 1979, 71, 2118–2130.
|
|
4.1 Order in the Liquid State and Structure |
151 |
|
|
|
|
|
|
20 |
C.M. Gordon, J.D. Holbrey, A. |
35 |
J. Jaklevic, J.A. Kirby, M.P. Klein, A.S. |
|
|
Kennedy, K.R. Seddon, J. Mater. |
|
Robertson, G.S. Brown, P. Eisenber- |
|
|
Chem. 1998, 8, 2627–2636. J.D. Hol- |
|
ger, Solid State Commun. 1977, 23, |
|
|
brey, K.R. Seddon, J. Chem. Soc., Dal- |
|
1679. |
|
|
ton Trans. 1999, 2133–2139. |
36 |
J.C. Mikkelsen, J.B. Boyce, R. Allen, |
|
21 |
P.B. Hitchcock, K.R. Seddon, T. Wel- |
|
Rev. Sci. Instr. 1980, 51, 388–389. |
|
|
ton, J. Chem. Soc., Dalton Trans. 1993, |
37 |
A.L. Ankudinov, B. Ravel, J.J. Rehr, |
|
|
2639–2643. |
|
S.D. Conradson, Phys. Rev. B 1998, 58, |
|
22 |
F. Neve, A. Crispini, S. Armentano, |
|
7565–7576. J.J. Rehr, R.C. Albers, |
|
|
O. Francescangeli, Chem. Mater. 1998, |
|
Phys. Rev. B 1990, 41, 8139–8149. |
|
|
10, 1904–1913. |
38 |
A. Filipponi, A. Di Cicco, C.R. Natoli, |
|
23 |
F. Neve, O. Francescangeli, A. Crispi- |
|
Phys. Rev. B 1995, 52, 15,122–15,134. |
|
|
ni, J. Charmant, Chem. Mater. 2001, |
39 |
N. Binsted, EXCURV98: CCLRC |
|
|
13, 2032–2041. |
|
Daresbury Laboratory computer pro- |
|
24 |
C. Hardacre, J.D. Holbrey, P.B. |
|
gram, 1998. |
|
|
McCormac, S.E.J. McMath, M. |
40 |
A. Filipponi, J. Phys.: Condensed Matter |
|
|
Nieuwenhuyzen, K.R. Seddon, |
|
2001, 13, R23–60. |
|
|
J. Mater. Chem. 2001, 11, 346–350. |
41 |
J.J. Rehr, R.C. Albers, Rev. Mod. Phys. |
|
25 |
J.D. Martin, R. D. Rogers and K. R. |
|
2000, 72, 621–654. |
|
|
Seddon (Eds) ACS Symposium Series |
42 |
A. Di Cicco, M. Minicucci, A. Filip- |
|
|
818, ACS Washington DC, 2002, |
|
poni, Phys. Rev. Lett. 1997, 78, |
|
|
p. 413–427. |
|
460–463; M. Minicucci, A. Di Cicco, |
|
26 |
G.F. Needham, R.D. Willett, H.F. |
|
Phys. Rev. B 1997, 56, 11,456–11,464. |
|
|
Franzen, J. Phys. Chem. 1984, 88, |
43 |
A. Di Cicco, J. Phys.: Condensed Matter |
|
|
674–680. |
|
1996, 8, 9341–9345. |
|
27 |
A.E. Bradley, C. Hardacre, J. D. Hol- |
44 |
L. Hefeng, L. Kunquan, W. Zhonghua, |
|
|
brey, S. Johnston, S. E. J. McMath, |
|
D. Jun, J. Phys.: Condensed Matter |
|
|
M. Nieuwenhuyzen, Chem. Mater, |
|
1994, 6, 3629–3640. |
|
|
2002, 14, 629–635. |
45 |
A.J. Carmichael, C. Hardacre, J.D. |
|
28 |
V. Busico, P. Corradini, M. Vacatello, |
|
Holbrey, M. Nieuwenhuyzen, K.R. |
|
|
J. Phys. Chem. 1982, 86, 1033–1034. V. |
|
Seddon, Anal. Chem. 1999, 71, |
|
|
Busico, P. Cernicchlaro, P. Corradini, |
|
4572–4574. |
|
|
M. Vacatello, J. Phys. Chem. 1983, 87, |
46 |
A.J. Dent, K.R. Seddon, T. Welton, |
|
|
1631–1635. |
|
J. Chem. Soc. Chem. Commun. 1990, |
|
29 |
D.J. Abdallah, A. Robertson, H.–F. |
|
315–316. |
|
|
Hsu, R.G. Weiss, G., J. Am. Chem. |
47 |
A.J. Dent, A. Lees, R.J. Lewis, T. Wel- |
|
|
Soc. 2000, 122, 3053–3062. |
|
ton, J. Chem. Soc. Dalton Trans. 1996, |
|
30 |
F. Artzner, M. Veber, M. Clerc, A.-M. |
|
2787–2792. |
|
|
Levelut, Liq. Cryst. 1997, 23, 27–33. |
48 |
G.M.N. Baston, A.E. Bradley, T. Gor- |
|
31 |
K.M. Lee, C.K. Lee, I.J.B. Lin, J. Chem. |
|
man, I. Hamblett, C. Hardacre, J.E. |
|
|
Soc., Chem. Commun. 1997, 899–900. |
|
Hatter, M.J.F. Healy, B. Hodgson, R. |
|
32 |
C. Cruz, B. Heinrich, A.C. Ribeiro, |
|
Lewin, K.V. Lovell, G.W.A. Newton, |
|
|
D.W. Bruce, D. Guillon, Liq. Cryst. |
|
M. Nieuwenhuyzen, W.R. Pitner, |
|
|
2000 27, 1625–1631; D.W. Bruce, S. |
|
D.W. Rooney, D. Sanders, K.R. Sed- |
|
|
Estdale, D. Guillon, B. Heinrich, Liq. |
|
don, H.E. Simms, R.C. Thied, R. D. |
|
|
Cryst. 1995, 19, 301–305. |
|
Rogers and K. R. Seddon (Eds) ACS |
|
33 |
E.J.R. Sudhölter, J.B.F.N. Engberts, |
|
Symposium Series 818, ACS Washing- |
|
|
W.H. de Jeu, J. Phys. Chem. 1982, 86, |
|
ton DC, 2002, p. 162–177. Industrial |
|
|
1908–1913. |
|
Applications of Ionic Liquids. |
|
34 |
Y. Haramoto, S. Ujiie, M. Nanasawa, |
49 |
J.J. Laidler, J.E. Battles, W.E. Miller, |
|
|
Liq. Cryst. 1996, 21, 923–925, Y. |
|
J.P. Ackerman, E.L. Carls, Progress in |
|
|
Haramoto, M. Nanasawa, S. Ujiie, |
|
Nuclear Energy 1997, 31, 131. |
|
|
Liq. Cryst. 2001, 28, 557–560. |
|
|
|

152 |
W. Robert Carper, Zhizhong Meng, Andreas Dölle |
|
|
|
|
|
N.A. Hamill, C. Hardacre, S.E.J. |
|
D.M. Mitrinovic, Z. Zhang, S.M. |
50 |
55 |
|||
|
|
McMath, Green Chemistry, 2002, 4, |
|
Williams, Z. Huang, M.L. Schloss- |
|
|
143–146. |
|
man, J. Phys. Chem. 1999, 103, |
51 |
X.-L. Zhou, S.-H. Chen, Phys. Rep. |
|
1779–1782. |
|
|
|
1995, 257, 223–348. |
56 |
T.J. Gannon, G. Law, P.R. Watson, |
52 |
U. Englisch, F. Peñacorada, L. |
|
A.J. Carmichael, K.R. Seddon, Lang- |
|
|
|
Brehmer, U. Pietsch, Langmuir 1999, |
|
muir 1999, 15, 8429–8434; G. Law, |
|
|
15, 1833–1841. |
|
P.R. Watson, Chem. Phys. Lett. 2001, |
53 |
M.F. Toney, C.M. Mate, K.A. Leach, |
|
345, 1–4. |
|
|
|
D. Pocker, J. Coll. Int. Sci. 2000, 225, |
57 |
G. Law, P.R. Watson, A.J. Carmichael, |
|
|
219–226. |
|
K.R. Seddon, Phys. Chem. Chem. Phys. |
54 |
A.J. Carmichael, C. Hardacre, J.D. |
|
2001, 3, 2879–2885. |
|
|
|
Holbrey, M. Nieuwenhuyzen, K.R. |
58 |
M Tassotto, PhD Thesis, Dept. of |
|
|
Seddon, Mol. Phys. 2001, 99, 795–800. |
|
Physics, Oregon State University, |
|
|
|
|
2000. |
4.2
Quantum Mechanical Methods for Structure Elucidation
W. Robert Carper, Zhizhong Meng, and Andreas Dölle
4.2.1
Introduction
The description of electronic distribution and molecular structure requires quantum mechanics, for which there is no substitute. Solution of the time-independent Schrödinger equation, Hψ = Eψ, is a prerequisite for the description of the electronic distribution within a molecule or ion. In modern computational chemistry, there are numerous approaches that lend themselves to a reasonable description of ionic liquids. An outline of these approaches is given in Scheme 4.2-1 [1]:
|
HF equations |
additional |
addition of more |
approximations |
determinants |
|
|
Scheme 4.2-1: Approaches used to |
semi–empirical |
convergence to exact |
describe ionic liquids in computa- |
methods |
solution |
tional chemistry. |
4.2.2 |
|
|
Choice of Quantum Mechanical Methods
The choices of quantum mechanical method typically include the semi-empirical methods AM1, PM3, and MNDO/d [2–4]. These three methods (and some of their variations) are those most commonly used in the current literature. Of these semiempirical methods, only MNDO/d includes the effects of d-orbitals. Some of the problems associated with these semiempirical methods include:

4.2 Quantum Mechanical Methods for Structure Elucidation 153
(a)rotational barriers for bonds with partial double bond character are too low,
(b)non-bonding interactions, such as in van der Waals complexes or hydrogen bonds, are poorly reproduced with AM1 and
(c)nitrogen-containing groups often give pyramidal structures with PM3, when this is incorrect.
Despite these inconsistencies, the semi-empirical methods produce bond angles, bond lengths and heats of formation that are in reasonable agreement with experimental results. A new version, PM5, will soon be available and is four times more accurate than AM1 or PM3. The advantage of PM5 over the other semi-empirical methods is that d-orbitals are being introduced [5].
The ab initio methods used by most investigators include Hartree–Fock (HF) and Density Functional Theory (DFT) [6, 7]. An ab initio method typically uses one of many basis sets for the solution of a particular problem. These basis sets are discussed in considerable detail in references [1] and [8]. DFT is based on the proof that the ground state electronic energy is determined completely by the electron density [9]. Thus, there is a direct relationship between electron density and the energy of a system. DFT calculations are extremely popular, as they provide reliable molecular structures and are considerably faster than HF methods where correlation corrections (MP2) are included. Although intermolecular interactions in ion-pairs are dominated by dispersion interactions, DFT (B3LYP) theory lacks this term [10–14]. However, DFT theory is quite successful in representing molecular structure, which is usually a primary concern.
The investigator’s choice of method (semi-empirical or ab initio) hinges on a number of factors, one of which is simple practicality concerning both time and expense. Semi-empirical methods usually give reasonable molecular structures and thermodynamic values at a fraction of the cost of ab initio calculations. Furthermore, molecular structures calculated by semi-empirical methods are the starting point for more complex ab initio calculations.
The advantages of ab initio calculations are considerable, but they come at a high cost. One of the many factors that affect the cost of computation is the choice of basis set. Often (not always!) one discovers that accuracy of physical parameters (and molecular structure) increases with the size of the basis set. Unfortunately, the formal scaling of HF methods is approximately N4 (N3 or less for semiempirical methods), where N is the number of basis functions. Hence, one quickly discovers that the solution of a problem requiring a few hours with a low-order basis set (3-21G(*)) may end up taking several days with a higher-order basis set such as 6-31G(d,p) or 6-31G(dp,p) [1, 8]. Fortunately, many investigators now have access to high-speed parallel processor computers that can handle such large calculations.
4.2.3
Ion-pair Models and Possible Corrections
Typically, the ionic liquid is best considered as an ion-pair (or ion, on an individual basis). The main forces of attraction between the ions are the electrostatic forces and dispersion (van der Waals) forces. At intermediate distances, there is a slight
154 W. Robert Carper, Zhizhong Meng, Andreas Dölle
attraction between the electron clouds of the ions. This is due to the phenomenon known as electron correlation, which is important in Hartree–Fock calculations. This correction is not necessary in completely parameterized semi-empirical methods.
The size of the ion-pair may dictate the method of calculation, although the increasing speed of computers, coupled with improved programming, encourage many to begin at the ab initio level of calculation. There are two types of corrections that should be considered with ab initio calculations. If one is working with neutral molecules, then BSSE (basis set superposition error) correction [15, 16] is necessary if one is accurately to determine values of hydrogen bonds in molecular complexes. With ion-pairs, however, the 4 to 8 kJ correction factor with BSSE is minimal compared with the correlation energy correction typically introduced with the use of Møller–Plesset perturbation theory [17]. The use of MP corrections at the 2nd level (MP2) is a computer-intense correction and limits many calculations to very small molecular systems. This fact, coupled with the speed of density functional (DFT) calculations, has encouraged many investigators to use DFT when computer time is either expensive or in short supply [1, 8, 16]. The main advantage of DFT ab initio calculations is that the resulting molecular structure is usually accurate, although energies may be in doubt.
4.2.4
Ab Initio Structures of Ionic Liquids
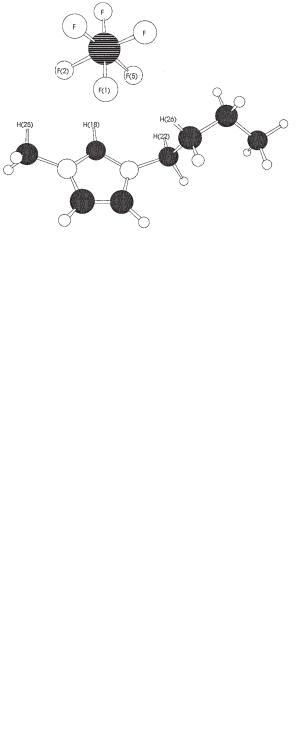
Figure 4.2-1 shows the calculated ab initio molecular structure of the ionic liquid [BMIM][PF6] (1-butyl-3-methylimidazolium hexafluorophosphate).
The basis set is 6-31G(d,p), and electron correlation at the MP2 level is included. A similar structure is obtained with the AM1 and PM3 semi-empirical methods. Density functional theory at the B3LYP/6-31G(dp,p) level also produced the same structure for this ion-pair. The only observed differences between the semi-empiri- cal and the ab initio structures were slightly shorter hydrogen bonds (PM3 and AM1) between F1, F2, and F5 and the C2-H (H18) on the imidazolium ring.
Figure 4.2-1: Molecular structure of [BMIM][PF6] (MP2/ 6-31G(d,p)). C-H–F distances are: 2.319 Å (H25-F2), 2.165 Å (H18-F2), 2.655 Å (H18-F1), 2.173 Å (H18-F5), 2.408 Å (H22-F5), 2.467 Å (H26-F1), and 2.671 Å (H26-F5). All
H–F distances are less than the H–F van der Waals distance of 2.67 Å (see ref. [18]).
4.2 Quantum Mechanical Methods for Structure Elucidation 155
Figure 4.2-2: Molecular structure of [NMIM][PF6] (MP2/ 6-31G(d,p)). C-H–F distances are: 2.355 Å (H9-F1), 2.198 Å (H8-F41), 2.636 Å (H8-F46), 2.164 Å (H8-F44), 2.439 Å (H15-F44), 2.403 Å (H19-F46), and 2.582 Å (H19-F44). All H–F distances are less than the H–F van der Waals distance of 2.67 Å (see ref. [18]).
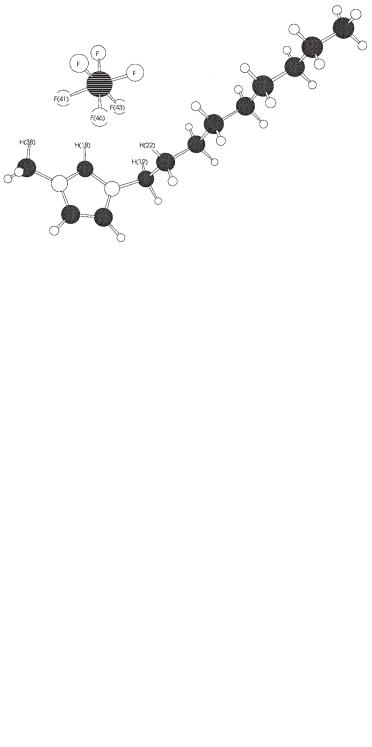
Another ionic liquid, containing a nonyl-rather than a butyl-side chain, is shown in Figure 4.2-2. There is little difference between the basic structures of these two ion-pairs (Figures 4.2-1 and 4.2-2) with respect to the non-bonded interactions (hydrogen bonds) occurring between the F atoms on the anion and the C-H moieties on the imidazolium cation.
4.2.5
DFT Structure of 1-Methyl-3-nonylimidazolium Hexafluorophosphate
Figure 4.2-3 contains the DFT (B3LYP) structure of [NMIM][PF6] obtained with a 6-31G(d,p) basis set. Here one observes C-H–F hydrogen bonds shorter than those obtained from the MP2/6-31G(d,p) calculation shown in Figure 4.2-2.
Note that DFT structures are as reliable as or more reliable than HF structures obtained with similar or less complex basis sets.
Figure 4.2-3: Molecular structure of [NMIM][PF6] (B3LYP/6-31G(d,p)).
C-H–F distances are:
2.293 Å (H38-F41), 2.094 Å
(H18-F41), 2.441 Å
(H18-F46), 2.051 Å
(H18-F43), 2.482 Å
(H19-F43), 2.296 Å
(H22-F46), and 2.568 Å
(H22-F43). All H–F distances are less than the H–F van der Waals distance of 2.67 Å (see ref. [18]).