

Wasserscheid P., Welton T. - Ionic Liquids in Synthesis (2002)(en)
.pdf106 Paul C. Trulove Robert A. Mantz
Table 3.6-1: The room-temperature electrochemical potential windows for non-haloaluminate ionic liquids.
Cation |
Anion(s) |
Working |
Window (V) |
Ref. |
|
|
electrodec |
|
|
|
|
|
|
|
Ammonium |
|
|
|
|
[(n-C3H7)(CH3)3N]+ |
[(CF3SO2)2N]– |
GC |
5.7 |
19a |
[(n-C6H13)(C2H5)3N]+ |
[(CF3SO2)2N]– |
GC |
4.5b |
20 |
[(n-C8H17)(C2H5)3N]+ |
[(CF3SO2)2N]– |
GC |
5.0 |
20 |
[(n-C8H17)(C4H9)3N]+ |
[(CF3SO2)2N]– |
GC |
5.0 |
20 |
[(CH3)3(CH3OCH2)N]+ |
[(CF3SO2)2N]– |
GC |
5.2 |
19a |
1-butyl-1-methyl-pyrrolidinium |
[(CF3SO2)2N]– |
GC |
5.5 |
21 |
Imidazolium |
|
|
|
|
[EMIM]+ |
F– |
Pt |
3.1 |
22a |
[EMIM]+ |
[BF4]– |
Pt |
4.3 |
23a |
[EMIM]+ |
[BF4]– |
Pt |
4.5 |
24 |
[EMIM]+ |
[CH3CO2]– |
Pt |
3.6 |
25a |
[EMIM]+ |
[CF3CO2]– |
Pt |
3.8b |
26a |
[EMIM]+ |
[CF3SO3]– |
Pt |
4.1 |
26a |
[EMIM]+ |
[CF3SO3]– |
Pt |
4.3 |
25a |
[EMIM]+ |
[(CF3SO2)2N]– |
GC |
4.1 |
27 |
[EMIM]+ |
[(CF3SO2)2N]– |
Pt |
4.5 |
26a |
[EMIM]+ |
[(CF3SO2)2N]– |
GC |
4.5 |
19a |
[EMIM]+ |
(C2F5SO2)2N– |
GC |
4.1 |
27 |
[BMIM]+ |
[BF4]– |
Pt |
4.1 |
14 |
[BMIM]+ |
[PF6]– |
Pt |
4.2 |
14 |
[EMMIM]+ |
[(CF3SO2)2N]– |
Pt |
4.7 |
26a |
[PMMIM]+ |
[(CF3SO2)2N]– |
GC |
4.3 |
27 |
[PMMIM]+ |
[(CF3SO2)2N]– |
GC |
5.2 |
28 |
[PMMIM]+ |
(CF3SO2)3C– |
GC |
5.4 |
28 |
[PMMIM]+ |
[PF6]– |
GC |
4.3d |
28e |
[PMMIM]+ |
[AsF6]– |
GC |
4.4d |
28e |
Pyrazolium |
|
|
|
|
1,2-dimethyl-4-fluoropyrazolium |
[BF4]– |
GC |
4.1 |
29 |
Pyridinium |
|
|
|
|
[BP]+ |
[BF4]– |
Pt |
3.4 |
23 |
Sulfonium |
|
|
|
|
[(C2H5)3S]+ |
[(CF3SO2)2N]– |
GC |
4.7 |
30 |
[(n-C4H9)3S]+ |
[(CF3SO2)2N]– |
GC |
4.8 |
30 |
|
|
|
|
|
a Voltage window estimated from cyclic voltammograms contained in the reference. b Voltage window may be limited by impurities.
c Working electrode, Pt = platinum, GC = glassy carbon, W = tungsten. d Voltage window at 80 oC.
e Voltage window determined assuming cathodic limit of 0.63 V vs. Li/Li+ reference.
3.6 Electrochemical Properties of Ionic Liquids |
107 |
|
|
As shown in Figure 3.6-1, GC and Pt exhibit anodic and cathodic potential limits that differ by several tenths of volts. However, somewhat fortuitously, the electrochemical potential windows for both electrodes in this ionic liquid come out to be 4.7 V. What is also apparent from Figure 3.6-1 is that the GC electrode exhibits no significant background currents until the anodic and cathodic potential limits are reached, while the Pt working electrode shows several significant electrochemical processes prior to the potential limits. This observed difference is most probably due to trace amounts of water in the ionic liquid, which is electrochemically active on Pt but not on GC (vide supra).
Tables 3.6-1 and 3.6-2 contain electrochemical potential windows for a wide variety of ionic liquids. Only limited information concerning the purity of the ionic liquids listed in Tables 3.6-1 and 3.6-2 was available, so these electrochemical potential windows must be treated with caution, as it is likely that many of the ionic liquids would have had residual halides and water present.
Ideally, one would prefer to compare anodic and cathodic potential limits instead of the overall ionic liquid electrochemical window, because difference sets of anodic and cathodic limits can give rise to the same value of electrochemical window (see Figure 3.6-1). However, the lack of a standard reference electrode system within and between ionic liquid systems precludes this possibility. Consequently, significant care must be taken when evaluating the impact of changes in the cation or anion on the overall ionic liquid electrochemical window.
As indicated by the data in Tables 3.6-1 and 3.6-2, the trend in the electrochemical stabilities of the types of ionic liquid cations is: pyridinium < pyrazolium imidazolium sulfonium ammonium. Overall, the quaternary ammonium-based ionic liquids are the potential window champs [36], the [(n-C3H7)(CH3)3N][(CF3 SO2)2N] ionic liquid exhibiting the largest electrochemical window, of 5.7 V, at GC [19]. (For comparison, one of the best non-aqueous electrolyte systems, acetonitrile/tetrabutylammonium hexafluorophosphate, exhibits a potential window of 6.3 V [12]). Because of uncertainties in the purity of the quaternary ammonium-based ionic liquids listed in Table 3.6-1, it is impossible to determine from the data listed what effect changes in the alkyl substituents have on the electrochemical stability of the cation. However, within the group of imidazolium-based ionic liquids there is a clear increase in cation stability when the 2-position on the imidazolium ring is capped by an alkyl substituent, as in [EMMIM]+. It has been proposed that the cathodic limiting reactions of imidazolium cations proceed initially by the reduction of ring protons to molecular hydrogen [37]. Since the 2-position on the imidazolium ring is the most acidic hydrogen [38], it is reasonable to conclude that substitution of an alkyl substituent at that position would result in an improvement in the reductive stability of the imidazolium cation. From the data in Tables 3.6-1 and 3.6-2, the anion stabilities towards oxidation appear to follow the order: halides (Cl–, F–, Br–) < chloroaluminates ([AlCl4]–, [Al2Cl7]–) fluorinated ions ([BF4]–, [PF6]–, [AsF6]–) triflate/triflyl ions ([CF3SO3]–, [(CF3SO2)2N]–, [(C2F5SO2)2N]–,
[(CF3SO2)3C]–).
The electrochemical windows exhibited by the chloroaluminates tend to fall into three ranges that correspond to the types of chloroaluminate ionic liquids: basic,

108Paul C. Trulove Robert A. Mantz
Table 3.6-2: The room-temperature electrochemical potential windows for binary and ternary chloroaluminate and related ionic liquids.
Ionic liquid system |
Cation(s) |
Anion(s) |
Working |
Window |
Ref. |
|
|
|
electrodee |
(V) |
|
|
|
|
|
|
|
60.0–40.0 mol % [EMIM]Cl/AlCl3 |
[EMIM]+ |
[AlCl4]-/Cl- |
W |
2.8 |
31a |
50.0–50.0 mol % [EMIM]Cl/AlCl3 |
[EMIM]+ |
[AlCl4]– |
W |
4.4 |
31a |
45.0–55.0 mol % [EMIM]Cl/AlCl3 |
[EMIM]+ |
[Al2Cl7]–/ |
W |
2.9 |
31a |
|
|
[AlCl4]– |
|
|
|
45.0–55.0 mol % [EMIM]Cl/AlCl3 |
[EMIM]+ |
[Al2Cl7]–/ |
W |
2.9 |
31a |
|
|
[AlCl4]– |
|
|
|
60.0–40.0 mol % [PMMIM]Cl/AlCl3 |
[PMMIM]+ |
[AlCl4]–/Cl– |
GC |
3.1 |
15a |
50.0–50.0 mol % [PMMIM]Cl/AlCl3 |
[PMMIM]+ |
[AlCl4]– |
GC |
4.6 |
15a |
40.0–60.0 mol % [PMMIM]Cl/AlCl3 |
[PMMIM]+ |
[Al2Cl7]–/ |
GC |
2.9 |
15a |
|
|
[AlCl4]– |
|
|
|
45.5–50.0–4.5 mol % [EMIM]Cl/AlCl3/LiCl |
[EMIM]+/Li+ |
[AlCl4]– |
W |
4.3 |
32a,c |
45.5–50.0–4.5 mol % [EMIM]Cl/AlCl3/LiCl |
[EMIM]+/Li+ |
[AlCl4]– |
W |
4.6 |
32a,c,d |
47.6–50.0–2.4 mol % [EMIM]Cl/AlCl3/NaCl |
[EMIM]+/Na+ |
[AlCl4]– |
W |
4.5 |
32a,c |
47.6–50.0–2.4 mol % [EMIM]Cl/AlCl3/NaCl |
[EMIM]+/Na+ |
[AlCl4]– |
W |
4.6 |
32a,c |
45.5–50.0–4.5 mol % [PMMIM]Cl/AlCl3/NaCl |
[PMMIM]+/Na+ |
[AlCl4]– |
W |
4.6 |
32a,c |
45.5–50.0–4.5 mol % [PMMIM]Cl/AlCl3/NaCl |
[PMMIM]+/Na+ |
[AlCl4]– |
W |
4.7 |
32a,c,d |
50.0–50.0 mol % [BP]Cl/AlCl3 |
[BP]+ |
[AlCl4]– |
W |
3.6 |
31a |
52.0–48.0 mol % [EMIM]Cl/GaCl3 |
[EMIM]+ |
[GaCl4]–/Cl–b |
W |
2.4 |
33a |
50.0–50.0 mol % [EMIM]Cl/GaCl3 |
[EMIM]+ |
[GaCl4]–b |
W |
4.0 |
33a |
49.0–51.0 mol % [EMIM]Cl/GaCl3 |
[EMIM]+ |
[Ga2Cl7[–/ |
W |
2.2 |
33a |
|
|
[GaCl4]– b |
|
|
|
52.0–48.0 mol % [BP]Cl/GaCl3 |
[BP]+ |
[GaCl4]–/Cl– b W |
2.2 |
33a |
|
50.0–50.0 mol % [BP]Cl/GaCl3 |
[BP]+ |
[GaCl4]– b |
W |
3.7 |
33a |
49.0–51.0 mol % [BP]Cl/GaCl3 |
[BP]+ |
[Ga2Cl7]–/ |
W |
2.2 |
33a |
|
|
[GaCl4]– b |
|
|
|
Basic [(CH3)2(C2H5)(C2H5OCH2)N]Cl/AlCl3 |
[(CH3)2(C2H5) |
[AlCl4]–/Cl– |
Pt |
3.5 |
34a |
|
(C2H5OCH2)N]+ |
|
|
|
|
33.0–67.0 mol % [(CH3)3S]Cl/AlCl3 |
[(CH3)3S]+ |
[Al2Cl7]–/ |
GC |
2.5 |
35a |
|
|
[AlCl4]– |
|
|
|
|
|
|
|
|
|
a Voltage window estimated from cyclic voltammograms contained in the reference.
bThe exact nature of the anions is unknown; anions listed are those that would be expected if the system behaved similarly to the chloroaluminates.
c Voltage window determined assuming anodic limit of 2.4 V vs. Al/Al(III) reference. d Small amount of [EMIM][HCl]2 added.
e Working electrode, Pt = platinum, GC = glassy carbon, W = tungsten.

3.6 Electrochemical Properties of Ionic Liquids |
109 |
|
|
neutral, and acidic. Basic ionic liquids contain an excess of the organic chloride salt (> 50 mol %), resulting in the presence of free chloride ion (a Lewis base); this, in turn, significantly restricts the anodic limit of the basic ionic liquids. Acidic ionic liquids are prepared with an excess of the aluminium chloride (organic chloride < 50 mol %), and contain two chloroaluminate species: [AlCl4]– and [Al2Cl7]– (a Lewis acid). Both anions are significantly more stable towards oxidation than chloride ion. Furthermore, the [Al2Cl7]– is more readily reduced than the organic cation. The acidic ionic liquids thus have a limited cathodic range, but an extended anodic potential range. In the special case in which the organic chloride salt and aluminium chloride are present in equal amounts (50 mol %), these ionic liquids are termed neutral, because they contain only the organic cation and [AlCl4]–. The neutral chloroaluminate ionic liquids possess the widest electrochemical windows, but they are difficult to prepare and to maintain at the exact neutral composition. A solution to this problem has been developed through the introduction of a third component, an alkali halide, to the chloroaluminate ionic liquids [39]. When an excess of alkali halide (e.g., LiCl, NaCl) is added to an acidic chloroaluminate ionic liquid it dissolves to the extent that it reacts with [Al2Cl7]– ion to produce [AlCl4]– and the alkali metal cation; this results in an ionic liquid that is essentially neutral, and at that point the alkali halide is no longer soluble. This neutral ionic liquid is “buffered” to the addition either of more [Al2Cl7]– or of organic chloride. Consequently, the buffered neutral ionic liquids possess wide, and stable, electrochemical windows. However, the cathodic limits of the imidazolium-based buffered neutral ionic liquids are not sufficient to obtain reversible alkali metal deposition and stripping. Interestingly, addition of small amounts of proton to the buffered neutral ionic liquids shifts the reduction of the imidazolium cation sufficiently negative such that reversible lithium and sodium deposition and stripping can be obtained [32, 37].
3.6.2
Ionic Conductivity
The ionic conductivity of a solvent is of critical importance in its selection for an electrochemical application. There are a variety of DC and AC methods available for the measurement of ionic conductivity. In the case of ionic liquids, however, the vast majority of data in the literature have been collected by one of two AC techniques: the impedance bridge method or the complex impedance method [40]. Both of these methods employ simple two-electrode cells to measure the impedance of the ionic liquid (Z). This impedance arises from resistive (R) and capacitive contributions (C), and can be described by Equation (3.6-1):
Z = ( 1 |
ωC |
)2 |
+ R2 |
(3.6-1) |
|
|
|
|
where ω is the frequency of the AC modulation. One can see from Equation 3.6-1 that as the AC frequency increases the capacitive contribution to the impedance becomes vanishingly small and Equation 3.6-1 reduces to Z = R, the resistance

110 Paul C. Trulove Robert A. Mantz
of the ionic liquid in the impedance cell. Under these conditions the conductivity (κ) of the ionic liquid may be obtained from the measured resistance by Equation 3.6-2:
κ = |
l |
(3.6-2) |
|
AR
where l is the distance between the two electrodes in the impedance cell and A is the area of the electrodes. The term in l/A is often referred to as the cell constant and it is normally determined by measuring the conductivity of a standard solution (usually aqueous KCl).
The impedance bridge method employs the AC version of a Wheatstone bridge (i.e., an Impedance Bridge) to measure the unknown cell impedance. Impedance measurements are carried out at a relatively high fixed frequency, normally in the range of a few kHz, in order to minimize the impact of capacitive contribution on the cell impedance. This contribution is often further reduced by increasing the electrode surface area, and correspondingly increasing its capacitance, with a fine deposit of platinum black. The complex impedance method involves the measurement of the cell impedance at frequencies ranging from a few Hz up to several MHz. The impedance data is collected with standard electrochemical impedance hardware (potentiostat/impedance analyzer) and is separated out into its real and imaginary components. These data are then plotted in the form of a Nyquist Plot (imaginary vs. real impedance), and the ionic liquid resistance is taken as the point at which the data crosses the real axis at high frequency.
In general, there appears to be no significant difference between the data collected by either method. There is some evidence that data collected by the bridge method, at lower frequencies, may provide an underestimation of the true conductivity [20, 24], but there is no indication that this error is endemic to the impedance bridge method. The instrumentation for the impedance bridge method, although somewhat specialized, is generally less costly than the instrumentation required by the complex impedance method. However, the complex impedance method has gained popularity in recent years, most probably due to the increased availability of electrochemical impedance hardware.
The conductivity of an electrolyte is a measure of the available charge carriers and their mobility. Superficially, one would expect ionic liquids to possess very high conductivities because they are composed entirely of ions. Unfortunately this is not the case. As a class, ionic liquids possess reasonably good ionic conductivities, comparable to the best non-aqueous solvent/electrolyte systems (up to ~10 mS cm–1). However, they are significantly less conductive than concentrated aqueous electrolytes. The smaller than expected conductivity of ionic liquids can be attributed to the reduction of available charge carriers due to ion pairing and/or ion aggregation, and to the reduced ion mobility resulting from the large ion size found in many ionic liquids.
The conductivity of ionic liquids often exhibits classical linear Arrhenius behavior above room temperature. However, as the temperatures of these ionic liquids approach their glass transition temperatures (Tgs), the conductivity displays signif-
3.6 Electrochemical Properties of Ionic Liquids |
111 |
|
|
icant negative deviation from linear behavior. The observed temperature-dependent conductivity behavior is consistent with glass-forming liquids, and is often best described by the empirical Vogel–Tammann–Fulcher (VTF) equation (3.6-3):
−1 |
|
κ = AT 2exp[ − B/(T − To )] |
(3.6-3) |
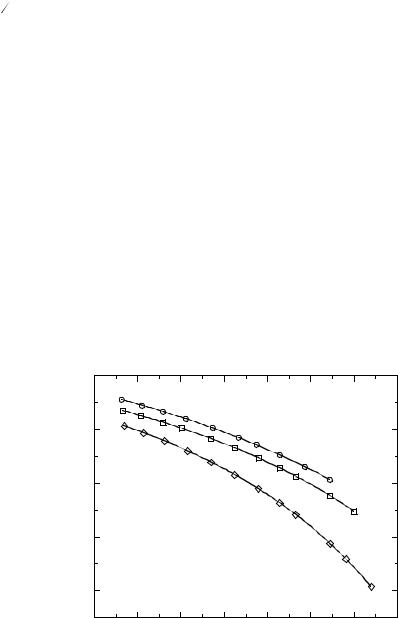
where A and B are constants, and To is the temperature at which the conductivity (κ) goes to zero [60]. Examples of Arrhenius plots of temperature-dependent conductivity data for three ionic liquids are shown in Figure 3.6-2 [15, 27, 41].
The data in Figure 3.6-2 are also fit to the VTF equation. As can be seen from these data, the change in conductivity with temperature clearly varies depending on the ionic liquid. The conductivity of [EMIM][BF4], for example, decreases by a factor of 10 over the 375 to 275 K temperature range, while the conductivity of [PMMIM][(CF3SO2)2N] decreases by a factor of 30 over the same range of temperatures (Figure 3.6-2). The temperature dependence of conductivity of an ionic liquid involves a complex interplay of shortand long-range forces that is strongly impacted by the type and character of the cation and anion. At our current level of understanding it is not possible to predict accurately how the conductivity of a given ionic liquid will vary with temperature [42].
The room temperature conductivity data for a wide variety of ionic liquids are listed in Tables 3.6-3, 3.6-4, and 3.6-5. These tables are organized by the general type of ionic liquid. Table 3.6-3 contains data for imidazolium-based non-haloaluminate alkylimidazolium ionic liquids, Table 3.6-4 data for the haloaluminate ionic liquids, and Table 3.6-5 data for other types of ionic liquids. There are multiple listings for several of the ionic liquids in Tables 3.6-3–3.6-5. These represent measurements by different researchers and have been included to help emphasize the significant vari-
In(κ/ Scm-1)
-2.0
-4.0
-6.0
Figure 3.6-2: Examples of |
-8.0 |
|
|
|
Arrhenius plots of tempera- |
|
|
|
|
|
|
|
|
|
ture-dependent conductivity |
|
|
|
|
for [EMIM][BF4] (●), |
|
|
|
|
[EMIM][(CF3SO2)2N] (■), |
-10.0 |
|
|
|
and [PMMIM][(CF3SO2)2N] |
|
|
|
|
|
|
|
|
|
( ). The solid lines through |
|
|
|
|
each set of data represents |
0.00250 |
0.00300 |
0.00350 |
0.00400 |
the best fit of the data to the |
|
|
T-1 (K-1) |
|
VTF equation. |
|
|
|

Table 3.6-3: Specific conductivity data for non-haloaluminate alkylimidazolium-based ionic liquids.
Cation |
Anion |
Tempera- |
Conduc- |
Conduc- |
Viscosity |
Viscosity |
Density |
Density |
Molar |
Walden |
Ref. |
|
|
ture (K) |
tivity |
tivity |
(υ), cP |
method |
(ρ), g cm–3 |
method |
Conductivity |
product |
|
|
|
|
(κ), mS cm–1 |
method |
|
|
|
|
(Λ), cm2Ω –1mol–1 |
(Λη) |
|
|
|
|
|
|
|
|
|
|
|
|
|
[MMIM]+ |
[(CF3SO2)2N]– |
293 |
8.4 |
B |
44 |
R |
1.559 |
U |
2.03 |
89.44 |
26 |
[EMIM]+ |
[BF4]– |
295 |
12 |
I |
|
|
|
|
|
|
43 |
[EMIM]+ |
[BF4]– |
298 |
14 |
B |
34 |
U |
1.240 |
U |
2.24 |
76.22 |
24 |
[EMIM]+ |
[BF4]– |
298 |
14 |
I |
32 |
R |
1.279 |
I |
2.17 |
68.91 |
41a |
[EMIM]+ |
[BF4]– |
299 |
13 |
B |
43 |
R |
|
|
|
|
27 |
[EMIM]+ |
[BF4]– |
303 |
20 |
I |
|
|
|
|
|
|
23 |
[EMIM]+ |
[PF6]– |
299 |
5.2 |
B |
|
|
|
|
|
|
27 |
[EMIM]+ |
[CH3CO2]– |
293 |
2.8 |
B |
162 |
R |
|
|
|
|
26 |
[EMIM]+ |
[CF3CO2]– |
293 |
9.6 |
B |
35 |
R |
1.285 |
U |
1.67 |
58.62 |
26 |
[EMIM]+ |
[C3F7CO2]– |
293 |
2.7 |
B |
105 |
R |
1.450 |
U |
0.60 |
63.39 |
26 |
[EMIM]+ |
[CH3SO3]– |
298 |
2.7 |
B |
160 |
C |
1.240 |
V |
0.45 |
71.86 |
25 |
[EMIM]+ |
[CF3SO3]– |
293 |
8.6 |
B |
45 |
R |
1.390 |
U |
1.61 |
72.45 |
26 |
[EMIM]+ |
[CF3SO3]– |
298 |
9.2 |
B |
43 |
C |
1.380 |
V |
1.73 |
74.08 |
25 |
[EMIM]+ |
[CF3SO3]– |
303 |
8.2 |
B |
|
|
|
|
|
|
44b |
[EMIM]+ |
[(CF3SO2)2N]– |
293 |
8.8 |
B |
34 |
R |
1.520 |
U |
2.27 |
77.03 |
26 |
[EMIM]+ |
[(CF3SO2)2N]– |
298 |
5.7 |
I |
31 |
R |
1.518 |
I |
1.47 |
44.82 |
41a |
[EMIM]+ |
[(CF3SO2)2N]– |
303 |
10 |
I |
|
|
|
|
|
|
44a |
[EMIM]+ |
[(CF3SO2)2N]– |
298 |
9.2 |
B |
34 |
U |
1.510 |
U |
2.38 |
81.06 |
19 |
[EMIM]+ |
[(CF3SO2)2N]– |
299 |
8.4 |
B |
28 |
R |
|
|
|
|
27 |
[EMIM]+ |
[(C2F5SO2)2N]– |
299 |
3.4 |
B |
61 |
R |
|
|
|
|
27 |
[EMMIM]+ |
[(CF3SO2)2N]– |
293 |
3.2 |
B |
88 |
R |
1.495 |
U |
0.87 |
76.35 |
26 |
[EMM(5)IM]+ |
[CF3SO3]– |
293 |
6.4 |
B |
51 |
R |
1.334 |
U |
1.32 |
67.11 |
26 |
[EMM(5)IM]+ |
[(CF3SO2)2N]– |
293 |
6.6 |
B |
37 |
R |
1.470 |
U |
1.82 |
67.34 |
26 |
[PMIM]+ |
[PF6]– |
293 |
|
|
|
|
1.333 |
V |
|
|
45 |
[PMMIM]+ |
[BF4]– |
295 |
5.9 |
I |
|
|
|
|
|
|
43 |
[PMMIM]+ |
[PF6]– |
308 |
0.5 |
B |
|
|
|
|
|
|
27 |
[PMMIM]+ |
[(CF3SO2)2N]– |
299 |
3.0 |
B |
60 |
R |
|
|
|
|
27 |
Mantz .A Robert Trulove .C Paul 112

[BMIM]+ |
[PF6]– |
295 |
1.8 |
I |
|
|
|
|
|
|
47 |
[BMIM]+ |
[PF6]– |
293 |
|
|
|
|
1.363 |
V |
|
|
45 |
[BMIM]+ |
[PF6]– |
298 |
|
|
207 |
R |
|
|
|
|
46 |
[BMIM]+ |
[CF3CO2]– |
293 |
3.2 |
B |
73 |
R |
1.209 |
U |
0.67 |
48.74 |
26 |
[BMIM]+ |
[C3F7CO2]– |
293 |
1.0 |
B |
182 |
R |
1.333 |
U |
0.26 |
48.09 |
26 |
[BMIM]+ |
[CF3SO3]– |
293 |
3.7 |
B |
90 |
R |
1.290 |
U |
0.83 |
74.42 |
26 |
[BMIM]+ |
[C4F9SO3]– |
293 |
0.45 |
B |
373 |
R |
1.427 |
U |
0.14 |
51.56 |
26 |
[BMIM]+ |
[(CF3SO2)2N]– |
293 |
3.9 |
B |
52 |
R |
1.429 |
U |
1.14 |
59.52 |
26 |
[iBMIM]+ |
[(CF3SO2)2N]– |
293 |
2.6 |
B |
83 |
R |
1.428 |
U |
0.76 |
63.37 |
26 |
[BMMIM]+ |
[BF4]– |
295 |
0.23 |
I |
|
|
|
|
|
|
43 |
[BMMIM]+ |
[PF6]– |
295 |
0.77 |
I |
|
|
|
|
|
|
43 |
[HMIM]+ |
[PF6]– |
293 |
|
|
|
|
1.307 |
V |
|
|
45 |
[OMIM]+ |
[PF6]– |
293 |
|
|
|
|
1.237 |
V |
|
|
45 |
[EEIM]+ |
[CF3CO2]– |
293 |
7.4 |
B |
43 |
R |
1.250 |
U |
1.41 |
60.64 |
26 |
[EEIM]+ |
[CF3SO3]– |
293 |
7.5 |
B |
53 |
R |
1.330 |
U |
1.55 |
81.97 |
26 |
[EEIM]+ |
[(CF3SO2)2N]– |
293 |
8.5 |
B |
35 |
R |
1.452 |
U |
2.37 |
83.05 |
26 |
[EEM(5)IM]+ |
[(CF3SO2)2N]– |
293 |
6.2 |
B |
36 |
R |
1.432 |
U |
1.82 |
65.36 |
26 |
[BEIM]+ |
[CF3CO2]– |
293 |
2.5 |
B |
89 |
R |
1.183 |
U |
0.56 |
50.08 |
26 |
[BEIM]+ |
[CH3SO3]– |
298 |
0.55 |
B |
|
|
1.140 |
V |
0.12 |
|
25 |
[BEIM]+ |
[CF3SO3]– |
298 |
2.7 |
B |
|
|
1.270 |
V |
0.64 |
|
25 |
[BEIM]+ |
[C4F9SO3]– |
293 |
0.53 |
B |
323 |
R |
1.427 |
U |
0.17 |
54.26 |
26 |
[BEIM]+ |
[(CF3SO2)2N]– |
293 |
4.1 |
B |
48 |
R |
1.404 |
U |
1.27 |
60.75 |
26 |
[DEIM]+ |
[CF3SO3]– |
298 |
|
|
|
|
1.10 |
V |
|
|
25 |
[MeOEtMIM]+ |
[CF3SO3]– |
293 |
3.6 |
B |
74 |
R |
1.364 |
U |
0.77 |
56.69 |
26 |
[MeOEtMIM]+ |
[(CF3SO2)2N]– |
293 |
4.2 |
B |
54 |
R |
1.496 |
U |
1.18 |
63.88 |
26 |
[CF3CH2MIM]+ |
[(CF3SO2)2N]– |
293 |
0.98 |
B |
248 |
R |
1.656 |
U |
0.25 |
62.56 |
26 |
|
|
|
|
|
|
|
|
|
|
|
|
I = complex impedance, B = conductivity bridge, C = capillary viscometer, P = pycnometer or dilatometer, V = volumetric glassware, I = instrument, U = method unknown (not provided in the reference) a Conductivity at 298 K calculated from VTF parameters given in reference. b Conductivity estimated from graphical data provided in the reference. c Density estimated from graphical data provided in the reference.
113 Liquids Ionic of Properties Electrochemical 6.3

114 Paul C. Trulove Robert A. Mantz
ability in the conductivity data found in the literature. For example, there are five separate listings for the [EMIM][(CF3SO2)2N] ionic liquid in Table 3.6-3, with conductivity values ranging from 5.7 to 10.0 mS cm–1. Some of these differences may be accountable for by slight differences in experimental temperature, or they could result from measurement error. However, most of this variability is undoubtedly due to impurities in the ionic liquids. Recent work has shown, for example, that contamination with chloride ion increases ionic liquid viscosity, while contamination with water decreases the viscosity [13]. This work has also shown the significant solubility of water in many so-called “hydrophobic” ionic liquids and the strong propensity of these same ionic liquids to absorb water from laboratory air. As can be seen in the discussion below, ionic liquid viscosity is strongly coupled to ionic conductivity. The likelihood that many of the ionic liquids listed in Tables 3.6-3– 3.6-5 contained significant concentrations of impurities (especially water) makes evaluation of the literature data difficult. Consequently, any conclusions drawn below must be used with caution. Ionic liquid conductivity appears to be only weakly correlated with the size and type of the cation (Tables 3.6-3–3.6-5). Increasing cation size tends to give rise to lower conductivity, most probably due to the lower mobility of the larger cations.
The overall trend in conductivity with respect to cation type follows the order: imidazolium sulfonium ammonium pyridinium. Interestingly, the correlation between the anion type or size and the ionic liquid conductivity is very limited. Other than the higher conductivities observed for ionic liquids with the [BF4]– anion, there appears to be no clear relationship between anion size and conductivity. Ionic liquids with large anions such as [(CF3SO2)2N]–, for example, often exhibit higher conductivities than those with smaller anions, such as [CH3CO2]–.
The conductivity and viscosity of an ionic liquid is often combined into what is termed Walden’s rule [Equation (3.6-4)] [54],
Λη = constant |
(3.6-4) |
where Λ is the molar conductivity of the ionic liquid, and it is given by Equation (3.6-5)
Λ = κM/ρ |
(3.6-5) |
where M is the equivalent weight (molecular weight) of the ionic liquid and ρ is the ionic liquid density. Ideally, the Walden Product (Λη) remains constant for a given ionic liquid regardless of temperature. The magnitude of the Walden Product for different ionic liquids has been shown to vary inversely with ion size [27, 54]. This inverse relationship between ion size and the magnitude of Λη is generally followed for the cations in Tables 3.6-3–3.6-5. The clearest example of this can be seen for the sulfonium ionic liquids, in which increasing cation size from [(CH3)3S]+, [(C2H5)3S]+, and [(n-C4H9)3S]+ results in Walden products of 81.59, 58.27, and 39.36, respectively. As was the case with conductivity, the size of the anions in Tables 3.6-3–3.6-5 exhibits no clear correlation to the magnitude of the Walden product.

Table 3.6-4: Specific conductivity data for binary haloaluminate ionic liquids.
Ionic liquid system |
Cation |
Anion(s) |
Tempera- |
Conduc- |
Conduc- |
Viscosity |
Viscosity |
Density |
Density |
Molar |
Walden |
Ref. |
|
|
|
ture (K) |
tivity (κ), |
tivity |
(η), cP |
method |
(ρ), g cm–3 |
method |
Conductivity |
product |
|
|
|
|
|
mS cm–1 |
method |
|
|
|
|
(Λ), cm2 |
(Λη) |
|
|
|
|
|
|
|
|
|
|
|
Ω –1mol–1 |
|
|
34.0–66.0 mol % [MMIM]Cl/AlCl3 |
[MMIM]+ |
[Al2Cl7]– |
298 |
15.0 |
B |
17 |
C |
1.404 |
P |
4.26 |
72.07 |
48a |
34.0–66.0 mol % [EMIM]Cl/AlCl3 |
[EMIM]+ |
[Al2Cl7]– |
298 |
15.0 |
B |
14 |
C |
1.389 |
P |
4.46 |
62.95 |
48a |
50.0–50.0 mol % [EMIM]Cl/AlCl3 |
[EMIM]+ |
[AlCl4]– |
298 |
23.0 |
B |
18 |
C |
1.294 |
P |
4.98 |
89.07 |
48a |
60.0–40.0 mol % [EMIM]Cl/AlCl3 |
[EMIM]+ |
Cl–, [AlCl4]– |
298 |
6.5 |
B |
47 |
C |
1.256 |
P |
1.22 |
57.77 |
48a |
34.0–66.0 mol % [EMIM]Br/AlBr3 |
[EMIM]+ |
[Al2Br7]– |
298 |
5.8 |
B |
32 |
C |
2.219 |
P |
1.89 |
59.64 |
49a,b |
60.0–40.0 mol % [EMIM]Br/AlBr3 |
[EMIM]+ |
Br–, [AlBr4]– |
298 |
5.7 |
B |
67 |
C |
1.828 |
P |
1.15 |
76.72 |
49a,b |
40.0–60.0 mol % [PMIM]Cl/AlCl3 |
[PMIM]+ |
[AlCl4]–, [Al2Cl7]– 298 |
11.0 |
B |
18 |
C |
1.351 |
P |
2.94 |
53.44 |
48a |
|
50.0–50.0 mol % [PMIM]Cl/AlCl3 |
[PMIM]+ |
[AlCl4]– |
298 |
12.0 |
B |
27 |
C |
1.262 |
P |
2.79 |
76.29 |
48a |
60.0–40.0 mol % [PMIM]Cl/AlCl3 |
[PMIM]+ |
Cl–, [AlCl4]– |
298 |
3.3 |
B |
|
C |
|
P |
|
|
48a |
34.0–66.0 mol % [BMIM]Cl/AlCl3 |
[BMIM]+ |
[Al2Cl7]– |
298 |
9.2 |
B |
19 |
C |
1.334 |
P |
3.04 |
58.45 |
48a |
50.0–50.0 mol % [BMIM]Cl/AlCl3 |
[BMIM]+ |
[AlCl4]– |
298 |
10.0 |
B |
27 |
C |
1.238 |
P |
2.49 |
67.42 |
48a |
34.0–66.0 mol % [BBIM]Cl/AlCl3 |
[BBIM]+ |
[Al2Cl7]– |
298 |
6.0 |
B |
24 |
C |
1.252 |
P |
2.32 |
55.36 |
48a |
50.0–50.0 mol % [BBIM]Cl/AlCl3 |
[BBIM]+ |
[AlCl4]– |
298 |
5.0 |
B |
38 |
C |
1.164 |
P |
1.50 |
56.83 |
48a |
33.3–66.7 mol % [MP]Cl/AlCl3 |
[MP]+ |
[Al2Cl7]– |
298 |
8.1 |
B |
21 |
C |
1.441 |
P |
2.23 |
46.12 |
50a |
33.3–66.7 mol % [EP]Cl/AlCl3 |
[EP]+ |
[Al2Cl7]– |
298 |
10.0 |
B |
18 |
C |
1.408 |
P |
2.91 |
51.29 |
50a |
33.3–66.7 mol % [EP]Br/AlCl3 |
[EP]+ |
[Al2ClxBr7–x]– |
298 |
8.4 |
B |
22 |
C |
1.524 |
P |
|
|
50a |
33.3–66.7 mol % [EP]Br/AlCl3 |
[EP]+ |
[Al2ClxBr7–x]– |
298 |
17.0 |
B |
25 |
|
|
|
|
|
51 |
33.3–66.7 mol % [EP]Br/AlBr3 |
[EP]+ |
[Al2Br7]– |
298 |
|
|
50 |
C |
2.20 |
V |
|
|
52 |
33.3–66.7 mol % [PP]Cl/AlCl3 |
[PP]+ |
[Al2Cl7]– |
298 |
8.0 |
B |
18 |
C |
1.375 |
P |
2.47 |
44.93 |
50b |
33.3–66.7 mol % [BP]Cl/AlCl3 |
[BP]+ |
[Al2Cl7]– |
298 |
6.7 |
B |
21 |
C |
1.346 |
P |
2.18 |
45.81 |
50b |
|
|
|
|
|
|
|
|
|
|
|
|
|
I = complex impedance, B = conductivity bridge, C = capillary viscometer, P = pycnometer or dilatometer, V = volumetric glassware, I = instrument, U = method unknown (not provided in the reference).
a Conductivity at 298K calculated from least-squares-fitted parameters given in reference. b Conductivity estimated from graphical data provided in the reference.
Liquids Ionic of Properties Electrochemical 6.3
115