


154 |
WEAKLY IONIZED PLASMAS |
Table 4.11 “Surface energy” of atom α, heat of vaporization q, and ratio α/q at the triple point (Pogosov and Khrapak 1988)
Parameter |
Li |
Na |
K |
Pb |
Cs |
Fe |
Cu |
|
α, eV |
0.98 |
0.68 |
0.60 |
0.54 |
0.52 |
2.9 |
2.2 |
|
q, eV |
1.6 |
1.1 |
0.93 |
0.85 |
0.82 |
3.5 |
4.4 |
|
α/q |
0.60 |
0.63 |
0.64 |
0.65 |
0.63 |
0.69 |
0.64 |
|
ng0 = An10 exp{−[−gkT ln(p/ps) + αg2/3]/kT }. |
(4.48) |
|||||||
The pre–exponential factor A, which is usually assumed to be equal to unity, will be determined below, with the aid of the experimental data for the equation of state of saturated vapor.
The condition of plasma neutrality and expression (4.45) for the concentration of charged droplets yield the equations for determining the electron number density,
∞
ne = |
ZngZ = |
Z(nes/ne)Z F (Z2) |
|
g,Z |
|
Z=−∞ |
|
∞ |
|
|
|
|
Z[(nes/ne)Z − (ne/nes)Z ]F (Z2). |
|
|
= |
(4.49) |
||
Z=0
Because F (Z2) > 0, it follows from (4.49) that the number density ne is always less than the Richardson concentration. The latter corresponds to the equilibrium electron concentration near a plane emitting surface,
nes = 2(h2/2πmkT )−3/2 exp(−W/kT ). |
(4.50) |
4.4.3Calculation of the plasma composition
Equation of state for matter and conservation of mass are p = kT nZg and
g,Z
ρ = M gnZg , respectively. Using the known dependencies of pressure and
g,Z
density on the saturation curve (Vargaftic et al. 1985), now we can determine densities n01 and ne and constant A. For su ciently small complexes, one must include the dependence of the surface tension on the droplet radius,
γ(R) = γ0/(1 + δ/R),
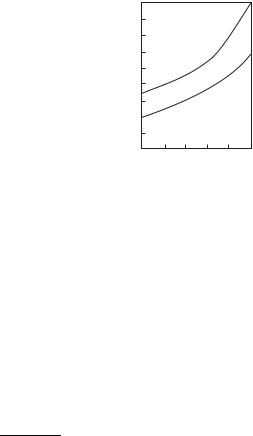
where γ0 is the surface tension of a flat surface. The correction for the curvature δ for alkali metals was calculated in Iakubov et al. (1986). Both quantities, γ0 and δ, depend on temperature. Figure 4.11 gives the calculation results for the quantity g (T ) in saturated cesium vapor (g is the value of g, at which n+g attains maximum).
Figure 4.12 gives the results of the calculation for the electron number density in plasma of Na, K, Rb, and Cs vapors.
DROPLET MODEL OF NONIDEAL PLASMA OF METAL VAPORS |
155 |
g*
1
10
2
0
13 |
16 |
T, 103 K |
Fig. 4.11. The temperature dependence of g |
in saturated cesium vapor (Pogosov and |
|
Khrapak 1988): 1 — δ is taken into account, 2 — for δ = 0.
The validity of the droplet model is mainly determined by the values of g (T ) and by the half–width of the distribution n+g (T ). Figure 4.13 shows the normalized distribution of charged complexes for cesium versus the number of atoms, g, for T = 1400 K and T = 1800 K. As the temperature rises, the distribution of droplets over the number of particles becomes broader and the positions of the maxima shift towards larger values of g.
The magnitude of A turned out to be temperature dependent. For cesium, A = 5.3 · 102 at T = 1400 K, and A = 3.3 · 103 at T = 1800 K. Taking into account the very sharp variation of ne(T ), such a dependence, as well as the magnitude of A itself, appears acceptable.
Figure 4.14 gives the results of the calculation and measurements for the specific electrical conductivity of saturated cesium vapors. The electrical con-
ductivity was calculated with the Lorentz formula σ = e2ne/(¯qmvn¯ 01), where
v¯ = 8kT /(πm) and q¯ is the cross section of electron–atom scattering. In highly polarizable media, the density e ects may cause a strong increase in mobility. This is due to the fact that for high densities, the long–range (polarization) components of electron–atom potentials overlap. The resulting potential field is smoothed out and the electron is scattered by the short–range components of potentials (see Chapter 6). Therefore, the cross–section q¯ used by Pogosov and Khrapak (1988) is an order of magnitude smaller than the tabular value.
For the remaining alkali metals, the qualitative picture is similar. Pogosov and Khrapak (1988) do not describe the transition from anomalous to normal electrical conductivity. Based on the results of measurements by Borzhievsky et al. (1988), this transition might occur at T 1200 K. By Zhukhovitskii (1989), yet another version of the droplet model was suggested, with the attempt of a unified description of the vapor equation of state and electrical conductivity, including its transition from the anomalous to normal.