


BASIC RADIATION PROCESSES IN RAREFIED ATOMIC PLASMA |
299 |
where Bν (T ) is Planck’s function. The quantity Iν dν defines the energy emitted by volume dv per unit time in unit solid angle in the frequency interval dν.
These quantities are used to express the divergence of radiant energy flux qR, which characterizes the energy losses (or release) due to radiation. In two limiting cases, that is, with high and low optical density, qR is written in a simple manner. If the plasma dimension l exceeds the radiation path length kν−1, kν l 1 in the entire frequency interval covering the spectral region in which the bulk of radiant energy is transferred, the radiative energy transfer may be described in the approximation of radiant thermal conductivity,
qR = −163 σSBlR(r)T 3 (r) T (r) ,
3
lR (r) = kν−1 (r) Bν (r) dν Bν (r) dν, (8.3)
where σSB is the Stefan–Boltzmann constant; and lR is the Rosseland length, which is the mean photon path length.
Conversely, in the limiting case of an optically thin medium, the divergence of energy flux is easily written:
qR(r) = 4πσSBkPl(r)T 4(r),
3
kPl (r) = kν (r) Bν (r) dν Bν (r) dν. (8.4)
where the quantity kPl is referred to as the mean Planck absorptivity. Although both these limiting cases are seldom realized in their pure form, the
representation of the results of calculations of radiative properties in the form of the density and temperature dependences of mass absorption cross–sections yields important information. Figure 8.1 gives the Rosseland and Planck mass absorption cross–sections as functions of the atomic nuclear charge.
8.2Basic radiation processes in rarefied atomic plasma
The radiation processes in an ideal plasma have been studied fairly well (cf. Biberman and Norman 1967; Avilova et al. 1970; Raizer 1987; D’yachkov 2000). We will only present here the basic information along with some reference formulas.
Depending on the type of corresponding optical spectra, the electron radiation processes are divided into two groups:
(1) Bound–bound transitions in atoms. They provide a series of spectral lines that converge at the photoionization thresholds. Near the threshold, the convergence of lines occurs. As a result, the position of the threshold shifts to the long-wave side (Section 8.3).
(2)Bound–free and free–free transitions. The photoionization and bremsstrahlung processes defining the continuous spectrum manifest little dependence on

300 |
THE OPTICAL PROPERTIES OF DENSE PLASMA |
cm g
Fig. 8.1. The (1) Planck and (2) Rosseland mass absorption cross–sections as functions of the atomic nuclear charge (Klein and Meiners 1977); T = 100 eV, ρ = 0.1 g cm−3.
frequency and experience sharp discontinuities at frequencies which are equal to the threshold frequencies. Such a division is not absolute. For example, strongly broadened spectral lines overlap and are superimposed on the continuous spectrum. These e ects are especially strong in a strongly nonideal plasma, that is, a high–pressure plasma.
The integrated intensity of the spectral line depends on the oscillator strength
fnn :
kν dν = (πe2/mc)fnn nn,
where kν is the coe cient of absorption in a spectral line due to the n → n transition, and nn is the concentration of absorbing atoms. Accordingly, the integrated intensity of the spectral line is
I = |
Iν dν = mλ3 |
|
gn nn fnn , |
|
|
|
2πhe2 |
|
gn |
where nn is the concentration of radiating atoms, and gn and gn are the statistical weights of the low–lying and high–lying states, respectively.
The absorption line oscillator strength depends on the Einstein probability of spontaneous transition,
gn mc3
fnn = gn 8π2e2ν2 An n.

BASIC RADIATION PROCESSES IN RAREFIED ATOMIC PLASMA |
301 |
The factor An n is equal to the inverse lifetime of an atom in the state n relative to the n → n transition. The absorbing and radiating states are actually characterized by several quantum numbers such that the subscript n characterizes their entire required set. The fullest tables for fnn and Ann are provided by Wiese et al. (1966). The quasiclassical Kramers formula for hydrogen–like atom appears useful. The transition is considered between states with the main quantum numbers k and m averaged over the remaining quantum numbers. For such a transition,
f |
|
= |
32 |
|
1 |
|
(n )−2 |
|
n−2 |
|
−3 |
= |
1,96 |
|
En − En |
−3 |
, |
||
|
|
|
|
|
+ |
|
, |
|
|
|
|
||||||||
n n |
3π√3 (n )5n3 |
− |
(n )5n3 |
Z2Ry |
|||||||||||||||
|
|
|
|
|
|
|
|||||||||||||
where Ek and Em are the binding energies of the m–th and kth levels. The error of fkm, when calculated using this formula for a hydrogen atom, does not exceed 30% for all values of k and m.
The line spectral intensity fully depends on the frequency dependence of the absorption coe cient. This is because the Planck function varies slightly within the line. The ν independence of k is defined by the behavior of the line broadening. In a rarefied plasma, it is defined by radiation damping and the Doppler e ect. The broadening in a nonideal plasma, which is due mainly to interparticle interactions, will be discussed below. Continuous absorption and emission spectra are formed as a result of electron transitions from the bound to free state and vice versa (bound–free and free–bound transitions), and as a result of free–free transitions. Bound electrons are found in the atom while free electron may be in transit through the field of the atom or ion. Accordingly, for the emission of radiation, distinction is made between free–bound transitions in the field of a ion (recombination radiation),
A+ + e → A + hν,
and two types of free–free transitions: bremsstrahlung in the field of the ion,
A+ + e(mv12/2) → A+ + e(mv22/2) + hν, hν = mv12/2 − mv22/2,
and in the field of the atom,
A + e(mv12/2) → A + e(mv22/2) + hν.
In the case of absorption, a distinction is made between bound–free transitions in the field of ions (phototonization of atoms),
A + hν → A+ + e,
and free–free transitions in the field of the atom and ion. If an atom has a bound state with an electron, one should add the photodetachment of the electron (in the case of absoption) to the list of processes outlined above:


BASIC RADIATION PROCESSES IN RAREFIED ATOMIC PLASMA |
303 |
Photoionization is a threshold process: for the nth state, qν = 0 if ν < νn, and qn = qn(ν) if ν ≥ νn, where νn is the threshold frequency defined by the bonding energy of the nth state (cf. Fig. 8.2). The cross–section of absorption by a hydrogen–like atom in the n–th state is given by Kramers’ formula:
qn (ν) = |
64π4 me10Z4 |
1 |
|
(8.7) |
||||||
|
√ |
|
|
|
|
|
|
. |
||
|
|
|
|
ch6n5 |
ν3 |
|||||
|
3 |
|
||||||||
3 |
|
|
|
|
|
|
|
|
||
The sum (8.6) can be calculated because the atomic level populations are known in the equilibrium plasma. The total absorption coe cient depends nonmonotonically on the frequency. This is because given an increase of frequency, new levels begin to contribute to the sum (8.6) starting from their threshold frequencies. At low frequencies, however, the jumps of kν are small and the summation may be replaced with an integration. This leads to the Kramers–Uns¨old formula. In doing so, it is convenient to add up the expression for kν , which is due to photoionization and the expression (8.5). In this manner, we obtain the summary coe cient of absorption which allows for both bound–free and free–free transitions:
|
|
|
√ |
|
6 |
Z |
2 |
g |
1 |
|
|
||
|
|
|
|
||||||||||
kν = |
2 |
2e |
|
ehν/kT |
1 − e−hν/kT , ν ≤ νg . (8.8) |
||||||||
3√ |
|
|
neni |
|
|||||||||
ν3 |
|||||||||||||
3πc m3/2(kT )1/2 |
|||||||||||||
The value of the boundary frequency depends on the bonding energy of the lower excited state of the atom. The photoionization of the latter is included in Eq. (8.8).
In order to describe the plasma of complex atoms and ions, Biberman and Norman (1967) developed an approximate calculation technique. It enables one to derive unified and fairly simple formulas for the calculation of absorption and radiation coe cients in both free–free and bound–free transitions. The function ξ(ν, T ), which is weakly dependent on temperature, is introduced and calculated. It takes into account that complex atoms are not hydrogen–like. The final expressions have the form
|
|
|
√ |
|
6 |
Z |
2 |
g |
|
|
|
1 |
|
|
|
|
|||
|
|
|
|
|
|
|
|
|
|||||||||||
kν = |
2 |
2e |
|
|
|
|
ehν/kT ξ(ν)exp[(h∆ν − ∆I)kT ], |
|
|||||||||||
3√ |
|
|
neni |
|
|
ν ≤ νg , |
|||||||||||||
ν3 |
|||||||||||||||||||
3πc m3/2(kT )1/2 |
|||||||||||||||||||
|
|
|
|
|
|
|
|
|
ξ(ν) |
|
|
|
|
|
|
|
(8.9) |
||
|
|
kν = kν (νg ) |
|
ν |
3 |
+ n<ng qn(ν)nn(T ), ν ≥ νg . |
(8.10) |
||||||||||||
|
|
ξ(νg ) |
νg |
|
|||||||||||||||
|
|
|
|
|
|
|
|
|
|
|
|
|
|
|
|
|
|
|
|
The factor exp[(h∆ν −∆I)/kT ] is due to two e ects: the merging of spectral lines near the continuous spectrum boundary and the decrease of the atomic ionization potential ∆I. The latter has been discussed in detail in Chapters 4 and 5 above. The value of the shift in the continuous spectrum boundary, ∆ν, is discussed in Section 8.3. The sum in (8.10) is calculated in view of all the states that are not included in the integral formula, hνn > hνg . This expression

304 |
THE OPTICAL PROPERTIES OF DENSE PLASMA |
defines the frequency νg , which is referred to as the boundary. The method of calculation of the function ξ and the absorption coe cient are discussed in detail by D’yachkov (1996) and D’yachkov, Kurilenkov, and Vitel (1998).
Using the equation of ionization equilibria, the absorption coe cient kν can be related to the atomic concentration na rather than to neni. Instead of Eq. (8.9), we have
|
32π2e6k Σ+ Z2 |
|
hν + h∆ν |
ξ(ν, T ), ν ≤ νg . |
||||||||
kν = |
3√ |
|
ch4 |
na |
|
|
|
T exp(−I/kT ) exp |
|
|||
Σ |
ν3 |
kT |
||||||||||
3 |
||||||||||||
|
|
|
|
|
|
|
|
|
|
|
(8.11) |
|
where Σ+ and Σ are the statistical sums of ion and atom.
At low degrees of ionization, the continuous spectrum can be defined by free– free transitions of electrons in the field of atoms. The probability of free–free radiative transitions in a certain approximation is related to the cross–section of elastic electron–atom scattering. Zel’dovich and Raizer (1966) have shown that the di erential e ective radiative cross–section in the dν frequency range, upon the collision of an electron having a velocity v with an atom, takes the form
dqν = (8e2v2/3c3hν)qdν, |
(8.12) |
where q is the transport cross–section of electron–atom scattering.
If q does not depend on the energy of the electron, the absorption coe cient
may be estimated by the formula |
|
|
|
kν = e2(πmcν2)−1nena |
0q(mv2/2)v1 |
, |
(8.13) |
where ... implies an averaging over the Maxwellian distribution. Bremsstrahlung on atoms predominates over bremsstrahlung on ions if the following condition is satisfied:
1.5 |
1013T |
− |
5/4 |
exp − |
I |
1, |
|
||
|
· |
|
|
|
|
(8.14) |
|||
|
q√ |
|
|
|
|
2T |
|||
|
na |
|
|
||||||
where T is in eV, the cross–section is in 10−16 cm2, and the number density of atoms is in cm−3. Therefore, the intensity of bremsstrahlung on an atom prevails in a weakly ionized plasma.
In the plasma of a number of chemical elements, an important part is played by photoattachment processes and by photodetachment from negative ions in the formation of continuous optical and ultraviolet spectra. We now compare the coe cients of absorption, which are due to photodetachment, kν−, with the electron transitions in the fields of ions. We shall write the first coe cient as kν− = n−q(ν), where n− is the negative ion concentration and q(ν) is the photodetachment cross–section. The second coe cient kν+ is given by Eq. (8.11). Thus (D’yachkov and Kobzev 1981),
|
|
THE EFFECT OF WEAK NONIDEALITY |
|
|
305 |
|||||
kν− kν+ = |
3√3ch4 |
128π3√2πe6m3/2 −1 |
ne(kT )−5/2(hν)3× |
|
||||||
4 |
|
|
|
|
|
|
|
|
|
|
× |
q(ν)ξ−1 |
g− Σ+ |
exp [I + E |
− |
h(ν + ∆ν)]/kT |
} |
, |
(8.15) |
||
|
|
|
|
{ |
|
|
|
|||
where g− is the statistical |
weight of the negative ion and E the bonding energy of |
|||||||||
4 |
! |
|
|
|
|
|
||||
the electron in the latter. The relation (8.15) is at its maximum near ν 3kT /h. Upon substituting the characteristic values in Eq. (8.15), we derive
+ |
= 10− |
26 |
ne |
√ |
|
|
|
||||||
kν−/kν |
|
T exp[(I + E)/kT ]. |
||||
Hence it follows that in the plasma of elements with the ionization potential I ≥ Ry, the continuum due to negative ions contributes greatly to the continuous spectrum.
8.3The e ect of weak nonideality: Spectral line broadening and shift; Phototonization threshold shift
The influence of weak interparticle interaction on the radiative properties of the plasma reduces the latter to the well–known e ects of spectral line broadening and shift. The photoionization threshold also shifts to lower energies. In view of the ample literature available on these subjects (Baranger 1962; Griem 1964, 1974; Lisitsa 1977, 2000; D’yachkov 1996, 2000), we shall only discuss them briefly.
In a dense plasma, both broadening and shift are caused by the interaction between a radiating atom or ion and surrounding particles. In doing so, the interaction between radiator and plasma electrons and ions is of great importance.
The interaction with neutral atoms which are of the same type as the radiating system may lead to resonance broadening if one of the states in the line has an optically allowed transition to the ground state. The interaction with atoms of another type leads to van der Waals broadening. Both types of broadening in a plasma with developed ionization (at degrees of ionization of ≥ 0.01) are less important than the Stark broadening.
For the actual calculation of pressure broadening, use is made of impact (collision) and quasistatic approximations. The quasistatic approximation is applicable when the perturbing particles are moving relatively slowly. Hence the perturbation over the period of time which is of interest to us is practically constant. In the other limiting case, the radiating system does not experience any perturbations most of the time except for short impacts which are well separated in time. This approximation is well applicable for describing the perturbation of an atom by electrons. It is valid when the time lapse between the collisions is much longer than that of collision proper, that is,
n−a 1/3v−1 (neqv)−1,
where v is the electron velocity and q is the cross–section of electron–atom scattering. For long–range Coulomb interaction, which is responsible for line broadening in the plasma, the collisions are not separated in time. This is especially
306 |
THE OPTICAL PROPERTIES OF DENSE PLASMA |
true for the conditions of nonideality. Therefore, the impact approximation is only valid when the interaction is weak on the whole.
The problem of calculating line broadening through the interaction with ions and electrons in a weakly nonideal plasma reduces to the following (Baranger 1962). The electric field generated by ions is assumed to be constant and the Stark broadening is determined for an atom in this field. The broadening of each Stark component is then calculated within the impact approximation. After that, the resultant distribution of intensity is averaged over all the possible values of intensity of the ion microfield.
Collisional broadening by electrons produces the dispersion line contour
kν = k0[1 + ((ν − ν0) − ∆)2/(γ/2)2]−1.
Here, γ is the line width, and ∆ is its shift. The absorption coe cient at the line center is k0 = (8π)−1λ2(g2/g1)A21n1(2/πγ), where λ is the radiation wavelength and n1 is the number density of absorbing atoms.
The shift and width are expressed in terms of the amplitude of elastic forward scattering, f (0):
∆ = − |
h |
|
|
h |
|
1 |
|
||
|
neRe [f (0)]av |
, |
γ = |
|
neIm [f (0)]av |
= |
|
ne (vqtot)av . |
|
m |
m |
2 |
|||||||
The latter expression includes the averaged scattering frequency; qtot is the total scattering cross–section. Averaging is performed over the electron energies and impact parameters. The maximum impact parameter is limited by the screening distance. This is important from the standpoint of the shift, but has little e ect on the width as long as the transition frequency is much higher than the frequency of the plasma.
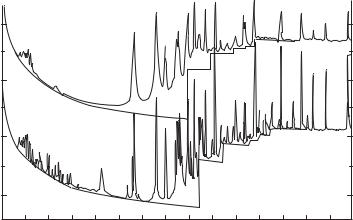
The spectral lines play an important part in the spectral and integral characteristics of dense plasma. Figure 8.3 illustrates the spectral absorptivity of air plasma (Kobzev 1984). The broken line indicates the contribution made by continua. As the density increases, the lines broaden considerably and merge to form quasi–continua, thus making a sizable contribution to the characteristics of the integral.
The methods of calculation of the absorption coe cient in lines involve the use of the Holtsmark distribution of ion microfields and the impact approximation for electrons. That is, the e ects of strong correlation are ignored while other simplifying elements are employed which correspond to the conditions of weak nonideality. No systematic studies have yet been performed on the e ect of strong nonideality on the spectral lines. Therefore, for estimations of boundaries of the domain of applicability of modern methods of calculation it is necessary to take into account results of experiments (Griem 2000).
Figure 8.4. gives the dependence of the shift in the spectral line of xenon λ = 467.1 nm on the electron number density. G¨unter, Hess, and Radtke (1985) have carried out measurements in a plasma of pulsed electric discharge and in an adiabatically compressed plasma up to ne = 3 · 1018 cm−3. It is only for the

308 |
THE OPTICAL PROPERTIES OF DENSE PLASMA |
nm
 cm
cm
Fig. 8.4. The shift in the xenon line of 467.1 nm. Measurement results: curve, extrapolation of the data of Tsarikis and Eidman 1987, Truong-Bach et al. 1981; +, Kettlitz et al. 1985;
◦, G¨unter et al. 1985; , Sechenov and Novikov 1987.
The models which treat the shift of photoionization threshold as a result of spectral line overlap are su ciently valid only for the plasma of hydrogen, whose lines are closely arranged and strongly broadened due to the linear Stark e ect. Even for ionized helium having a broad but wider (by a factor of four) spaced lines, such a treatment is not valid. This is even more true of the spectral series of complex atoms where the line broadening is much weaker. Therefore, a number of other methods have been proposed to estimate the shift of the photoionization threshold. Armstrong (1964) equated the interlevel energy distance e2(a0n 3)−1 with the level width given by the asymptotic Baranger formula which describes broadening by electron impacts. This yields
2 |
ωn = 8π2 e2αa02ne! |
me2/2πkT !1/2 (n )4 , |
|
where α = e |
/hc and n is the e ective main quantum number of the level with |
||
the bond energy En = Ry/(n 2). The shift is |
|
||
|
∆E = 4.71 · 10−6ne2/7T −1/7, |
(8.17) |
|
where T and ∆E are expressed in eV, and ne, in cm−3.
In the spectra of complex atoms, the lines of di erent spectral series overlap. The spectra of inert gases of argon, krypton, xenon, and neon have a dense sequence of terms starting from the bond energy of 1 eV. The distance between the levels in this sequence is 0.01–0.05 eV. By introducing some averaged distance

THE EFFECT OF WEAK NONIDEALITY |
309 |
log ∆E, (eV) |
|
|
|
0 |
|
|
1 |
|
|
|
|
–1 |
|
|
|
–2 |
|
2 |
|
|
|
logNe, (cm–3) |
|
12 |
14 |
16 |
Fig. 8.5. The shift in the photoionization boundary as a function of the electron number density (Vorob’ev 1978). Theory: 1, Inglis–Teller formula; 2, (8.18), δ = 0.02 eV. Experimental data are borrowed from Batenin and Minaev (1975). ∆E is expressed in eV and ne in cm−3.
among the levels of the dense sequence, δE, one can compare this distance with the width of the given higher level. The levels overlap if their bond energy is less than ∆E, which is defined by the expression (Vorob’ev 1978)
∆E = 3.5 · 10−10 ne/ |
|
δE 1/2 . |
(8.18) |
Te |
Figure 8.5 gives the values of δE derived in experiments for argon and xenon as a function of ne with Te = 0.8–1.5 eV.
The behavior of the near–threshold Balmer spectral region is shown in Fig. 8.6. The higher terms in the Balmer series are already absent: they have been transformed into a continuum (the undisturbed threshold is indicated in Fig. 8.6 by the arrow). The shift ∆E increases with ne.
In conclusion, we emphasize the conditionality of the concept of “optical shift”. At any frequency less the threshold frequency, an atom may radiate or absorb a quantum in both bound–bound and bound–free transitions. One can see from Fig. 8.6 that the optical shift, that is, the distance from the shifted photoionization threshold to the first line discernible in the spectrogram, is a conditional quantity dependent on subjective factors.

310 |
THE OPTICAL PROPERTIES OF DENSE PLASMA |
cm
 nm
nm
Fig. 8.6. The absorption coe cient of the Balmer series per single absorbing atom as a function of wavelength λ (G¨unter et al. 1985). Measurement results: 1, ne = 1.7 · 1017 cm−3, T = 1.6 · 104 K, γ = 0.07; 2, ne = 8.4 · 1017 cm−3, T = 2.22 · 104 K, γ = 0.09.
8.4The microfield distribution function in nonideal plasma
As a result of spontaneous violation of the electroneutrality of the plasma on scales of the order of the screening distance, microfields which fluctuate in time occur in the plasma (Ecker 1972; Sevastyanenko 1985; D’yachkov 1995). The microfield distribution function is used to calculate the optical properties of line broadening and shift, as well as the shift in photoionization thresholds. Microfields are divided into two groups: low–frequency microfields due to ions and high–frequency microfields due to electrons.
The distribution function for ion microfields is usually calculated within a one–component system of N ions against a uniform neutralizing electron background:
P (F) = dR1 . . . dRN δ F |
N |
F (Rj ) W (R1 . . . RN ) /ΩN . (8.19) |
|
− j=1 |
|
|
|
Here, F(Rj ) is the field intensity at the sampling point, developed by the jth ion; Rj are the coordinates of ions; Ω is the system volume, and W is the Gibbs probability defined by the potential energy of the charge interaction.

THE MICROFIELD DISTRIBUTION FUNCTION IN NONIDEAL PLASMA 311
. |
a |
b |
.
.
Fig. 8.7. The ion microfield distribution function P (ε) at (a) a positively charged point and
(b) a neutral point (Kurilenkov and Filinov 1976): 1, Holtsmark distribution; distributions in a nonideal plasma: 2, γ3 = 0.01; 3, γ3 = 0.1; 4, γ3 = 1.0; 5, γ3 = 5.0.
The known Holtsmark distribution of ion microfield was derived for systems of uncorrelated charges, in which W = 1. In a nonideal plasma, the correlation a ects the field distribution. A strong interion repulsion prevents ions from coming close together, thereby reducing the probability of emergence of strong fields. This, in turn, must a ect the spectra, by reducing the shift and cutting o the wings of the spectral lines. A number of theoretical approaches were developed (Kurilenkov and Filinov 1976; Tighe and Hooper 1977; Iglesias, Lebowitx, and MacGowan 1983; Dharma-wardana and Perrot 1986) to include the correlation.
Kurilenkov and Filinov (1976, 1980) have calculated the microfield correlation functions at positively charged, neutral and negatively charged points of a plasma with γ = 0.01–5.0, where γ = e2(ni + ne)1/3/kT . The classical expression (8.19) was generalized to the quantum case using the interaction pseudopotentials which enable one to include the quantum e ects when the particles are drawing together (see Section 5.3). The Monte Carlo method was used for further calculations. The microfield distribution functions are given in Fig. 8.7. The correlation indeed leads to a reduction in the probability of emergence of strong fields.
In the experiments of G¨unter, Hess, and Radtke (1985), Bespalov, Kulish, and Fortov (1986), and Sechenov and Novikov (1987), deviations were observed from the linear dependence of the shift in xenon and argon spectral lines on the electron number density. In xenon, weak deviations were recorded at ne ≤ 3·1018 cm−3 (see Fig. 8.4). Sechenov and Novikov (1987) studied an argon spectrum corresponding to 4s − 4p transitions at ne ≤ 1019 cm−3, T ≤ 1.7 · 104 K, p ≤ 17 MPa. The generation of the plasma and the recording of its thermodynamic parameters were performed during compression and heating in the shock front. For all lines investigated in the 730–780 nm range, the extrapolation of ideal–plasma calculations to the region of attained parameters showed that the observed shifts


 cm
cm