

- •VOLUME 4
- •CONTRIBUTOR LIST
- •PREFACE
- •LIST OF ARTICLES
- •ABBREVIATIONS AND ACRONYMS
- •CONVERSION FACTORS AND UNIT SYMBOLS
- •HYDROCEPHALUS, TOOLS FOR DIAGNOSIS AND TREATMENT OF
- •HYPERALIMENTATION.
- •HYPERBARIC MEDICINE
- •HYPERBARIC OXYGENATION
- •HYPERTENSION.
- •HYPERTHERMIA, INTERSTITIAL
- •HYPERTHERMIA, SYSTEMIC
- •HYPERTHERMIA, ULTRASONIC
- •HYPOTHERMIA.
- •IABP.
- •IMAGE INTENSIFIERS AND FLUOROSCOPY
- •IMAGING, CELLULAR.
- •IMAGING DEVICES
- •IMMUNOLOGICALLY SENSITIVE FIELD–EFFECT TRANSISTORS
- •IMMUNOTHERAPY
- •IMPEDANCE PLETHYSMOGRAPHY
- •IMPEDANCE SPECTROSCOPY
- •IMPLANT, COCHLEAR.
- •INCUBATORS, INFANTS
- •INFANT INCUBATORS.
- •INFUSION PUMPS.
- •INTEGRATED CIRCUIT TEMPERATURE SENSOR
- •INTERFERONS.
- •INTERSTITIAL HYPERTHERMIA.
- •INTRAAORTIC BALLOON PUMP
- •INTRACRANIAL PRESSURE MONITORING.
- •INTRAOCULAR LENSES.
- •INTRAOPERATIVE RADIOTHERAPY.
- •INTRAUTERINE DEVICES (IUDS).
- •INTRAUTERINE SURGICAL TECHNIQUES
- •ION-EXCHANGE CHROMATOGRAPHY.
- •IONIZING RADIATION, BIOLOGICAL EFFECTS OF
- •ION-PAIR CHROMATOGRAPHY.
- •ION–SENSITIVE FIELD-EFFECT TRANSISTORS
- •ISFET.
- •JOINTS, BIOMECHANICS OF
- •JOINT REPLACEMENT.
- •LAPARASCOPIC SURGERY.
- •LARYNGEAL PROSTHETIC DEVICES
- •LASER SURGERY.
- •LASERS, IN MEDICINE.
- •LENSES, CONTACT.
- •LENSES, INTRAOCULAR
- •LIFE SUPPORT.
- •LIGAMENT AND TENDON, PROPERTIES OF
- •LINEAR VARIABLE DIFFERENTIAL TRANSFORMERS
- •LITERATURE, MEDICAL PHYSICS.
- •LITHOTRIPSY
- •LIVER TRANSPLANTATION
- •LONG BONE FRACTURE.
- •LUNG MECHANICS.
- •LUNG PHYSIOLOGY.
- •LUNG SOUNDS
- •LVDT.
- •MAGNETIC RESONANCE IMAGING
- •MAGNETOCARDIOGRAPHY.
- •MANOMETRY, ANORECTAL.
- •MANOMETRY, ESOPHAGEAL.
- •MAMMOGRAPHY
- •MATERIALS, BIOCOMPATIBILITY OF.
- •MATERIALS, PHANTOM, IN RADIOLOGY.
- •MATERIALS, POLYMERIC.
- •MATERIALS, POROUS.
- •MEDICAL EDUCATION, COMPUTERS IN
- •MEDICAL ENGINEERING SOCIETIES AND ORGANIZATIONS
- •MEDICAL GAS ANALYZERS
- •MEDICAL PHOTOGRAPHY.
- •MEDICAL PHYSICS LITERATURE
- •MEDICAL RECORDS, COMPUTERS IN
- •MICROARRAYS
- •MICROBIAL DETECTION SYSTEMS
- •MICROBIOREACTORS
- •MICRODIALYSIS SAMPLING
- •MICROFLUIDICS
- •MICROPOWER FOR MEDICAL APPLICATIONS
- •MICROSCOPY AND SPECTROSCOPY, NEAR-FIELD
- •MICROSCOPY, CONFOCAL
- •MICROSCOPY, ELECTRON
- •MICROSCOPY, FLUORESCENCE
- •MICROSCOPY, SCANNING FORCE
- •MICROSCOPY, SCANNING TUNNELING
- •MICROSURGERY
- •MINIMALLY INVASIVE SURGICAL TECHNOLOGY
- •MOBILITY AIDS
- •MODELS, KINETIC.
- •MONITORING IN ANESTHESIA
- •MONITORING, AMBULATORY.
- •MONITORING, FETAL.
- •MONITORING, HEMODYNAMIC
- •MONITORING, INTRACRANIAL PRESSURE
- •MONITORING, NEONATAL.
- •MONITORING, UMBILICAL ARTERY AND VEIN
- •MONOCLONAL ANTIBODIES
- •MOSFET.
- •MUSCLE ELECTRICAL ACTIVITY.
- •MUSCLE TESTING, REHABILITATION AND.
- •MUSCULOSKELETAL DISABILITIES.
MICROSCOPY AND SPECTROSCOPY, NEAR-FIELD
MIODRAG MICIC
MP Biomedicals LLC
Irvine, California
INTRODUCTION
The explosion of knowledge in life sciences is enabled by the ability to visualize beyond the capability of the human eye and by the capability to identify chemical compositions and the structure of matter. This was enabled by Levenhook’s discovery of the new device for looking at the world of the small: the microscope. He found that by combining two lenses, it was possible to see much smaller objects than by the naked eye alone. This led to his subsequent discovery of the cell, which has spurred an explosion of knowledge in life science and medicine that continues at a dramatic rate of growth even today. Even 400 years after the Levenhook discovery, one of the first tools of choice for the visualization of small objects is the optical microscopy. What is known to a lesser extent is that the microscopic histochemical studies (i.e., staining of the tissues) with tissues and organelle-specific dyes in the late 1800s, initiated the modern pharmaceutical industry, when chemists and histologists alike envisioned an opportunity to selectively inhibit or kill pathogens by organic molecules in the same way organic dyes selectively label certain types of tissues, cells, and organelles. While the optical microscopy methods were able to uncover morphology and the structure and nature of the cells, they were faced with the ultimate physical limit of magnification, which is dictated by the spatial resolution limited by the diffraction limit. This limit was approximately the size of half of the wavelength of light used to perform the imaging.
The breakthrough in imaging small structures and further understanding the machinery of life and cell biology comes with the application of the deBroglie’s postulate of particle-wave equality in order to use the electron beam with a shorter associated wavelength as an investigative imaging probe. Ruska’s development of the first transmission electron microscope in late 1930s and the development of scanning electronic microscopies in the 1950s, opened the door to detailed investigations of the organization of subcellular assemblies, viruses, and even imaging of the individual biomolecules, at a resolution far beyond the diffraction limit of visible light. The rapid advances in the tools and techniques of ultramicroscopy, especially of scanning probe microscopies, which for the first time enabled routine molecular imaging, greatly contribute to enabling completely new multidisciplines, like nanoscience and nanotechnology, as well as an opening a door for an entirely new way of looking into the machinery of life.
While scanning probe microscopy in the 1990s allowed imaging at the unprecedented resolution of the unaltered samples; in general, it lacked the ability to uniquely identify the chemical composition of samples or unveil their physicochemical properties. For the investigation of chemical structures and fingerprinting the material composition, the tool of choice is optical spectroscopy. However,
MICROSCOPY AND SPECTROSCOPY, NEAR-FIELD |
435 |
the problem with classical optical spectroscopic techniques is that it provides average, bulk results with no specific information linking certain morphological features with spectra. This can ultimately identify chemical composition and/or physicochemical properties. The ability of doing molecular fingerprinting and, in a raster pattern, subsequent molecular specific imaging at the nanoscale with the spatial resolution of modern ultramicroscopy techniques is the holy grail for many aspects of today’s life sciences disciplines.
This goal is partially fulfilled with electron microscopy combined with energy-dispersive X-ray analysis (EDX), wherein semiquantitatively, it is possible to associate topographical structures with elemental composition. However, for most of the problems in life and materials sciences, simple knowledge of elemental composition is not sufficient, as it is necessary to identify molecular structure. Plus, the electron microscopy is, in most cases, a destructive method of analysis, since the sample needs to be prepared to be vacuum compatible, and be either electrically conductive, in the case of scanning electron microscopy, or have contrasts with heavier metals, in the case of transmission or scanning transmission electron microscopy. Furthermore, the physics of generating characteristic X rays (i.e., the minimum size of the excitation volume from which the signal is emerging) is in the tens of micrometers, thereby limiting elemental compositional analysis with spatial resolution only for the large structure in the tens-of-microns-sized range. The ideal technique will be one that will allow imaging of the unaltered sample, in a way similar to the way atomic force microscopy (AFM) allows, while at the same time providing a way for spectroscopic identification of the chemical structure.
There are several techniques currently in their infancy that promise spectroscopic probing with electromagnetic spectroscopic information carrier signals imposed over topography. They are near-field scanning optical microscopy, microthermal analysis, scanning nuclear magnetic resonance (NMR) microscopy, and scanning electron paramagnetic resonance (EPR) microscopy.
However, for solving any of the practical problems, it will be of great benefit that the ultrastructure’s information probes are photons of visible, and near-infrared (IR) and ultraviolet (UV) light, as a great deal of both morphological (based on the photon’s position and intensity/count) and compositional (based on adsorption, fluorescence, Raman shift, etc.) information can be simultaneously obtained as optical microscopy relies on light as an information carrier. This is due to the fact that the same photons, which are in standard imaging configurations used to generate images, carry much more information on composition and the various physical and chemical properties of the observed spot on the sample that can be extracted through different spectroscopic methods.
The technique that has evolved over the last decade and promises to fulfill the above-goals at the nanoscale level, is near-field scanning optical microscopy (NSOM or SNOM), which effectively breaks the physical limits imposed by the optical-diffraction-limited resolution by using the near-field evanescent waves and scanning mechanisms similar to those in the scanning probe microscopies.
436 MICROSCOPY AND SPECTROSCOPY, NEAR-FIELD
THEORETICAL PRINCIPLES OF NSOM MICROSCOPY
Abbe’s equation (Eq. 1) describes the resolution of the classical, far-field optics, (i.e., the minimum separations between two points that can be distinguished) (1). From this equation it is easy to conclude that the maximum attainable resolution in the far field is 12 of the applied wavelength, which means that the best optical microscope cannot be used to visualize details smaller than 200–400 nm.
pmin ¼ |
l |
|
ð1Þ |
|
|
||
2n sin a |
0 |
||
|
|
|
In Abbe’s equation, n is the diffraction of the imaging index and a0 is the aperture angle in the medium. While Abbe’s equation describes the limiting resolution in the world of conventional optics, the Fourier optics approach can provide us with the same conclusion. Following Abbe’s principle, Rayleigh (2) derived that the objects in a lens system in the far optical field are resolved only when the maximum of one pattern coincides with the first minimum of the neighboring features. What resulted was the discovery that the resolution criteria that describe the maximum resolution of the optical system based on the size of the numeric aperture was
d ¼ 0:61 l=NA |
ð2Þ |
wherein l is the applied wavelength and NA is the numerical aperture of the lens, again bringing the maximum theoretical resolution to 200 nm.
A similar observation can be derived from the Fourier formalism in optics. In Fourier optics, the information content embedded in the spatial frequency f, in the case when f is higher then 1/l, decays rapidly toward zero from the object and thereby, no data on the subwavelength features can be efficiently collected with standard far-field optics. However, it is well known that it is possible to receive an electromagnetic signal with antenna that is smaller in size than the wavelength. The solution of the Maxwellian equations that govern the behavior of electromagnetic radiation differs in the distance smaller than the wavelength than in the distance, much larger than the considered wavelengths. When the waves propagate within the distance much smaller than its wavelength, such situation is called the near field. The pragmatic definition of near-field optics will be a division of optics that deal with the elements of the subwavelength features scales, which are intended for passing the light through, from or near, to another element with subwavelength features positioned within the subwavelength distances. The spatial resolution in near-field optics depends on the feature’s size and is limited to about one-half of the aperture size. Furthermore, the near-field system must be considered as a complete system consisting of two features (probeandsampleinthecaseofmicroscopy)andtheresolution of the system will be dependent on both sample and probe. Thus, it is impossible to speak of the unique or standard nearfield resolution, as is done with a far-field instrument.
NEAR-FIELD IMAGING EQUIPMENT
The near-field scanning optical microscopy or scanning near-field optical microscopy (NSOM or SNOM) is a tech-
nique that enables users to work with standard optical tools that are integrated with scanning probe microscope (SPM) technology to obtain the optical image at a resolution in the range of tens of nanometers. This is quite comparable with the resolution of scanning electron or SPM. The integration of scanning probe and optical methods allows for the collection of optical information at resolutions well below the optical diffraction limit, which overlap real topography information obtained by scanning probe feedback. For spectroscopy applications, NSOM offers the potential for characterizing the spectroscopic signature of material on a submicron-to-nanometer scale, thereby affording new insights into nanoscopic structure and composition.
The principles of NSOM microscopy were theoretically founded by Synge in 1929 (2), and in his subsequent paper he described an imaginary device that closely resembles today’s NSOM setup (3), including the use of piezoactuators. Due to technical difficulties at the time to implement such a device, the idea was forgotten until theoretician O’Keefe rediscovered the idea in 1956 (4). The first practical demonstration of the imaging of a structure smaller than the one-sixtieth of the applied wavelength was done in 1971 using the microwave in near-field scanning over the grid (5). The basic idea behind this method was to create evanescence, a standing wave, by light diffraction through an aperture that was much smaller than the wavelength, and then to use this evanescent light source to scan a sample in a raster-scan pattern in close proximity, and collect transmitted or reflected signal in the far field. The first demonstration of near-field optical imaging was implemented independently by Pohl (6) in 1982 and Lewis groups (7) in 1983, and described as an optical stethoscopy, in what is now considered the beginning of NSOM microscopy. The method grew rapidly during the 1990s and the trend is continuing to this day, as described in recent reviews (8–12). Furthermore, several companies are offering commercial instruments (13–16) that enable ordinary users, who are not inclined toward the instrumentation development, to apply NSOM in solving their research problems.
There are two fundamentally different ways to achieve near-field optical imaging. They are apertured-base and apertureless NSOMs with their principles of operation depicted in Fig. 1a and b (17). In the case of the apertured NSOM (Fig. 1a), the light passes through an aperture that is much smaller than the wavelength of applied light, and ultimately the resolution is defined by the size of the aperture. In the case of the apertureless NSOM (Fig. 1b), a sharp metallic tip is irradiated by a laser perpendicular (or as close as possible) to the tip along the axis. The irradiation excites the plasmons on the metallic surface of the tip and the field is concentrated by combining antenna and plasmonic effects at the top of the tip. The resolution of apertureless NSOM is thus defined by the size of the near-field excitation formed at the apex of the metallic tip, and is determined by tip sharpness, tip materials, and real and imaginary parts of the refraction index of the used metal.
The practical advantage of apertured NSOM is in its easy implementation. While the advantage of the apertureless

MICROSCOPY AND SPECTROSCOPY, NEAR-FIELD |
437 |
NSOM is theoretically a higher achievable resolution and possibly higher field strength, the technical difficulties in implementing the apertureless setup have not permitted those advantages to be realized. Thus, as of this writing, all of the existing commercial instruments are based on the apertured NSOM approach.
Regardless of the type of NSOM, the experimental setup always consists of a piezo X–Y scanner, whose role is to execute the raster-scan pattern scanning of the sample by the near-field probe; a Z piezo, whose role is to modulate the image by keeping the sample-tip distance; an optional, but for most cases necessary, noncontact modulation element, such as the tuning-fork for shear force feedback, or a piezoor electromagnetic oscillator for AFM-like noncontact feedback; a near-field probe, which can be aperture or sharp tip; a laser light source; a far-field optical signal collection system, sample and sample holder; a system for coarse probe approach and sample–probe alignment; a scanner controller and computer for the image acquisition and reconstruction; and a vibration isolation system. In this manner, the NSOM most closely resembles the mechanism of the AFM, and almost all of the existing commercial setups, as well as many of the in-house, labmade NSOMs, share these common components with the AFM and more general SPM platforms.
Piezo Scanner
The piezo scanner principle of work is based on the piezo effect, which is reversible internal stress induction within the crystal when exposed to the electric field (18). This stress induces crystal expansion. The piezo scanner in the NSOM is a more critical part than in the standard AFM. Ideally, it should be the perfect closed-loop scanner, due to stringent requirements of keeping the probe in a particular place during the raster scan, in order to achieve sufficient optical signal/noise ratio. Figure 2 depicts typical scanner configurations. The scanners are usually implemented in the form of the stacked piezo crystals (Fig. 2a), tube scanners (Fig. 2b), and bimorph (Fig. 2c) (19). Furthermore, scanners are often grouped into the so-called tripod configuration. The same material used for the SPM scanner, lead-zirconate-titanate ceramic (commonly referred as a PZT ceramic), is commonly used for the NSOM piezo scanner. The typical piezo-electric constant for PZT materials is about –1.7 V nm 1. However,
Figure 1. Two major principles of achieving the nearfield scanning optical microscopy: (a) the aperturebased NSOM; (b) scatter-field, apertureless NSOM.
in order to practically achieve the linearity over the whole range of scan, it is necessary to calibrate each individual scanner periodically to compensate for crystal nonlinearity, creeping, and drift. Those effects are further minimized by using active, real-time feedback, which can be implemented either through some form of the strain gauge, capacitance, or by optical means. The active feedback adjusts the voltage applied to the scanner to keep linearity and to secure the probe above the scanning position within the raster scan.
Optical Signal Acquisition System
The optical signal collection system is made up of optical and optoelectronic parts. The optical portion usually consists of the far-field microscope objective with a high NA lens. The tip-sample working distance, as well as the sample thickness and sample holder accessibility, define the maximum NA of the objective that can be used. Oil immersion objectives are used to enhance the NA by many times. Besides the objective, the collection system may contain filters, notch-filters polarizers, and beam splitters, depending on the particular configuration and imaging mode. The optoelectronic part of the collection system converts optical information to an electrical signal for further processing. It is usually either a highly sensitive photomultiplier tube (PMT), or, for ultimate sensitivity and single-photon counting, an avalanche photodiode detector (APD) array. For the PMT tube, the output signal can be either voltage or counts, and for the APD, it is only TTL (transistor–transistor logic) counts. The high sensitivity PMT tubes can satisfy most of the imaging requirements, however, for extremely weak signals, such as in single-molecular imaging or single-molecular spectroscopy, an APD detector is more desirable. Due care does need to be paid when using the APD detector, as overexposing the detector can damage it in an extremely short period of time. For the purpose of correlated experiments, many detectors are attached to the system. In the case of spectroscopy applications, the most commonly used dispersive detector is a highly sensitive CCD imaging camera, either solid-state or liquid-gas cooled. However, many setups use the other, more economical, wavelength or energydispersive detection systems, which are based on filters, prisms, or gratings in conjunction with either a PMT or APD detector.

438 MICROSCOPY AND SPECTROSCOPY, NEAR-FIELD
Figure 2. Schematics representation of the piezo actuators: (a) stacked piezo; (b) tube scanner; (c) bimorph scanner. [Courtesy PI (Physik Instru-mente) LP, www.pi.ws.
Light Sources for Near-Field Imaging and Spectroscopy
Illumination sources for near-field microscopy are always lasers. Selection criteria for the laser depends on the desired wavelength(s). The most economical are the solid-state lasers, followed by ion lasers, such as the Ar laser, which can selectively produce multiple wavelengths of light from 450 to 514 nm (17). Besides the two most common types, many setups use liquid lasers as well as optical parametric oscillators to produce specific wavelengths that are not available with a standard laser. The transduction path can consist of mirrors or single-mode optical fibers. The mirror-based path has better throughput, however, it is more complex to adjust and requires periodic readjustment. The optical-fiber-based transduction path has some higher attenuation then the mirrorbased path, but it is very convenient for use, especially if it is implemented with the standard FC or similar connectors.
Microscope Head
The NSOM head usually consists of a probe holder, one or more piezo scanners, a system for coarse probe approach, and a case. The head is positioned at the top of the sample holder. The probe holder is directly attached to the Z direction piezo. A video system, which shows the image of the approaching tip and substrate, and a softwarecontrolled stepper motor with micrometric screws provide coarse approach of the probe to the sample surface. When the probe tip is brought to close proximity to the sample, the fine approach mechanism is engaged. The fine approach mechanism is essentially a stepped mechanism wherein the probe is brought in a small piezo steps in the vertical direction to close the gap between the tip of the probe and sample substrate. The contact is achieved when the signal indicates the deflection of the probe
in AFM-like setups, or, in shear-force mode, when its interaction with the sample reaches the user-prescribed ‘‘set point’’ voltage or current level. The determination of the appropriate set point varies for different samples and systems, and is more a result of art or tacit knowledge than an exact science. If the Z piezo is completely extended and contact has not been achieved, the piezo constricts to its neutral position and the stepper motor is activated to bring the probe to the approximate max extension distance of the piezo, and the process is repeated. Besides the Z piezo, sometimes the X–Y scanners can be positioned in the head.
Sample Holder/Stage
The sample holding stage can contain the X–Y piezo scanner, if it is not in the head. Its moving frame consists of micrometric screw positioners that push the sample holder in the X–Y direction under the probe, thus allowing sample ‘‘pan’’ operation. These screws can be manually or steppermotor operated. The sample stage can be stand-alone, or it can be positioned at the top of an inverted, epi-fluorescence microscope. There are many advantages to having the NSOM sitting at the top of the standard inverted microscope. This configuration is able to combine farand nearfield microscopy, exploit the operation familiarity of the inverted fluorescence microscope, and deliver superior images to those acquired via a dedicated, stand-alone NSOM stage. However, a drawback of such a configuration is a larger mechanical circuit with a higher level of vibrational noise than in a dedicated system.
Controller
Controllers for NSOM are usually derived from the AFM/ SPM controllers. In all of today’s setups, they are digital.

The controller’s role is to generate the high voltage signals necessary to feed the piezo scanner and move the probe in the raster scan pattern. It also controls the vertical, Z position of the probe via the PID control-loop model mechanism (proportional-integral-differential), and thus topographically modulates the signal; it maintains the non–contact feedback; it controls the coarse probe approach, and in some instances coarse sample positioning; and it acquires the signals coming from the probe (both optical and topographical) and forwards them to the computer for further processing. The controller usually consists of a series of analog-to-digital and digital-to-analog converters, precision operational amplifiers, and high voltage amplifiers. Due to the complexity of the tasks, often the controller is designed using high end digital signal processors and other high end embedded systems.
The role of the control software is to control the controller, acquire the image, and store it in some of editable and exportable format. Furthermore, the control software almost always possesses image processing capabilities, such as different image filters, Fourier transform, 3D representations and rendering, and so on. All of the commercially available NSOMs share the same software with their AFM/SPM ‘‘cousins’’. Many of the homemade systems, on the other hand, have software modified from existing commercial SPM/AFM controller software, or software that is independently written, as in cases where the users have designed the whole control electronics by themselves. Many times, the results are processed in third party software. For example, for image processing a very popular solution is to use shareware NIH Image software or its PC cousin, Scion Image, and for advanced applications, to use scripts written for IgroPro, LabView, MathLab, or for spectroscopy experiments, WinSpec. Use of higher level software like Igor Pro dramatically reduces development time of applications, as compared to the time required to write the script in C or Cþþ code.
Apertured NSOM
The principle of the apertured NSOM is to use the aperture as a scanning probe. This is the first (5,6) and up-to-today most commonly implemented NSOM setup. In basic principle, the instrument consists of the XYZ piezo scanner(s) that moves the apertured probe over the raster scan pattern at the controlled aperture-sample height, and a noncontact feedback mechanism, the best-suited being the shear-force based one (20). An aperture in the tens of nanometer size can be formed by the tapering, heating, and pooling process borrowed from biophysics labs, where it is utilized for creating micropipettes (21) or for etching optical fibers (22). Additionally, as an aperture, it is possible to use the hollow cantilever (23).
Schematic representation of the instrument implementation, for both imaging and spectroscopy–hyperspectral imaging, is presented in Fig. 3a, configured for the most common, transmission mode (looking through the sample) operation. The laser light is coming from the optical fiber. Optical fiber is mounted on the tuning fork assembly, which is held onto the Z-piezo scanner and is constricted at the end to a tens of nanometer size range (see insert) and
MICROSCOPY AND SPECTROSCOPY, NEAR-FIELD |
439 |
Figure 3. Example of the aperture-based, straight-fiber NSOM:
(a)schematics representation of the scanning probe and collection;
(b)schematics representation of the tapered fiber NSOM probe, attached to the tuning fork; (c) photography of the probe glued to the tuning fork; (d) SEM image of the end of the tapered, aluminum-coated fiber optic based NSOM probe. (Courtesy of Veeco Instruments Inc., Santa Barbara, CA.)
the evanescent field is formed at its aperture, as represented in the figure insert. The light is passing through the sample, interacting with sample matter, and is collected under the sample in the far-field with the high numerical aperture microscopy objective. Such a signal is further subjected to collection and processing. For the hyperspectral imaging or for the spectroscopy or spectral imaging purposes, the signal is first passed through the holographic notch filter, which eliminates excitation light and through the beam splitter is directed to the wavelength-dispersive detector, such as a CCD spectrometer, and to the summary, imaging detector, such as a PMT, or avalanche photodiode detector (APD). In the simplified setup, if the apparatus is used just for the optical imaging, the light is passed directly from the objective into the imaging detector, (i.e. APD or PMT).
Figure 3b schematically represents a typical apertured probe, mounted on the tuning fork. Micrographies at

440 MICROSCOPY AND SPECTROSCOPY, NEAR-FIELD
Fig. 3c and d represent the frontal and lateral view of the metallic-coated, laser-pulled, tapered, fiber-based tip. An evanescent, standing wave is formed at the end of the aperture, and the size of the aperture approximately defines the optical resolution. Light is either brought through the aperture, as in transmission and reflection imaging mode, or collected through the aperture, as in the collection mode. The tip is scanned across the sample in a raster-scan pattern, and for imaging purposes; the signal is collected in the far field, either by sensitive photomultiplier tube, or by sensitive avalanche photo-diode counter.
The three distinctive different modes of operations of the aperture-based NSOM are illustrated in Fig. 4, which also graphically depicts the different kinds of information that can be extracted from the optical signal emanating from the sample. The origin of the optical contrast, as depicted in Fig. 4, can be due to topographic differences (different path length change the adsorption), material birefringence, reflectivity, sample extinction coefficients for the particular excitation wavelength, index of refraction, fluorescence emission properties, nonlinear spectroscopical properties of materials, and mechanical and magnetic stress in the sample. However, at the moment of this writing, for life sciences and biomedical applications, only transmitivitty, reflectivity and fluorescence properties are of significance. The mode that is the most useful for biological applications is the transmission mode or the ‘‘looking through’’ mode, and is most similar to classical biological microscopy In this case, as described above, light is brought through the fiber-based tip, the near field interacts with the sample, and the signal is collected in the far field as it passes through the sample. In this mode, it is possible to do transmission imaging, as well as fluorescence or other wavelength-resolved imaging, by application of adequate filters or wavelength-selective elements. In a reflection mode, which can be described as ‘‘looking on the surface mode’’, the near field interrogates
Figure 4. Typical apertured NSOM configuration: (a) illustration of information that is carried and can be extracted from the optical signal; (b) transmission and reflection mode NSOM; (c) collection mode NSOM; (d) total internal reflection or dark field mode. (Figure 3b–d adapted from Ref. 17.)
the surface of the sample, and the scattered signal is collected in the far field. This mode allows imaging and spectroscopy of the nontransparent samples; however, the imaging efficiency is much lower than with transmission mode. In a collection mode, the light is passed either through the sample, or illuminated on the sample, and the signal is collected through the fiber in the near field. This mode is very burdensome to use, has low signal collection efficiency, and is used mainly in photonics research.
Besides these three modes, there are more exotic modes of operation, such as combined collection and illumination, where both sample illumination and resulting signal are passed and collected through the same probe; dark field imaging, where the probe tip is in close proximity to a sample that is illuminated from underneath with total internal reflection from the substrate, and wherein the probe acts as a second, tunneling prism. Besides pure optical operation modes, there are also a combined optomagnetic NSOM, which explores Kerr’s effect (24); nanomass spectroscopy (25), where near field is used for ablation; and optoelectrochemical NSOM (26). The later two modes have a lot of potential applications in physiology with their ability to simultaneously image and record potential at subwavelength resolution.
To secure the probe in a near field, the aperture must be kept in close proximity to the sample with a distance much smaller than the applied wavelength. The fiber is kept at the nanometer-range distance from the sample by means of noncontact feedback. There are several ways of achieving feedback, mainly shear force, AFM-like normal force contact, and noncontact force feedback. The shear-force feedback provides gentler, lateral touching of the sample, thereby reducing the possibility of aperture contamination or tip–aperture mechanical failure.
In shear-force feedback (20), the fiber tip is oscillated laterally to the sample surface. The NSOM tip is rigidly premounted on a quartz tuning fork (Fig. 3b and c), which is a few millimeters in size. The tuning fork is mechanically vibrated at resonance frequency, usually in tens to hundreds of kilohertz, resulting in a few nanometers of lateral motion at the distal end of the NSOM tip. When the tip is in a close lateral proximity to the sample, the resonance frequency of the tip-tuning fork system is disturbed due to electrostatic, van der Waals, hydrogen bonding, and other kinds of attractive and/or repulsive interactions between the tip and the sample. This disturbance is read as an electrical signal that is processed, and the tip is moved accordingly in the vertical direction to achieve its preset resonance frequency, thus keeping the same distance from the sample.
Optical resolution, which is typically achieved by fiberbased apertured NSOM, is in the range of 50 nm, with maximum resolution being in the range of 20 nm. The improvement in tip fabrication procedures and in the control of the tip-sample separation distance will ultimately lead to better resolution. For apertured NSOM, fiberoptic or pipette-based tips are fabricated by constricting the core of the optical fiber to a 50–20 nm diameter. This is achieved by a heating–pulling method (21), wherein the fiber is transversally irradiated by CO2 laser and simultaneously

stretched on the pipette puller until the fiber is broken, or by chemical etching (22) at the phase boundaries using the HF solution with oil on the top. To enhance the efficiency of the light transmission and to avoid the light leakage through the fiber shell, the probes are usually coated with either aluminum or silver. The coating is done by vacuum evaporation, and its role is to prevent light leaking out of the probe. The metallic coating is especially beneficial in the near-field surface-enhanced Raman spectroscopy.
Another way of performing apertured NSOM is by bending the fiber or pipette. In this case, the force feedback can be achieved either by shear force, or by AFM-like normal force in both contact or noncontact mode. The disadvantage of this approach is that such bended fibers are more vulnerable to mechanical failure, and if used for spectroscopy purposes, there may be problems with Raman scattering lines coming from the fiber shell materials.
The other way of achieving apertured NSOM imaging is by using the hollow AFM cantilevers (23). In this kind of setup, the light from the excitation laser is focused on the top aperture on the center of the hollow AFM tip, and the near field is formed at its bottom. The feedback mechanism used therein is the same as in noncontact AFM. Presently, the resolution (in the range of 100 nm) of such hollow- cantilevered-based apertured NSOMs is inferior to that of pulled-fiber-based NSOMs. Another disadvantage of the AFM-like force-feedback setup in NSOM applications is in that the AFM uses a laser beam to follow the bending of the cantilever. In NSOM, when many applications are counting the individual photons, the optical noise introduced by the AFM-like laser-based feedback may be several folds stronger than the signal. Considerable improvement is to be expected with piezo-actuated hollow cantilevers, which will avoid using laser feedback.
Apertureless NSOM
In the apertureless NSOM (Figs. 1b and 5), a sharp metallic tip is irradiated by the laser light orthogonally to the long tip axis, and the near-field excitation is scattered from the
MICROSCOPY AND SPECTROSCOPY, NEAR-FIELD |
441 |
tip (27,28). The light scattering from the feature is much smaller than the applied wavelength, which also generates the strong evanescent field. The best strength of the scattering field is achieved if the excitation laser frequency corresponds to the surface-plasmon resonance of the metal from which the tip is made. Incoming beam scattering produces the evanescent field at the tip; however, the physics of the process is a combination of the near-field antenna effects and surface plasmon resonance. The laser induces the plasmons in the tip, which oscillates in parallel to the tip axis and amplifies the evanescent standing wave at the tip apex. The standing wave interacts with the sample and the signal is collected either in transmission or reflection mode in the far field. The tip is scanned across the sample in the same raster-pattern manner as with apertured NSOM. Feedback is provided in either the noncontact AFM manner, preferably with a tuning fork or some other nonlaser based Z-deflection feedback, and the signal collection is modulated by oscillating the probe in a vertical direction in order to avoid static and scattering artifacts. Furthermore, in modulated apertureless NSOM, the signal from the photodetector is also modulated with the same modulation signal source as a tip, in exactly the same frequency and phase (with possibilities of higher harmonics modulation. This is done in order to avoid inbound laser light nonnear-field induced scattering; static-scattering artifacts from sample features and to achieve optical signal acquisition always in a same sample-tip separation distance position.
In order to distinguish between the near-field scattering and inbound laser light, most of the apertureless NSOMs are used mainly for fluorescence, Raman, or for different nonlinear optical phenomena applications. Furthermore, because of the rapid decoy of the scattered field, modulation of the scanning probe, and control of the sample-tip separation distance in the apertureless configuration is much more critical than in the aperture-based NSOM.
Figure 5 is a schematic representation of a typical, homemade, apertureless NSOM setup; in this particular case used for fluorescence and fluorescence-lifetime (FLIM)
Nanoscope
Controller Computer
AFM head
r |
Coated AFM tip |
|
|
|
X-Y Piezo |
|
|
|
|
esa |
|
|
|
|
Stage |
Scanner |
|
|
|
L |
|
Controller |
Computer |
|
|
|
|
||
|
Microscope |
|
|
|
|
|
|
|
|
|
Objective |
|
|
|
|
Beam |
|
|
|
|
Splitter |
|
|
|
|
Filter |
|
|
|
|
APD |
|
|
|
|
Filters |
|
SPC730 |
Computer |
|
|
|
Figure 5. Schematic representation of the example of the apertureless NSOM. (Adapted from Ref. 29.)

442 MICROSCOPY AND SPECTROSCOPY, NEAR-FIELD
near field imaging. It consists of a commercially available AFM head, mounted on the top of the inverted epifluorescence microscope, positioned at the optical table. The lateral irradiation of the tip, which is necessary in order to achieve the high intensity evanescent field generation, is produced by offsetting the position of the AFM tip in relationship to the high numerical apex microscope objective. In this particular case, the fluorescence imaging measurements were conducted in an inverted fluorescenceimaging microscope (Nikon Diaphot 300), the excitation light from a mode-locked YAG laser (Coherent Antares) at 532 nm wavelength, 10 ps pulse width, and 76 MHz repetition rate was focused on a diffraction-limited spot through an objective (Nikon 60X NA 1.4), and the emission from the sample was collected by the same objective, in the epi-fluorescence manner. The emission band-pass filters were HQ565/25 and D570/20 (Chroma Technology) to ensure that the excitation light and the feedback laser of AFM (650 nm) were both blocked. The emission was detected by an avalanche photodiode (APD) (Perkin Elmer, SPCM-AQR-15). The background photon counts with AFM feedback on were 150 Hz. The sample cover slip was mounted on a closed-loop two-dimensional (2D) piezoelectric scanner (Polytec PI, P-731). The AFM (Veeco Instruments Inc, D3100) head and inverted microscope were coupled at an over–under position. The AFM tappingmode tips used in this work are commercially available Si tips (Digital Instrument, OTESP7) coated with Au and Ag, by sputter coating. Image density of 128 128 pixels and scan rate of 1 Hz. As the quenching effect is highly distance dependent, the tip oscillation amplitude was reduced by reducing the driving voltage to the tip as much as possible without sacrificing image quality. Based on the force calibration curve, the tip oscillation amplitude during the imaging was estimated at 30 nm.
The sample-scanning confocal fluorescence image was recorded by a home-built computer control interface that counted the APD signal and raster-scanned the piezoelectric scanner. The fluorescence decay traces were recorded by a time-correlated single photon counting (TCSPC) module (Becker & Hickl SPC730, Germany). The start signal was from the APD and the stop signal was from synchronization of the YAG laser at one-half of the laser repetition rate. For the lifetime imaging mode, the TCSPC module reads the line-synchronization signal of the Digital Instrument Nanoscope IIIa controller to achieve a synchronized recording of the AFM signals and fluorescence signals.
Figure 6 depicts the FEM simulation (30) of near-field enhancement around a metallic tip positioned in close proximity to the sample and irradiated with a laser beam. Figure 6 shows the rapid dependence of the near-field excitation on the sample-tip separation, and emphasizes necessity of accurate, sub nanometer sample-tip separation control mechanism for any widespread, commercial applications. This is even more important for the Raman spectroscopy or hyperspectral imaging (or in this sense for any other, nonlinear optical applications), as the strength of the Raman emission is proportional to the fourth power of the strength of the electric field of applied light the small changes in the strength of the local near-field enhancement
Figure 6. Finite-element methods (FEM) simulation of the electromagnetic field scattering and near field enhancement at the apex of the tip of the apertureless NSOM, and its behavior with change in tip-sample separation distance. (Adapted from Ref. 30.)
can produce the dramatic fluctuation in the strength of the optical signal.
Besides all of the difficulties in implementation, the advantage of the apertureless mode is in theoretically better resolution than the apertured mode, and in the higher surface-enhanced Raman signal, due to plasmon coupling, which makes this method, theoretically, an ideal molecular Raman nanoprobe, a ‘‘holy grail’’ for life scientists (31,32). The hyperspectral subwavelength Raman imaging is extremely important for further studies in system biology, proteomics, and metabolomics, as it is expected it will for the first time allow identification and spatial positioning of biomolecules within a cell, without the introduction of fluorescence labels. Aside from Raman imaging, this approach is expected to be better for the purpose of fluorescence lifetime imaging (FLIM) (29). The apertureless approach also has significant advantages because the surface plasmon enhancement is driven by the metallic tip and a higher local intensity of the scattered field.
However, to date, there is no commercial instrument available based on the apertureless NSOM principle, because of many technical problems, a significantly smaller photon flux, a low signal/noise ratio, and extreme signal dependance on the tip-sample separation distance. It is expected that with improvements in the control mechanism
for keeping the sample-tip separation in the subnanometer range, as well as improvements in laser positioning and further enhancement of the photodetector efficiencies, the apertureless NSOM will become more widespread, with the first commercial instruments expected to be introduced to the market in the near future.
The tip for the apertureless NSOM can be manufactured in three different ways. The simplest way is by electrochemically etching the metallic wire in the same way as for production of the STM tips. However, controlled and optimized shapes, which can provide more efficient field enhancement, can be better achieved by using the free ion bombardment (FIB) techniques for both tip growth and etching.
NSOM Operations
The typical operation of the NSOM consists of positioning the tip above the sample feature of interest, visually using the reflection and transmission video system, respectively. After executing a manual approach procedure, the tip is subsequently placed under PID control and is automatically maintained in the near-field region. The nonoptical, shear-force feedback relies on measuring the voltage generated by a quartz tuning fork onto which the NSOM tip is rigidly mounted, thus avoiding feedback laser. Having a feedback without the feedback laser is of great advantage, as avoidance of that voltage is a direct measure for the oscillation amplitude of the tip-tuning fork assembly, which varies with tip-to-sample distance over a range of 25 nm.
Unlike conventional AFM cantilever designs, the spring constant of the straight-fiber NSOM tip in the vertical direction is extremely high, thus avoiding damaging snap-to-contact. A feedback algorithm monitors the amplitude of the tuning fork by appropriately adjusting the tipsample distance. Using this method, the NSOM tip is engaged and maintained within 5 nm of the surface in the near-field region throughout the NSOM scanning or spectroscopic measurements. Another advantage of using shear-force feedback is in the absence of a feedback laser, which is especially important in the low photon-count applications (e.g., in spectroscopy–hyperspectral imaging and single-molecular studies).
Other methods of maintaining the tip in the near field have not proven nearly as sensitive or reliable as tuning- fork-based shear-force feedback. Some methods originally developed for AFM applications may require actual surface contact and, consequently, possible surface or tip transformation, ultimately resulting in either damage or having to move the tip in and out of the near-field during data acquisition. The other disadvantage of AFM-like feedback is in the great technical difficulties to form a self-actuated, piezo-based AFM hollow tip, thus forcing the use of laser for feedback control. The AFM-like force feedback with pulled fiber tip requires a bent fiber, which is much less mechanically stable than a straight fiber. In addition, the bent fiber has problems associated with circular light paths and higher Raman scattering from glass–fiber substrates, interferences that carry especially negative consequences for near-field spectroscopy, as they can significantly increase the optical noise level.
MICROSCOPY AND SPECTROSCOPY, NEAR-FIELD |
443 |
The NSOM can be used both in air and in liquid. Most of the work to date has been done in air. While it has been demonstrated many times that the method can be successfully used in liquid operation, there are problems associated with the menisc force formed between the probe and liquid surface. For work in air, shear force is the superior method of feedback. However, for work in liquid, the AFMlike noncontact feedback has advantages. With further improvements in the fiber-based probes coating in the near future, it is expected that shear-force-based topographic imaging and feedback will become equal with the AFM-like noncontact-based topographic imaging in liquid.
Near-Field Spectroscopy
For spectroscopic studies, NSOM can be considered as a controlled light collector, with tens-of-nanometer spatial positioning resolution. Thus, many of the standard spectroscopic techniques could be applied, depending on the amount of signal available. For example, it was successfully demonstrated that NSOM can be used for fluorescence and photoluminescence spectroscopy; electroluminescence spectroscopy, time-resolved spectroscopy; polarization studies, and in early stage infrared (IR) and Raman spectroscopies. The latter of the two has the greatest promise in becoming the ultimate molecular nanoprobe. Some of the applications of in situ hyperspectral, that is, composition-specific nanoscale studies include chemical identification of observed samples; studies of optical properties of materials at nano-scale levels; detection of phase differences and impurities in materials; protein studies, and many more. Ultimately, it opens the door for a plethora of both fundamental and applied studies in the fields of physics, material science, chemistry, life sciences, and nanotechnology.
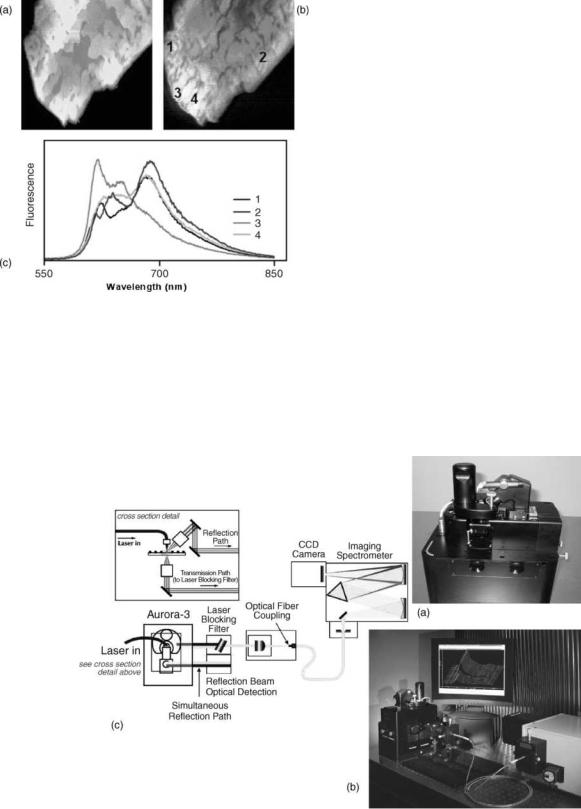
Examples of a near-field spectroscopy application are shown in Fig. 7. While Fig. 7a represents the topography image of the PIC dye crystal (33), Fig. 7b is the NSOM fluorescence image of the same area. In order to explore the origin of inhomogeneities, near-field fluorescence spectroscopy, with spectra presented at Fig. 7c, has been done at different points, labeled 1–4, on Fig. 7b. Finally, fluorescence spectra resolved the inhomogenieties of emission sources, pointing to the two different allotropes of crystals having emissions peaking at 645 and 690 nm, respectively.
The near-field signal, which is by default very weak, gets even weaker if we want to do the wavelength-resolved spectroscopic analysis, or full hyperspectral cube imaging, so longer exposition time is necessary to acquire usable spectra. For a near-field spectroscopy system to be successful, it needs to have an extremely stable probe position control, in all three axes, to keep the optimal sample-probe distance, and to keep the probe above the point of interest, for a prolonged time of signal collection.
Figure 8 represents the typical modern commercial NSOM microscopy–spectroscopy setup, in this particular case, an Aurora-3 for spectroscopy made by Veeco Instruments Inc., Santa Barbara, CA (34). In general, such a near-field microscopy–spectroscopy package consists of the NSOM microscope, an objective lens for signal collection, optical filters for elimination of the excitation laser light,
444 MICROSCOPY AND SPECTROSCOPY, NEAR-FIELD
Figure 7. Example of fluorescence-based hyperspectral near-field imaging. (a) Shear-force topography image; (b) NSOM fluorescence image; (c) spatially resolved fluorescence spectra, numbers 1–4 corresponds to the different position on the crystal, demonstrating chemically specific imaging and material inhomogenities at the nanoscale. (Courtesy of David Vanden Bout and Paul Barbara, University of Minnesota, Minneapolis, MI.)
an optical pathway for signal transduction to the detector, and a wavelength dispersive detector. As the signal is generally very weak, the spectrometer needs to have a very sensitive detection system, in the best case, singlephoton sensitivity. With today’s solid-state detectors technology, the best detector to use is the CCD camera with a larger stack of sensitive pixels coupled to the imaging spectrometer. Depending on applications, either a Peltier cooled camera will be satisfactory (for most bright fluorescence samples) or a liquid-nitrogen-cooled camera for ultimate sensitivity, such as in single-molecular experiments and near-field Raman spectroscopy. Furthermore, interfacing and communication between spectrometer and NSOM scanning probe control software needs to be established.
Today, many spectrometers have semiopen control software, thus allowing triggering of the spectral acquisition with the TTL handshake signal, which can be produced by the NSOM microscope controller. In this way, the microscope controller initiates spectral acquisition and the system can be used with many different commercial spectrometers, allowing customization of the microprobe. Filtering out excitation photons is of extreme importance to increase the signal/noise ratio, and the best filters available today are notch, interferometric filters. Another consideration when designing the NSOM spectroscopy package is that not one formula will fit all of the requirements. Furthermore, virtually any application will require some special design consideration, so building the system
Figure 8. Typical, third generation commercially available NSOM setup, for imaging and spectroscopy: (a) photo of the NSOM head and sample holder; (b) complete system with attached spectrometer; (c) optical path schematics. (Courtesy of Veeco Instruments Inc., Santa Barbara, CA.)
as versatile and modular as possible is of the utmost importance. The ability to incorporate additional standard optical components and easy system reconfiguration should be first in the designer’s mind. At the same time, once a system is set up for operation, it should allow for easy, straightforward, simple operation, and robustness, which are sometimes contradictory requirements. The design of the NSOM head, when having the spectroscopy package in mind, must incorporate extremely accurate closed-loop scan linearization. While shear-force feedback keeps superb control of sample-tip distance, the closed-loop X–Y scanning is necessary in order to keep the probe at the selected spatial position during sample collection.
The near-field spectroscopy package is an even more promising breakthrough technology for life sciences than for NSOM imaging alone. For the first time, it will allow qualitative identification of the composition of an observed sample, via optical spectroscopies, at the spatial resolution of scanning probe microscopy. The current commercial systems can distinguish differences in chemical composition of the samples, at the spatial resolution of 50 nm or better. For combined near-field spectroscopy and imaging, the signal may be split into the dual-beam path, wherein one path is used for the imaging detector and another one for spectroscopy. Such dual-beam solution minimizes removal, replacement, and realignment of components when a different mode is desired. The benefit is the ease of use and robust, reliable operation for separate or simultaneous transmission and reflection measurements.
In the example of the Aurora-3 optical path system, the light from both objectives is redirected out the side ports by two front-surface mirrors, which are reflection-coated for optimal visible/near-IR (NIR) operation. The near-field transmission and reflection light is collected in the far field by precisely aligned microscope objectives to provide high quality collimated (parallel) beams, with a nominal 7 mm diameter. This system design allows for NSOM spectroscopic operation with standard one-half in. diameter optics, though for ease of alignment and handling, 1 in. diameter optics is generally recommended. Furthermore, the reflection path is carefully aligned to match the transmission path. Such integrated solutions minimize removal, replacement, and realignment of components when a different mode is desired. The integrated reflection path is always available for use with any sample and never requires removal or realignment in the microscope with normal use. As there are many variations in the spectroscopy setup, it is important for an NSOM system that is intended for spectroscopic use to be capable of utilizing the standard optical element, so users can customize the system using standard optical poles and optical bench mounting systems.
Evaluation
While the first NSOM was invented just 2 years after the AFM, its widespread use has just started to pick up in the last several years. The reasons for this lag are severalfold: the first NSOM images were hard to interpret, and as they were achieved without topography modulation, the contrast in the images was not intuitive; there were no com-
MICROSCOPY AND SPECTROSCOPY, NEAR-FIELD |
445 |
mercial instruments available until the mid-1990s, thus all users needed to build their own systems; the use of the home-built and first commercial instrument and its alignment procedures were cumbersome and complicated for any user who was not skilled in optoelectronics development; and the resolution of the systems depended on each individual sample. However, the field is changing rapidly, and with introduction of the latest, third generation of commercial systems (13–16), such as the Aurora-3 from Veeco Instruments Inc., MultiView 400 from Nanonics Imaging Ltd, Smena from NT-MDT, and AlphaSNOM from WiTec GmbH, the ease of use is comparable with the standard scanning probe microscope and is within the skill set of average life sciences user. Furthermore, with improvement in the serial production of the probes and quality control in recent years, the resolution of the NSOM system is becoming more uniform, and resolution expectations can be met with most samples.
The way to evaluate and measure resolution of the NSOM instrument is by utilizing Fisher’s projection masks (35). It is virtually accepted as a standard for evaluating NSOM resolution and quality of image topographic modulation, the latter one by comparing the topographic with the optical image. The Fisher project mask is a regular hexagonal array of metallic spikes (Fig. 9). It is produced by having the monolayer of the monodispersed polymer spheres coated with metallic coating, and the spheres subsequently dissolved with organic solvents. What is left is the regular, closed-packed hexagonal matrix of metallic spikes. In transmission mode, the spike is seen as a dark spot on the optical micrography, while in reflection mode, the spike is a bright spot, and the void space is dark.
The near-field optical imaging obviously provides two great advantages over other types of imaging: its ability to simultaneously acquire topography, in a scanning-force manner, and an optical image. The optical image carries a plethora of different information that can be furthermore extracted. The most important advantage is that there are many different ways to extract direct or indirect information on spatial distribution of chemical composition of the observed sample, even on the single molecular level. Furthermore, at current state-of-the-art commercial NSOM instrumentation, the near-field imaging and spectroscopy can be performed at a resolution at least four times as high as the resolution of the best optical confocal microscopes. The obvious applications in the biomedical field are all of the applications for which the standard confocal and inverted fluorescence microscope is used today, but at the same time, done at much higher resolution (36–40). Examples of life sciences and biomedical applications involve optical ultramicroscopy of cells; optical imaging of cell organelles; imaging and spectroscopy of individual molecules and macromolecules; in vivo tracking of molecular events and endocytosis; and high resolution chromosome labeling [i.e., high resolution fluorescence in situ hybridization (FISH) (39) applications]. Some of these applications, like molecular tracking, and high resolution FISH are unachievable with other methods.
The molecular tracking applications are based on fluorescence, and in the future, Raman SERS applications will revolutionize our way of understanding how cellular

446 MICROSCOPY AND SPECTROSCOPY, NEAR-FIELD
Figure 9. Fisher mask, typical structure for NSOM evaluation and calibration: (a) topographic image produced with shear-force feedback; (b) NSOM transmission mode image of the same area. The images were produced on the Aurora-3 NSOM, (Courtesy of Veeco Instruments Inc., Santa Barbara, CA.)
mechanisms work, and will bring significant contributions to practical pharmacological applications, such as drug candidates, where their target will be able to be imaged, measured, and tracked during action. Additionally, this application will add considerably to the body of knowledge of macromolecular interactions and in the mapping of the interactome of proteins, enzymes, and nucleic acids within the cell. The simplest way will be by expressing differently colored fluorescence proteins, fused with ligand and target, and tracking their spatial positions within the cell, and from the fluorescence resonance energy transfer or fluorescence intermittency, following their interactions. No other method is capable of achieving the resolution necessary to understand molecular machines in vivo. Another futuristic application of NSOM is in the ultrahigh density genomics and proteomics array, which theoretically can be packed at the density range higher than the wavelengths.
Some of the more futuristic life science applications will come with the integration of NSOM with mass spectrometry. Zenobi’s group (25) demonstrated that the apertured NSOM is capable of doing the nanoablation of structures and thus can feed the mass spectrometer with material ablated with the resolution of a few tens of nanometer. This can dramatically improve the knowledge of spatial locations of proteins, and protein–protein complexes and interactions.
The NSOM-based FISH (38) can have a large impact on the future of molecular in vitro diagnostics because it will allow FISH to be applied on the shorter segments of DNA. This will permit many additional applications by painting shorter genes of this simple, chromosome painting technique, which are unachievable with far-field fluorescence or confocal-fluorescence equipment. If designed in a simple and high throughput manner, this may become a standard diagnostic instrument for molecular cytogenetics diagnostics in pathology labs.
It is expected that the next, fourth-generation instrumentation, currently in the design stage, will allow more routine imaging with a level of technical expertise, which is
necessary for practical applications comparable with running today’s confocal microscope.
Examples of the NSOMs biological applications are presented in Fig. 10a–c. Figure 10a is an example of the protein localization imaging beyond diffraction limit. In this particular image, the fibroblast cells were labeled with green fluorescence protein (GFP). The image on the left represents the shear-force micrography, which corresponds to the topographic image, while the image on the right is the GFP fluorescence image. Spatial distribution of the GFP can easily be observed within the cell at a resolution far exceeding the diffraction limits. This technique can be used to track the protein synthesis and trafficking within the cell if the targeted protein is fused with the fluorescence label, such as GFP or YFP. Another unique NSOM application is in optical characterization of the supramolecular and macromolecular assemblies. Figure 10b represents topographic, shear force (left) and NSOM transmission image (right) of the interband region of a polytene chromosome. In the optical image, the chromatin matter can be distinguished from the DNA based on the optical contrast, which is not possible based on the pure topography. Finally, Fig. 10c represents far-field optical transmission image of slice of the muscle tissue (left) and shear-force topography and near-field optical image, on the right top and bottom, respectively. The near-field imaging reveals the fine structure of the muscular fiber, its cell membrane, myofibrils, and endoplasmatic reticulum structure, in a similar manner as using the transmission electron microscopy.
Besides imaging, the near-field optical microscopy-like setup has promise for use in the nanoscale lithography (41), and for high density data storage (42). Nanoscale lithography will have applications in the preparation of tissue growth matrix and scaffolds, especially for the growth of neurons, while the high voluminous data storage will have a plethora of medical applications for storing ever-growing informational content of both imaging and high throughput diagnostics data.
In conclusion, near-field optical imaging is still a developing technique that shows much promise for biomedical

MICROSCOPY AND SPECTROSCOPY, NEAR-FIELD |
447 |
Figure 10. Examples of biomedical and life-sciences applications of NSOM imaging: (a) Shear-force topography and near-field fluorescence from GFPlabeled fibroblast cells. Images of the fibrorblast cells are prepared by growing them directly on glass cover slides and subsequent labeling. They are imaged in air at a scan speed of 1 Hz, no photodegradation was observed throughout the measurement. (Courtesy of Renato Zenobi, ETH, Zurich, # Renato Zenobi and ETH Zurich, Switzerland). (b) Shear force and NSOM image of the interband region of a polytene chromosome. (Courtesy of Sid Ragona and Phil Haydon, Laboratory of Cellular Signaling, Dept. of Zoology and Genetics, Iowa State University, Ames, IA, and Veeco Instruments Inc.). (c) Farfield, differential contrast optical microscopy of the muscle tissue, and details of the muscle cell by shear force andNSOM.(CourtesyofSidRagonaand Phil Haydon, Laboratory of Cellular Signaling, Department of Zoology and Genetics, Iowa State University, Ames, IA and Veeco Instruments Inc.)
448 MICROSCOPY AND SPECTROSCOPY, NEAR-FIELD
applications. This review presents the state-of-the-art NSOM technology up to the second quarter of 2005. It is certain that by the time of the next edition of this Encyclopedia, there will be many other technological and advancements in the field of biomedical applications of near-field optics.
BIBLIOGRAPHY
1.Abbe E. Beitrsge zur theorie des mikroskops und mikroskopichen wahrnehmung. Arch Mikroskop Anat 1873;9:413.
2.Synge EH. A suggested method for extending the microscopic resolution into the ultramicroscopic region. Phil Mag 1928;6: 356–362.
3.Synge EH. An application of piezoelectricity to microscopy. Phil Mag 1932;13:297–300.
4.O’Keefe JA. Resolving power of visible light. J Opt Soc Am 1956;46:359–362.
5.Ash A, Nichols G. Super-resolution aperture scanning microscope. Nature London 1972;237:510–511.
6.Pohl DW, Denk W, Lanz M. Optical stethoscopy—Image recording with resolution lambda/20. Appl Phys Lett 1984;44: 651–653.
7.Lewis A, Isaacson M, Harootunian A, Murray A. Development of 500A spatial-resolution light-microscope. 1. Light is efficiently transmitted through gamma-16 diameter apertures. Ultramicroscopy 1984;13:227–231.
8.Rasmussen A, Deckert V. New dimension in nano-imaging: breaking through the diffraction limit with scanning near-field optical microscopy. Anal Bioanal Chem 2005;381:165–172.
9.Edidin M. Near-field scanning optical microscopy, a siren call to biology. Traffic 2001;2:797–803.
10.Dunn RC. Near-field scanning optical microscopy. Chem Rev 1999;99:2891–2899.
11.Micic M. Near-field scanning optical microscopy and spectroscopy advance. Photonics Spectra 2005;38:124–125.
12.De Serio M, Zenobi R, Deckert V. Looking at the nanoscale: scanning near-field optical microscopy. TRAC-Trends Anal Chem 2003;22:70–77.
13.Product info: Aurora-3 NSOM , Veeco Instruments Inc., Santa Barbara, CA. Available at http://www.veeco.com.
14.Product info: Multiview Series, Nanonics Imaging Ltd., Jerusalem, Israel. Available at http://www.nanonics.co.il.
15.Product info: Alpha SNOM, Witec Wissenschaftliche Instrumente und Technologie. Available at GmbH GmbH,Ulm, Germany, http://www.witec.de.
16.Product info: Solver SNOM, NT-MDT Co, Zelenogorod, Russia. Available at http://www.ntmdt.ru.
17.Paesler MA, Moyer P. Near-Field Optics Theory, Instrumentation and Applications. New York: John Wiley & Sons; 1996.
18.Curie P, Curie J. Developement, par pression de l’electricite polaire dans les cristaux hemiedres a faces inclinees. Comp Ren 1880;91:291–295.
19.Spanner K. Micro Positioning, Nano Positioning, Nano Automation: Solution for Cutting Edge Technologies (product catalog), Karslruhe, Physik Instrumente (PI) GmbH & Co KG. Available at http://www.pi.ws. Accessed 2005.
20.Betzig E, Finn PL, Weiner JS. Combined shear force and near-field scanning optical microscope. Appl Phys Lett 1992;60: 2484–2486.
21.Garcia-Parajo M, Tate T, Chen Y. Gold-coated parabolic tapers for scanning near-field optical microscopy: Fabrication and optimisation. Ultramicroscopy 1995;61:155–163.
22.Pangaribuan T, et al. Reproducible fabrication technique of nanometric tip diameter fiber probe for photon scanning tunneling microscope. Jpn J Appl Phys 1992;31:L1302– L1304.
23.Radojewski R, Grabijec P. Combined SNOM/AFM microscopy with micromachined nanoapertures. Mater Sci–Poland 2003;21:321–332.
24.Takahashi S, Dickson W, Pollard R, Zaytas A. Near-field magneto-optical analysis in reflection mode SNOM. Ultramicroscopy 2004;100(3–4):443–447.
25.Stockle R, et al. Nanoscale atmospheric pressure laser ablation mass spectrometry. Anal Chem 2001;73:139–1402.
26.Chovin A, Garrigue P, Servant L, Sojic N. Electrochemical modulation of remote fluorescence imaging at an ordered opto-electroche- mical nanoaperture array. Chemphyschem 2004;5:1125–1132.
27.Inoye Y, Kawata S. Near-field scanning optical microscope with a metallic probe tip. Opt Lett 1994;19:159–161.
28.Keilmann F, Hillenbrand R. Near-field microscopy by elastic light scattering from a tip. Philas Trans R Soc Sci A 2004;362:787–805.
29.Hu DH, et al. Correlated topographic and spectroscopic imaging beyond diffraction limit by atomic force microscopy metallic tip enhanced near-field fluorescence lifetime microscopy. Rev Sci Instr 2003;74:3347–3355.
30.Micic M, Klymyshin N, Suh YD, Lu HP. Finite element method simulation of the field distribution for AFM tip enhanced surface enhanced Raman scanning microscopy. J Phys Chem B 2003;107:1574–1584.
31.Sun WX, Shen ZX. Near-field scanning Raman microscopy using apertureless probes. J Raman Spectrosc 2003;34:668–676.
32.Richards D. Near-field microscopy: Throwing light on the nanoworld Philas Trans R Soc Sci A 2003;361:2843–2857.
33.Vanden Bout DA, Kerimo J, Higgins DA, Barbara PF. Spatially Resolved Spectral Inhomogeneities in Small Molecular Crystals Studied by Near Field Scanning. Opt Microsc J Phys Chem 1996;100:11843–11850.
34.Puestow R. Configuring Aurora-3 for Spectroscopy, application note, Veeco Instruments Inc, Santa Barbara, CA, 2003.
35.Fischer UC, et al. Latex bead projection nanopatterns. Surf Interface Anal 2002;33:75–80.
36.de Lange F, et al. Cell biology beyond the diffraction limit: Nearfield scanning optical microscopy. J Cell Sci 2001;114: 4153–4160.
37.Subramaniam V, Kirsch AK, Jovin TM. Cell biological applications of scanning near-field optical microscopy (SNOM). Cell Molec Biol 1998;44:689–700.
38.Lewis A, et al. Near-field scanning optical microscopy in cell biology. Trends Cell Biol 1999;9:70–73.
39.Fukushi D, et al. Scanning near-field optical/atomic force microscopy detection of fluorescence in situ hybridization signals beyond the optical limit. Exp Cell Res 2003;289:237–244.
40.Krishnan RV, Varma R, Mayor S. Fluorescence methods to probe nanometer-scale organization of molecules in living cell membranes. J Fluoresc 2001;11:211–226.
41.Dryakhulshin VF, Klimov AY, Rogov VV, Vostkov NV. Nearfield optical lithography method for fabrication of nanodimensional objects. Appl Surf Sci 2005;248:200–203.
42.Ferri V, et al. Near-field optical addressing of luminescent photoswitchable supramolecular system embedded in inert polymer matrices. Nano Lett 2004;4:835–859.
Further Reading
Prasad PN. Nanophotonics. New York: John Wiley & Sons; 2004. Courion D. Near Field Microscopy and Near Field Optics. London:
Imperial College Press; 2003.
Paul DW, Courion D. Near Field Optics. Arc-et Senans: Kulwer Academic Publisher; 1993.
Taatjes DJ, Brooke MT. Cell Imaging Techniques: Methods and Protocolos. Totowa: Humana Press; 2005.
See also MICROSCOPY, CONFOCAL; MICROARRAYS; NANOPARTICLES.