

- •VOLUME 4
- •CONTRIBUTOR LIST
- •PREFACE
- •LIST OF ARTICLES
- •ABBREVIATIONS AND ACRONYMS
- •CONVERSION FACTORS AND UNIT SYMBOLS
- •HYDROCEPHALUS, TOOLS FOR DIAGNOSIS AND TREATMENT OF
- •HYPERALIMENTATION.
- •HYPERBARIC MEDICINE
- •HYPERBARIC OXYGENATION
- •HYPERTENSION.
- •HYPERTHERMIA, INTERSTITIAL
- •HYPERTHERMIA, SYSTEMIC
- •HYPERTHERMIA, ULTRASONIC
- •HYPOTHERMIA.
- •IABP.
- •IMAGE INTENSIFIERS AND FLUOROSCOPY
- •IMAGING, CELLULAR.
- •IMAGING DEVICES
- •IMMUNOLOGICALLY SENSITIVE FIELD–EFFECT TRANSISTORS
- •IMMUNOTHERAPY
- •IMPEDANCE PLETHYSMOGRAPHY
- •IMPEDANCE SPECTROSCOPY
- •IMPLANT, COCHLEAR.
- •INCUBATORS, INFANTS
- •INFANT INCUBATORS.
- •INFUSION PUMPS.
- •INTEGRATED CIRCUIT TEMPERATURE SENSOR
- •INTERFERONS.
- •INTERSTITIAL HYPERTHERMIA.
- •INTRAAORTIC BALLOON PUMP
- •INTRACRANIAL PRESSURE MONITORING.
- •INTRAOCULAR LENSES.
- •INTRAOPERATIVE RADIOTHERAPY.
- •INTRAUTERINE DEVICES (IUDS).
- •INTRAUTERINE SURGICAL TECHNIQUES
- •ION-EXCHANGE CHROMATOGRAPHY.
- •IONIZING RADIATION, BIOLOGICAL EFFECTS OF
- •ION-PAIR CHROMATOGRAPHY.
- •ION–SENSITIVE FIELD-EFFECT TRANSISTORS
- •ISFET.
- •JOINTS, BIOMECHANICS OF
- •JOINT REPLACEMENT.
- •LAPARASCOPIC SURGERY.
- •LARYNGEAL PROSTHETIC DEVICES
- •LASER SURGERY.
- •LASERS, IN MEDICINE.
- •LENSES, CONTACT.
- •LENSES, INTRAOCULAR
- •LIFE SUPPORT.
- •LIGAMENT AND TENDON, PROPERTIES OF
- •LINEAR VARIABLE DIFFERENTIAL TRANSFORMERS
- •LITERATURE, MEDICAL PHYSICS.
- •LITHOTRIPSY
- •LIVER TRANSPLANTATION
- •LONG BONE FRACTURE.
- •LUNG MECHANICS.
- •LUNG PHYSIOLOGY.
- •LUNG SOUNDS
- •LVDT.
- •MAGNETIC RESONANCE IMAGING
- •MAGNETOCARDIOGRAPHY.
- •MANOMETRY, ANORECTAL.
- •MANOMETRY, ESOPHAGEAL.
- •MAMMOGRAPHY
- •MATERIALS, BIOCOMPATIBILITY OF.
- •MATERIALS, PHANTOM, IN RADIOLOGY.
- •MATERIALS, POLYMERIC.
- •MATERIALS, POROUS.
- •MEDICAL EDUCATION, COMPUTERS IN
- •MEDICAL ENGINEERING SOCIETIES AND ORGANIZATIONS
- •MEDICAL GAS ANALYZERS
- •MEDICAL PHOTOGRAPHY.
- •MEDICAL PHYSICS LITERATURE
- •MEDICAL RECORDS, COMPUTERS IN
- •MICROARRAYS
- •MICROBIAL DETECTION SYSTEMS
- •MICROBIOREACTORS
- •MICRODIALYSIS SAMPLING
- •MICROFLUIDICS
- •MICROPOWER FOR MEDICAL APPLICATIONS
- •MICROSCOPY AND SPECTROSCOPY, NEAR-FIELD
- •MICROSCOPY, CONFOCAL
- •MICROSCOPY, ELECTRON
- •MICROSCOPY, FLUORESCENCE
- •MICROSCOPY, SCANNING FORCE
- •MICROSCOPY, SCANNING TUNNELING
- •MICROSURGERY
- •MINIMALLY INVASIVE SURGICAL TECHNOLOGY
- •MOBILITY AIDS
- •MODELS, KINETIC.
- •MONITORING IN ANESTHESIA
- •MONITORING, AMBULATORY.
- •MONITORING, FETAL.
- •MONITORING, HEMODYNAMIC
- •MONITORING, INTRACRANIAL PRESSURE
- •MONITORING, NEONATAL.
- •MONITORING, UMBILICAL ARTERY AND VEIN
- •MONOCLONAL ANTIBODIES
- •MOSFET.
- •MUSCLE ELECTRICAL ACTIVITY.
- •MUSCLE TESTING, REHABILITATION AND.
- •MUSCULOSKELETAL DISABILITIES.
15.Yli-Hankala A, et al. Epileptiform electroencephaogram during mask induction of anesthesia with sevoflurane. Anesthesiology 1999;91:1596–1603.
16.Vakkuri A. Effects of Sevoflurane Anesthesia on EEG Patterns and Hemodynamics. Ph.D. dessertation, University of Helsinki, Finland, 2000.
17.Thornton C, et al. The auditory evoked response as an indicator of awareness. Br J Anaesthology 1989;63:113–115.
18.Yppa¨rila¨ H. Depth of Sedation in Intensive Care Patients: A Neurophysiological Study. Ph. D. Dessertation, University of Kuopio, Finland, 2004.
19.Paloheimo M. Quantitative surface electromyography (qEMG): Applications in anaesthesiology and critical care, Ph. D. dissertation Acta Anaesthesiology; Scandinavian. Copenhagen. Munksgaard; 1990; Vol. 34, (Suppl. 93),.
20.Wang DY, Pomfrett CJD, Healy TEJ. Respiratory sinus arrhythmia: A new, objective sedation score. Br J Anaesthology 1993;71:354–358.
21.Maynard D. Development of the CFM: The cerebral function analyzing monitor (CFAM). Ann Anaesthology Francaise 1979;20:253–255.
22.Edmonds HL, Paloheimo M. Computerized monitoring of the EMG and EEG during anesthesia. An evaluation of the anesthesia and brain activity monitor (ABM). Int J Clin Monit Comp 1985;1:201–210.
23.Thomsen CE, Rosenfalck A, Norregaard-Christensen K. Assessment of anaesthetic depth by clustering analysis and autoregressive modeling of electroencephalograms. Comput Methods Progr Biomed 1991;34:125–138.
24.Rampil IJ. A primer for EEG signal processing in anesthesia. Anesthesiology 1998;89:980–1002.
25.Nikias CL, Petropulu AP. Higher Order Spectra Analysis. Englewood Cliffs (NJ): PTR Prentice Hall; 1993.
26.Drover DR, et al. Patient State Index: Titration of delivery and recovery from propofol, alfentanil, and nitrous oxide anesthesia. Anesthesiology 2002;97:82–89.
27.Schultz B, Schultz A, Grouven U. Sleeping stage based systems (Narcotrend). In : Bruch HP. et al., editors. New Aspects of High Technology in Medicine 2000. Bologna: Monduzzi Editore; 2000:285–291.
28.Grouven U, Beger RA, Schultz B, Schultz A. Correlation of Narcotrend Index, entropy measures, and spectral parameters with calculated propofol effect-site concentrations during induction of propofol-remifentanil anesthesia. J Clin Monit Comput 2004;18:231–240.
29.Viertio¨-Oja H, et al. Description of the EntropyTM algorithm as applied in the Datex–Ohmeda S/5–Entropy Module. Acta Anaesthesiol Scand 2004;48:154–161.
30.Jensen EW, Lindholm P, Henneberg SW. Autoregressive modeling with exogenous input of middle latency auditoryevoked potentials to measure rapid changes in depth of anesthesia. Methods Inf Med 1996;35:256–260.
31.Litvan H, et al. Comparison of conventional averaged and rapid averaged, autoregressive-based extracted auditory evoked potentials for monitoring the hypnotic level during propofol induction. Anesthesiology 2002;97:351–358.
32.Wong CA, Fragen RJ, Fitzgerald PC, McCarthy RJ. The asso-
ciation between propofol-induced loss of consciousness and the SNAPTM index. Anesthology Analg 2005;100:141–148.
33.Grassberger P, Procaccia I. Measuring the strangeness of strange attractors. Phys D 1983;9:189–208.
34.Widman G, et al. Quantifcation of depth of anesthesia by nonlinear time series analysis of brain electrical activity. Phys Rev E 2000;62:4898–4903.
35.Zhang XS, Roy RJ, Jensen EW. EEG Complexity as a measure of depth of anesthesia for patients. IEEE Trans Biomed Eng Dec 2001;48(12):1424–1433.
MONITORING, HEMODYNAMIC |
565 |
36.Bruhn J, Ro¨pcke H, Hoeft A. Approximate entropy as an electroencephalographic measure of anestetic drug effect during desflurane anesthesia. Anesthesiology 2000;92:715–726.
37.Bouillon TW, et al. Pharmacodynamic interaction between propofol and remifentanil regarding hypnosis, tolerance of laryngoscopy, bispectral index, and electroencephalographic approximate entropy. Anesthesiology 2004;100:1353–1372.
38.Shannon CE. A mathematical theory of communication. Bell System Tech J 1948;27:379–423.
39.Bruhn J, et al. Shannon entropy applied to the measurement of the electroencephalographic effects of desflurane. Anesthesiology 2001;95:30–35.
40.Anier A, Lipping T, Melto S, Hovilehto S. Higuchi fractal dimension and spectral entropy as measures of depth of sedation in intensive care unit. Proceedings of the 26-th IEEE EMBS Annual International Conference (EMBC’04), San Francisco; Sept. 2004; pp. 526–529.
41.Lempel A, Ziv J. On the complexity of finite sequences. IEEE Trans Infor Theory 1976;IT–22:75–81.
42.Higuchi T. Approach to an irregular time series on the basis of the fractal theory. Phys D 1998;31:277–283.
43.Jordan KG. Continuous EEG monitoring in the neuroscience intensive care unit and emergence department. J Clin Neurophysiol 1999;16:14–39.
44.Scheuer ML, Wilson SB. Data analysis for continuous EEG monitoring in the ICU: seeing the forest and the trees. J Clin Neurophysiol 2004;21:353–378.
45.Ja¨ntti V, Mustola S, Huotari AM, Koskinen M. The importance of looking at the EEG when presenting uivariate variables to describe it. Br J Anaesth 2002;88:739.
46.Hirsch LJ. Continuous EEG monitoring in the intensive care unit: an overview. J Clin Neurophysiol 2004;21:332–340.
47.Kern SE, X Gie, White JL, Egan TD. Opioid-hypnotic synergy. Anesthesiology 2004;100:1373–1381.
48.Schultz B, et al. Der Narcotrend Monitor: Entwicklung und Interpre-tationsalgorithmus. Anaesthesist 2003;52:1143–1148.
See also ANESTHESIA MACHINES; BLOOD PRESSURE MEASUREMENT; ELECTROENCEPHALOGRAPHY; OXYGEN ANALYZERS; SAFETY PROGRAM, HOSPITAL;
TEMPERATURE MONITORING.
MONITORING, AMBULATORY. See AMBULATORY
MONITORING.
MONITORING, FETAL. See FETAL MONITORING.
MONITORING, HEMODYNAMIC
REED M. GARDNER
LDS Hospital and Utah
University
Salt Lake City, Utah
INTRODUCTION
The word monitor has a variety of meanings, depending on the context. A monitor can be any device for checking on or regulating the performance of a machine, aircraft, or a patient. A patient monitor is usually thought of as something that watches, warns, or cautions if there is a lifethreatening event. A more rigorous definition of patient monitoring is Repeated or continuous observations or

566 MONITORING, HEMODYNAMIC
measurements of the patient, his or her physiological status, and the functions of life support equipment for the purpose of guiding management decisions, including when to make therapeutic interventions and assessment of those interventions (1). As a result, a monitor should not only alert physicians and nurses to potentially lifethreatening events, but perhaps should also control devices that maintain life. The primary emphasis of this section deals with hemodynamic monitoring of the critically ill patient who is in an intensive care unit (ICU), but many of the principles apply to all hospitalized patients.
Hemodynamic monitoring relates to monitoring of the blood pressure and blood flow in the cardiovascular system. The cardiovascular system consists of the heart, lungs, and blood vessels, and has a most important function in maintaining life in complex animals, such as humans. Oxygen and fuel must be transported from their source to the individual cells that consume them. The resulting waste products of metabolism must then be disposed of. Thus, the heart and blood vessels transport nutrients to the body and remove the waste products. Clearly, if this system does not function properly, the organism could be compromised. As a consequence clinically applicable methods have been developed to assess the function of the cardiovascular system. Hemodynamic monitoring is one part of this complex monitoring strategy. Typical parameters measured when performing hemodynamic monitoring are heart rate and rhythm, measured through analysis of the electrocardiogram (ECG), blood pressure measurements in various locations in the cardiovascular system, and estimates of blood flow usually using cardiac output as a measure.
THEORY
Hemodynamic monitoring permits minute-to-minute surveillance of the cardiovascular system and provides physiologic data to assist in diagnosis as well as to guide therapy (2–5). The cardiovascular system consists of the heart, lungs, and blood vessels that supply blood to the body and return blood from the peripheral tissue.
It is beyond the scope of this section to describe the detailed anatomy of the cardiovascular system. However, to understand the principles of hemodynamic monitoring knowledge of the functional aspects of the cardiovascular system is essential.
HEART
The heart is made up of four chambers: the right atrium and the right ventricle and the left atrium and the left ventricle (see Fig. 1). The right atrium accepts blood from the systemic circulation (head, arms, and legs) via the superior and inferior vena cava. On atrial contraction the tricuspid valve between the right atrium and right ventricle opens and blood flows into the right ventricle. On ventricular contraction the right ventricle pumps blood through the pulmonic valve into the pulmonary artery and to the lungs where oxygen is added and carbon dioxide is removed. Blood flows from the lungs to the pulmonary veins and then into the left atrium. On atrial contraction
SP
MP
DP
ARTERIAL
SP = 90 to 150 mmHg
DP = 60 to 80 mmHg
MP = 70 to 90 mmHg
RIGHT ATRIUM (RA)
MP = 2 to 6 mmHg
RIGHT VENTRICLE (RV)
(RV)
SP = 20 to 30 mmHg END DP = 2 to 6 mmHg
PULMONARY ARTERY
SP = 20 to 30 mmHg
DP = 8 to 12 mmHg
WEDGE = 6 to 12 mmHg
LEFT ATRIUM (LA)
MP = 6 to 12 mmHg
LEFT VENTRICLE (LV)
SP = 90 to 50 mmHg END DP = 6 to 12 mmHg
Figure 1. Outline drawing of the heart with its chambers and typical pressures (expressed in mmHg) for each area of the heart. Note the pressures are systolic (SP), diastolic (DP), and mean (MP), as shown on the arterial pressure waveform.
the blood flows into the left ventricle through the mitral valve. On ventricular contraction the left ventricle pumps blood through the aortic valve to the systemic circulation (aorta and the systemic vasculature).
The basic contractile element of the heart is the sarcomere, which is composed of myofilaments, contractile proteins that interdigitate and slide along one another during contraction. Shortening of the sarcomere is the functional unit of heart contraction. Physiologic and pharmacologic agents can change the contractile characteristics of the sarcomeres. Rate and contractility of the heart are controlled by sympathetic and parasympathetic innervation, as well as circulating catecholamines.
Control of Heart Performance
Mechanisms regulating cardiac (heart) output involve not only factors controlling performance of the heart as a pump, but also factors affecting the systemic vascular system and its resistance. Typically, the heart can increase its output to a level of almost five times its resting value. There are two methods by which the heart regulates its cardiac output in response to stress, injury, or disease: by changing heart rate and stroke volume.
Heart Rate Control
Heart rate can be changed rapidly and is thus one of the most effective ways for the heart to change its cardiac output. For a healthy person, an increase in heart rate can more than double the cardiac output when the heart rate increases to near 180 beats min 1. However, if a patient with heart disease increases their heart rate to >120 beats min 1 they may have deleterious responses because of the increased demand for oxygen by the heart muscle. Blood flow in the heart muscle occurs primarily

during diastole (the relaxation phase of heart contraction). Increasing heart rate decreases the time for cardiac circulation during diastole. In normal subjects, decreasing the heart rate to 50 beats min 1 may not decrease cardiac output because there is increased diastolic filling time that increases stroke volume.
Stroke Volume Changes
The stroke volume of an intact ventricle is influenced by (1) ventricular end-diastolic volume (called preload), (2) ventricular afterload, and (3) contractility.
Preload. Preload is the term used to define the enddiastolic stress in the wall of the ventricle. For example, zero preload would result in the ventricle ejecting no blood. However, with increased preload, ventricular ejection generally increases linearly until the capacity of the pump (heart) is exceeded. Since the end-diastolic volume so profoundly influences the myocardial fiber length it has a great influence on the myocardial performance. The Frank–Starling law describes this principle and is illustrated graphically in Fig. 2. The most accessible measure of right ventricular preload is the right atrial pressure. Left atrial pressure is used to estimate left ventricular preload. Since the left ventricle does most of the work of the heart, it is usually the first part of the heart muscle to fail. Consequently, the measurement or estimation of the left atrial pressure is important in assessing a patient’s hemodynamic status.
Afterload. Afterload is a measure of the impedance (resistance) against which the right or left ventricles must
HYPERDYNAMIC
INDEXCARDIAC |
NORMAL |
|
FAILURE
PULMONARY WEDGE PRESSURE
Figure 2. Frank–Starling curve of the heart showing the ventricular performance (cardiac index) plotted against the enddiastolic volume typically estimated by using pulmonary artery wedge pressure. Note to the right of these curves, there is a pulmonary wedge pressure above which the heart in ineffective in producing increased flow.
MONITORING, HEMODYNAMIC |
567 |
eject blood. Resistance (R) is calculated by measuring blood flow and pressure and then using Ohm’s law {Eq. 1}.
R ¼ |
mean blood pressure |
(1) |
cardiac output |
Systemic Circulation
Blood flow to the periphery of the body is controlled by local autoregulation and by the autonomic nervous system. Local autoregulation of blood flow helps tissue meet its oxygen requirements. For example, with decreased blood flow, metabolic byproducts increase, causing local vasodilatation that tends to increase blood flow. There are baroreceptors, similar to blood pressure transducers, located in the aortic arch and the carotid sinus which sense blood pressure. Via the baroreceptor reflex mechanism, the body regulates the blood pressure. In addition, chemoreceptors in the carotid sinus and other locations regulate respiration by responding to changes in CO2 and O2.
Pulmonary Circulation
The pulmonary arterial vessels differ markedly from systemic arterial vessels; they have thinner walls, less muscle, and have a resistance to blood flow about one-sixth that of the systemic circulation.
Contractility. Contractility is a measure of how a healthy heart performs. A healthy heart pumps vigorously and nearly empties its ventricles with each beat and is said to have excellent contractility. On the other hand, a compromised heart may not be able to empty effectively.
HEMODYNAMIC MONITORING
Bedside hemodynamic monitoring makes use of data gathering procedures that were formerly only done in diagnostic cardiac catheterization laboratories. Understanding the relationship between the pressure and blood flow in the cardiovascular system is the primary reason for performing hemodynamic monitoring. The cardiovascular system responds to many and varied stimuli and can be affected by physical conditioning, drugs, disease, blood loss, injury, and myocardial insult such as a heart attack. Because of the complexity of factors controlling the body, it is necessary to make hemodynamic measurements on the system to understand disease processes and provide optimum therapy to the patient.
Electrocardiogram
Electrocardiogram (ECG) monitoring is used to determine heart rate and detect arrhythmias, pacemaker function, and myocardial ischemia (lack of blood flow to the heart muscle). To permit optimum ECG monitoring the signal quality must be excellent (6). Since the ECG electrical signal from the heart is only 0.5–2.0 mV at the skin’s surface, it is best measured by properly preparing the skin and optimally placing the electrodes. Skin can be properly prepared by removing oil from the surface and abrading the skin to remove the dry dead outer layer (stratum
568 MONITORING, HEMODYNAMIC
granulosum). In 90% of patients, proper skin preparation reduces electrode resistance from as high as 200 to as low as 10 kV. Good electrode placement allows the electrodes to receive the maximum ECG signal with minimum noise. By placing the electrodes over bony prominence, such as the sternum or clavicles, muscle artifact (EMG) can be reduced. Motion artifact caused by movement of electrodes can be minimized not only by proper skin preparation, but also by taping a strain-relieving loop in the lead wires to prevent movement artifact. Shielded wire on the ECG leads helps minimizes pickup of alternating current (ac) electrical fields from 60 Hz power sources, electrosurgical units, and other sources like radio transmitters. The two leads that connect the patient form a loop through which magnetic fields pass and can induce unwanted voltages. Pickup from magnetic fields can be minimized by decreasing the loop area, by keeping the lead wires close together (usually twisted pairs), and by avoiding draping the lead wires over motors, lights, or other electrically powered instruments.
Electrocardiogram Arrhythmia Monitoring
Early in the development of monitoring techniques, the application of computer technology to detect patterns of the electrocardiogram caught the attention of those who sought to improve care of the critically ill. The computer appeared to be a logical candidate for relieving the nursing and medical staff of the tedious chore of continuously visually monitoring a multichannel oscilloscope.
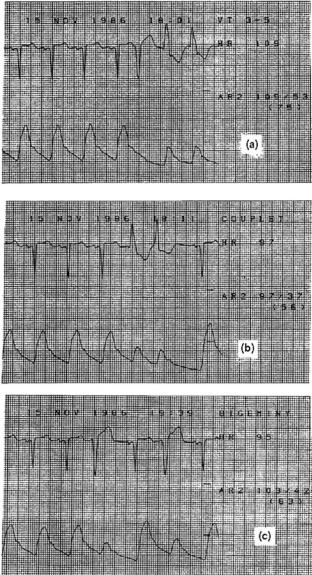
Arrhythmia monitoring is one of the most sophisticated of the bedside monitor’s tasks. People-based arrhythmia monitoring is expensive and unreliable, and those who do it find the task to be tedious and stressful. Today virtually every bedside monitor has rhythm monitoring built in. These monitors use computers and a variety of algorithms to detect and classify ECG rhythm abnormalities. Classifying these rhythm abnormalities is important to hemodynamic monitoring since irregular rhythms can cause dramatic inefficiencies in how the heart works as a pump. For example, Fig. 3 shows three strip recordings of the ECG and the corresponding pressure waveform from three different arrhythmias (ventricular tachycardia, couplet, which is two beats of abnormal electrical origin, and bigeminy where every other beat is from abnormal electrical origin). Note that several of the abnormal beats are hardly effective at creating any change in the arterial pressure. Those same beats deliver small stroke volumes to the patient’s systemic circulation. As a consequence, one cannot assume that the cardiac output remains constant or increases just because the heart rate increases.
MEASUREMENTS
Blood Pressure Monitoring
Arterial blood pressure can be measured by both direct and indirect methods. However, central venous pressure (CVP), pulmonary artery (PA), and pulmonary capillary wedge pressure (PCWP) used to estimate left atrial pressure, at present, can only be measured by direct invasive methods.
Figure 3. Electrocardiogram and arterial pressure waveforms with three different abnormal rhythms. (a) Ventricular tachycardia (VT), which occurs during the last two beats of the strip.(b) Couplets where two successive beats have an abnormal electrical origin. (c) Bigeminy where every other beat is from an abnormal electrical origin. Pressures are expressed in millimeters of mercury. For example, the patient in (a) has a systolic arterial pressure of 109 mmHg, a diastolic pressure of 53 mmHg, and a mean arterial pressure of 75 mmHg.
Arterial Blood Pressure: Indirect Measurement; Using a Cuff. Recently, the American Heart Association has updated its recommendations on accurate ‘‘indirect’’ measures of blood pressure (7). The update reports that the auscultatory technique with trained observer and mercury manometer continues to be the method of choice for measurement of a patient’s blood pressure in a physician’s office. The report also suggests that hybrid devices that use electronic transducers rather than mercury have promise. The report indicates that oscillometric devices can also be used, but only after careful validation.

Unfortunately, the indirect measurement of arterial pressure has serious limitations for patients in shock usually signaled by low blood pressure. Also, since virtually all reliable indirect pressure measurement techniques require cuff inflation, such measurements can only be made intermittently.
Direct Blood Pressure Measurements. The direct measurement of blood pressure allows for continuous and accurate assessment of blood pressures. Direct and continuous pressure monitoring allows detection of dangerous hemodynamic events and provides the information necessary to initiate and regulate patient therapy to prevent catastrophic events. However, monitoring of pressures provides valuable information only when it is obtained in a technically satisfactory manner.
To accomplish direct blood pressure measurements, it is necessary to insert a catheter directly into the cardiovascular system (8). This invasive technique has risks that must be weighted against the benefits that can be obtained. These risks include, infection, blood loss, insertion site damage and other factors (9,10). For many patients who are in shock or who have cardiac disease, the benefits far outweigh the risks. Formal methods for assessing these risks have been published by the Coalition for Critical Care Excellence (11).
Blood pressure can be measured on both the pulmonary (right heart) and systemic (left heart) sides of the circulatory
MONITORING, HEMODYNAMIC |
569 |
system. Measurements of both pulmonary and systemic parameters yield different and important cardiovascular status. The CVP reflects the patient’s circulating blood volume or venous tone, and right atrial and ventricular pressures (right ventricular preload). To measure the right atrial pressure accurately a catheter must be placed in a major vein within the chest or directly in the right atrium. The CVP values fluctuate about atmospheric pressure. The level of the right heart is usually taken as the zero reference point from which all other blood pressures are measured. The CVP gives an indication of only the function of the right heart, and not left heart’s performance.
To measure the left atrial pressure, it is necessary to place a catheter tip through the atrial septum from the right atrium (usually done only with fluoroscopic control in the cardiac catheterization laboratory) or estimating it by placing a pulmonary artery (Swan–Ganz) catheter in the wedged position by inflating its balloon near the catheter tip.
EQUIPMENT
Components of Direct Pressure Monitoring Systems
The components of a direct blood pressure monitoring system for critically ill patients are shown in Fig. 4 (6,8). The components numbered 1–7 in the figure are known as
Figure 4. The 10 components used to monitor direct blood pressure. The monitoring components are nearly independent of whether the catheter is in an artery (radial, brachial, or femoral) or in the pulmonary artery. Size of transducer and plumbing components are enlarged for illustration purposes. [Reproduced from Ref. 6, with permission.]
570 MONITORING, HEMODYNAMIC
the ‘‘plumbing’’ system and must always be sterile because the fluid contained therein comes in direct contact with the patient’s blood. Today virtually all of these components are disposable or single-use items to minimize patient infection. Components 8–11 in Fig. 4 are used for processing and displaying pressure waveforms and derived hemodynamic parameters.
1. Catheter. Arterial and pulmonary artery catheters provide access to the patient’s blood vessels to
(a) monitor intravascular pressure and (b) provide a site for samples for blood to allow determination of blood gas and other laboratory testing parameters. These catheters are typically placed by the percutaneous method, either by the Seldinger ‘‘over-the-needle’’ technique or by introducing the catheter through a needle (8).
2.Sampling stopcock. Stopcock 1 is used as a site for withdrawing blood for analysis. When filling the catheter-tubing-transducer system with fluid, precautions must be taken to be sure all central switching cavities of the stopcock are filled and that entrapped air bubbles are removed. Because stopcocks are especially vulnerable sources of patient contamination, these devices must be handled with extreme care; ports not in active use should be covered with sterile caps and medical personnel should never touch open ports of the stopcocks.
3.Pressure tubing. The catheter and stopcock are normally attached to a continuous flush device and transducer by noncompliant pressure tubing. To optimize the dynamic response of the catheter-tubing-transducer system, long lengths of tubing must be avoided.
4.Stopcock 2. This stopcock is usually put in place to allow disconnection of the flush device and transducer from the patient when the patient is moved or when initially filling the system with fluid.
5.Continuous flush device. This device is used not only when initially filling the pressure monitoring system, but also to help prevent blood from clotting in the
catheter. These devices provide a ‘‘continuously flush’’ of fluid at a rate of from 1 to 3 mL h 1.
6,7. Transducer dome and Pressure transducer. Today virtually all transducers used for monitoring are highly reliable, standardized, disposable devices (12,13).
8.Amplifier system. The output voltage required to drive an oscilloscope or strip-chart recorder is provided by an amplifier system inserted between the transducer and display. Pressure transducer excitation is provided either from a direct current (dc) or ac source at a voltage of 4–8 V revolutions per second (rms). Most amplifier systems include low pass filters that filter out unwanted high frequency signals. Pressure amplifier frequency response should be flat from 0 to 50 Hz to avoid pressure waveform distortion.
9.Oscilloscope. Pressure waveforms are best visualized on a calibrated oscilloscope or other similar display panel.
10.Digital processing and display. Digital displays provide a simple method for presenting quantitative data from the pressure waveform. They are found on most modern pressure monitoring equipment. Systolic, diastolic, and mean pressure are typically derived from the pressure waveforms.
11.Strip-chart recorders. Frequently, strip-chart recorders are used to document dynamic response characteristics, respiratory variations in pulmonary artery pressures, and aberrant rhythms and pressure waveforms.
STATIC CALIBRATION
Zeroing and calibrating the transducer are two important steps in setting up the direct pressure-monitoring system.
Zeroing the Transducer
The accuracy of blood pressure readings depends on establishing an accurate reference point from which all subsequent measurements are made. The patient’s midaxillary line (right heart level) is the reference point most commonly used (14). The zeroing process is used to compensate for offset caused by hydrostatic pressure differences, offset in the pressure transducer, amplifier, oscilloscope, recorder, and digital displays. Zeroing is accomplished by opening an appropriate stopcock to the atmosphere and aligning the resulting fluid-air interface with the midaxillary reference point.
Once the system is zeroed the stopcock can be switched to allow the patient’s waveform to be displayed. Pulmonary artery and pulmonary artery wedge pressure are especially susceptible to improper zeroing and should be measured only after the zero point has been verified.
Sensitivity Calibration
The sensitivity of most pressure transducers is fixed at 5.0 mV V 1 of excitation applied per 1 mmHg (0.13 kpa) and calibrated by the manufacturers to within 1%. This degree of accuracy is adequate for clinical purposes. As a consequence standardized transducers need only to be zeroed to obtain accurate pressure measurements (12,13).
CHECKING DYNAMIC RESPONSE
In the critical care setting, where most hemodynamic monitoring is carried out, the catheter-tubing-transducer systems used can usually be characterized as an underdamped second-order dynamic system analogous, for example, to a bouncing tennis ball. A second-order dynamic system can be expressed mathematically by a second-order differential equation with characteristics determined by three mechanical parameters: elasticity, mass, and friction. These same parameters apply to a catheter-tubing- transducer system where the natural frequency (fn in Hz) and damping coefficient determine the dynamic characteristics for a catheter-tubing-transducer system. For an underdamped second-order system fn and define the system’s

|
500 |
|
|
|
|
|
|
|
|
ξ = 0.1 |
|
|
|
||
|
|
|
|
|
|
|
|
|
|
|
|
|
|
|
|
|
450 |
|
|
|
|
|
|
|
|
|
|
|
|
|
|
% |
400 |
|
|
|
|
|
|
|
|
|
|
|
|
|
|
350 |
|
|
|
|
|
|
|
|
|
|
|
|
|
|
|
RATIO |
|
|
|
|
|
|
|
|
|
|
|
|
|
|
|
300 |
|
|
|
|
|
ξ = 0.2 |
|
|
|
|
|
|
|
||
|
|
|
|
|
|
|
|
|
|
|
|
|
|||
AMPLITUDE |
|
|
|
|
|
|
|
|
|
|
|
|
|
||
250 |
|
|
|
|
|
|
|
|
|
|
|
|
|
|
|
|
|
|
|
|
|
|
|
|
|
|
|
|
|
|
|
|
200 |
|
|
|
|
|
|
|
|
|
|
|
|
|
|
|
150 |
|
|
|
|
|
|
|
ξ = 0.5 |
|
|
|
|
|
|
|
100 |
|
ξ = 2.0 |
|
|
ξ = 0.7 |
|
|
|
|
|
||||
|
|
|
|
|
|
|
|
|
|
|
|
|
|
||
|
50 |
1 |
2 |
3 |
4 |
5 |
6 |
|
|
|
|||||
|
HARMONIC |
|
|
|
|
|
|
|
|
|
|
|
|
|
|
|
|
|
|
|
|
|
|
|
|
|
|
|
|
||
|
0 |
(HR = 120) |
|
|
|
|
|
|
|
|
|
|
|
|
|
|
2 |
4 |
6 |
8 |
10 |
12 |
14 |
16 |
18 |
||||||
|
0 |
||||||||||||||
Figure 5. Family of frequency versus amplitude ratio plots for five different damping coefficients z and natural frequencies fn of the plot shown is 10 Hz. When z ¼ 0.1, the system is very underdamped, and when z ¼ 2.0, it is overdamped. The dashed line shows the frequency versus amplitude characteristic that would occur if the system had a flat frequency response. Along the frequency axis are plotted the harmonics of the pressure wave if the heart rate were 120 beats min 1 (2 beats s 1). Note that by the fifth harmonic (10 Hz) if z ¼ 0.1 the true signal would be amplified five times. If z ¼ 2.0 there would be an attenuation to about one-fourth of the amplitude. In both cases there would be a gross waveform distortion because neither situation reflects a high fidelity system dynamic response. Fidelity of the system can be improved by increasing the fn or adjusting z to be in the range of 0.5–0.7. [Reproduced from Ref. 6, with permission.]
dynamic characteristics. In the clinical setting fn and can be measured easily and conveniently by using the ‘‘fast-flush’’ method.
Dynamic response characteristics of catheter-tubing- transducer systems have been defined by two interrelated techniques. The first technique specifies the frequency bandwidth and requires that the system frequency response must be flat up to a given frequency so that a specified number of harmonics usually 10 of the original pulse wave can be reproduced without distortion (Fig. 5).
The second technique specifies fn and The plot of fn and in Fig. 6 has five areas (6,15). If the characteristics of the catheter-tubing-transducer ‘‘plumbing’’ system fall in the adequate or optimal area of the graph, the pressure waveforms will be adequately reproduced. If the characteristics fall into one of the remaining three areas, there will be pressure waveform distortion. Most catheter-tubing-trans- ducer systems assembled under optimal conditions are underdamped, but a few fall into the unacceptable areas of the chart. Methods for optimizing the catheter-tubing- transducer system components have been outlined (15–20). In the clinical setting, there are dramatic differences between each patient setup; therefore it is mandatory to verify the adequacy of each pressure-monitoring system by testing them. The testing can be done easily using the fastflush technique.
A fast flush is produced by opening the valve of the continuous flush device, for example, by pulling and quickly releasing the pigtail valve on a continuous flush
|
|
|
|
MONITORING, HEMODYNAMIC |
571 |
||||||
|
1.2 |
|
|
|
|
|
|
|
|
|
RATIO |
|
1.1 |
|
|
|
|
|
|
|
|
|
|
|
1 |
|
|
|
|
|
|
|
|
|
|
ζ |
|
|
|
|
|
|
|
|
|
AMPLITUDE |
|
.9 |
|
DAMPED |
|
|
|
|
|
|
|||
.8 |
|
|
|
|
|
|
|
|
|
||
.7 |
|
|
|
|
|
|
|
|
|
||
.6 |
|
|
|
|
|
|
|
|
|
||
DAMPINGCOEFFICIENT |
UNACCEPTABLE |
|
|
|
|
|
|
|
|
.1 |
|
.5 |
|
|
|
|
OPTIMAL |
|
|
.2 |
|||
.4 |
|
|
|
|
|
|
|||||
|
|
|
|
|
|
|
|
.3 |
|||
.3 |
|
|
|
|
|
|
|
|
|||
|
|
|
|
|
|
|
|
.4 |
|||
.2 |
|
|
|
|
|
|
|
|
.5 |
||
|
|
|
|
ADEQUATE |
|
|
.6 |
||||
|
.1 |
|
|
|
|
|
|
|
.7 |
||
|
|
|
|
|
|
|
|
|
|
||
|
|
|
|
|
|
|
|
|
|
.8 |
|
|
|
|
|
|
|
|
|
|
|
|
|
|
0 |
5 |
10 |
15 |
20 |
25 |
30 |
35 |
40 |
45 |
.9 |
|
0 |
50 |
|||||||||
|
|
|
|
FREQUENCY (HZ) |
|
|
|
|
|||
Figure 6. Plot of fn versus z illustrating the five areas into which catheter-tubing-transducer systems fall. Systems in the optimal area will reproduce even the most demanding (fast heart rate and rapid systolic upstroke) arterial or pulmonary artery waveforms without distortion. Systems in the adequate area will reproduce most typical patient waveforms with little or no distortion. All other areas will cause serious and clinically important waveform distortion. Note the scale on the right can be used to estimate z from the amplitude ratio determined during fast flush testing (11). See Fig. 8 for an example of waveforms. [Reproduced from Ref. 6, with permission.]
device. The rapid valve closure generates a near square wave pressure signal from which fn and of the catheter- tubing-transducer system can be measured.
Once the fast-flush test has been executed two or three times, the dynamic response characteristics (fn and) can quickly and easily be determined. Natural frequency fn can be estimated by measuring the period of each full oscillation on a strip-chart recorder following a fast flush (Fig. 7a) and calculating the frequency from the period. Damping coefficient can be determined by using the amplitudes of any two successive peak-to-peak values measured after a fast flush. The amplitude ratio is calculated by dividing the measured height of the smaller peak-to-peak value by that of the amplitude of the larger peak-to-peak value (Fig. 7b). The amplitude ration can then be converted to a damping coefficient by using the scale in the right side of Fig. 6.
Once fn and have been determined, these data can be plotted on the graph of Fig. 6 to ascertain the adequacy of dynamic response. Some bedside monitors and recorders may compromise the clinical user’s ability to use the fastflush technique because the monitors have built-in lowpass filters. These filters should be expanded to at least 50 Hz or be eliminated.
Several factors lead to poor dynamic responses: (1) air bubbles in the system usually caused by a poor initial catheter-tubing-transducer system setup, (2) pressure tubing that is too long, too compliant, or a diameter that is too small, and (3) pressure transducers that are too compliant. The best way to enhance the system’s dynamics is to improve fn.
Invasive pressure monitoring systems have patient risks, such as a source of infection and air embolism. In addition, great care is required by clinical users to optimize

572 MONITORING, HEMODYNAMIC
200
 2 mm
2 mm
(a) |
100 |
0
200
(b) |
100 |
|
22.5 mm
13 mm
0
Figure 7. Measuring dynamic response parameters from the fastflush waveform, (a) The natural frequency fn can be determined by using a strip-chart recording to measure the period of one full oscillation, as shown. In this example, one full cycle is 2 mm and at a paper speed of 25 mm s 1 this results in fn ¼ 12.5 Hz ¼ 25 mm s 1/2 mm. (b) Determining the damping coefficient z required measuring two successive peak-to-peak values of the resulting oscillations. The amplitude ratio of the two successive peaks is taken, giving a value of 0.58 ¼ 13/22.5. With use of the amplitude ratio and the scale on the right side of Fig. 6, the damping coefficient z ¼ 0.17. Plotting the natural frequency and damping coefficient on Fig. 6 shows that this system is underdamped.
dynamic response and proper zeroing to provide accurate and reliable data. Merely looking at pressure waveforms will not provide the information required to determine the adequacy of the system’s dynamic response (see Fig. 8). Fastflush testing to determine these parameters is essential.
SIGNAL AMPLIFICATION, PROCESSING, AND DISPLAY
Once the pressure signal has been transmitted to the transducer, the bedside monitor operates on that signal. Most monitors not only display the heart rate and systolic, diastolic, and mean pressure, but they also display the processed waveform on an oscilloscope and provide an analog output for a recorder or for transmission to a central display.
Placement of the Pulmonary Artery Catheter
The balloon-tipped, flow-directed, pulmonary artery catheter (Swan–Ganz) came into widespread use in 1970 (21).
|
(a) |
|
(c) |
|
200 |
Fn = 7 Hz |
200 |
HR = 107 |
|
||
|
Zeta = .1 |
|
|
|
100 |
|
100 |
|
|
|
|
124 / 78 |
|
|
|
MP = 96 |
|
141 / 76 |
|
|
0 |
|
|
|
MP = 96 |
0 |
|
|
|
|
|
|
(b) |
|
(d) |
Fn = 10 Hz |
200 |
Fn = 25 Hz |
200 |
|
|
||
|
Zeta = .15 |
|
|
Zeta = 3.5 |
|
|
|
|
|
|
|
|
100 |
|
100 |
109 / 84 |
|
128 / 77 |
0 |
MP = 96 |
0 |
MP = 96 |
|
|
|
|
(e) |
|
|
Fn = 10 Hz |
200 |
|
|
|
|
|
|
Zeta = .5 |
|
|
|
|
100 |
|
|
125 / 78 |
|
|
|
MP = 96 |
0 |
Figure 8. Arterial pressure waveforms were obtained from the same patient. Shown are Systolic/Diastolic and Mean Pressure (MP). In panel the (a) Patient’s actual arterial pressure waveform as if recorded with a catheter-tipped transducer is shown, (b) shown the same patient’s arterial waveform recorded with an overdamped system (z ¼ 3.5). Note the fast-flush signal (upper left) returns slowly to the patient waveform. Systolic pressure is underestimated, diastolic pressure is overestimated, and MP is unchanged, (c) An underdamped condition (z ¼ 0.1) with low fn ¼ 7 Hz. After the fast flush, the pressure signal oscillates rapidly (rings). Systolic pressure is overestimated, diastolic is slightly underestimated, and MP is correct, (d) shows an underdamped condition (z ¼ 0.15), but with high fn ¼ 25 Hz. The pressure waveform is slightly distorted and systolic, diastolic, and mean pressures are close to the actual pressures, (e) shown an ideally damped pressure monitoring system (z ¼ 0.5). The undershoot after the fast flush is small and the original patient waveform is adequately reproduced. [Reproduced from Ref. 6, with permission.]
The follow-up development by Ganz of a practical thermal dilution attachment to the pulmonary artery catheter permitted convenient and easy measurement of cardiac output (22). Since these early developments with the Swan–Ganz catheter, the pulmonary artery catheter has been fitted with optical fibers which allow measurement of mixed venous oxygen saturation (23).
The pulmonary artery catheter is inserted into the right side of the circulation using the percutaneous technique typically using entry from either the internal jugular or the subclavian vein. The catheter is floated into the pulmonary artery without use of fluoroscopy, using the hemodynamic pressure waveforms as a guide (Fig. 9).
Accurate Measurement of Pulmonary Artery Pressure.
Since it was introduced, the balloon-tipped, flow-directed, pulmonary artery catheter (Swan–Ganz) has been widely used in intensive care units. The ease with which it is

MONITORING, HEMODYNAMIC |
573 |
Figure 9. Composite illustration showing normal pressure waveforms obtained as a fiber optic balloon flotation pulmonary artery catheter (Swan-Ganz) is advanced from the right atrium to the pulmonary artery wedge position. [From Daily and Tilkian in Reading List (1986), with permission.]
usually inserted may lead one to conclude that the measurements of pulmonary artery and wedge pressure (PCWP) are easily and reliably measured. However, such is not the case.
Pulmonary artery pressures can be measured accurately only if the following steps are taken (24–27):
1.The monitor is properly zeroed.
2.Strip-chart recordings of all PA pressures for a time period covering at least three respiratory cycles are obtained. Using only the monitor’s digital displays is insufficient.
3.Dynamic response testing (fast flush) should be obtained when the catheter is in each position (i.e., wedge and PA). If the dynamic response is not adequate, the problems with the catheter-tubing- transducer system must be resolved before accurate pressures can be measured.
4.Pressures (i.e., systolic, diastolic, and mean pressures) should be assessed from a monitor’s display or a strip-chart recording. The pressure measures should be made at the end expiration when the transmural pressure is nearest zero.
CARDIAC OUTPUT DETERMINATION
Cardiac output is the volume of blood ejected by the heart every minute. Cardiac output is a helpful measurement since it can be used to evaluate the overall cardiac status of the critically ill patient, as well as help make the diagnosis
of cardiovascular disease. Ideally a cardiac output measurement system would be continuous, automatic, minimally invasive, accurate, fast, inexpensive, and easy to use clinically. The most common method used to measure cardiac output in critically ill patients is still the indicator dilution method. The pulmonary artery catheter (Swan–Ganz) introduced in the 1970s revolutionized the ease with which cardiac output could be measured.
The thermal dilution method requires injection of cold physiological solution, usually normal saline, into the superior vena cava or right atrium. Cardiac output is determined by measuring the area under the time– temperature curve measured in the pulmonary artery that results from the injection of the cold solution.
The thermal dilution method for determining cardiac output relies on several assumptions that are not always correct. First, the exact amount of thermal indicator injected cannot be quantitated precisely. Second, indicator is lost at various stages and this loss of indicator (heat loss) leads to errors.
A block diagram of the thermal dilution measuring system with typical thermal dilution curves and time of injection indicated are shown in Fig. 10. Figure 10c and d show the transit time for the cooled blood moving from the injection site in the right atrium to the pulmonary artery measurement site. Calculation of cardiac output requires measuring the area under the curve. Consequently, a baseline temperature must be established before the injection. In turn, the end point is usually determined by extrapolating to the baseline temperature.

574 MONITORING, HEMODYNAMIC
To ensure that accurate thermal dilution cardiac output results are obtained, it is recommended that the thermal dilution curves be presented on a monitoring screen or on a strip-chart recorder. Studies have shown that synchronizing the injections with the respiratory cycle improves the technique’s reproducibility (28). Since there is considerable variability in cardiac output between measures, at least three reproducible curves are usually obtained. Averaging the findings from these three curves gives a more representative assessment of cardiac output.
In recent times, the complexities of using the Swan– Ganz pulmonary artery catheter have result in controversies. Some clinicians feel that such systems should only be used only when needed and then only sparingly while others have a differing viewpoint (29,30). Still others have questioned the ability of making accurate central venous and pulmonary artery occlusion pressures and whether it matters (26,27). Many of those issues will be resolved in the future when there might be better methods for measuring hemodynamic parameters. Until that time, physicians and nurses caring for critically ill patients who require hemodynamic monitoring should be aware of several how to oriented publications (31–34).
Alarming Based on Hemodynamic Parameters. Clinical hemodynamic monitoring is now several decades old.
Figure 10. Schematic diagram of the thermal dilution measurement of cardiac output. A recorder of some type should always be used to verify the quality of the thermal dilution curve, (a) shows the thermal dilution catheter placed into the pulmonary artery. Note the location of injection site and thermistor, (b) shows the connection of the thermal dilution catheter connected to a cardiac output processor and recorder, (c) shows a typical temperaturetime plot sensed by the thermistor near the catheter tip after an iced saline injection. The cardiac output determined in this case was 4.36 L min 1. (d) Shows a similar temperature–time plot for a patient with low cardiac output (2.18 L min 1). Note the larger area and broader dispersion of the waveform caused by the lower flow. [Reproduced from Ref. 9, with permission.]
What started from a simple beginning has since seen many dramatic changes in both the development of new medical devices and skills of the clinicians to use those devices. However, it is my feeling that we are not yet at optimum hemodynamic monitoring. Some recent publications on the topic are illustrative. Sander and colleagues in Germany have recently looked at categories of patients with elevated heart rates who are at higher risk of cardiac complications (35). Their work resulted in an editorial comment Vital are vital signs (36). Additional recent work at Vanderbilt University indicates that volatility in vital signs is a good predictor of death in trauma patients (37). Finally, the problem of false alarms continues to be a huge problem with current bedside monitors. As part of a Master of Science thesis in Medical Informatics at the University of Utah, an investigator found that only about one-third of the standard alarms for patients in a variety of ICU care were true alarms. Thus about two-thirds of the alarms are false. However, if the alarming system used heart rates determined from both the ECG and the Arterial Blood Pressure, the number of alarms decreased by 50% and the false alarm rate was only 25% (38). Having smarter and better hemodynamic monitoring with better and smarter alarming systems will be crucial for to future monitoring systems.
COMPUTERIZED DECISION SUPPORT
Much has been learned about hemodynamic measurements and how to use the data to calculate derived patient parameters. These parameters can then be used to determine patient status and augment patient therapy (39–42).
Using hemodynamic data available from bedside monitors and combining that data, in a structured and coded electronic patient record allows for optimal computerized decision support (42–44). Morris and his colleagues have stated the value of computerized decision support well (45). Only adequately explicit protocols contain enough detail to lead different clinicians to the same decision when faced with the same clinical scenario. Guidelines of care provide only general guidance to patient care and require clinicians considerable latitude in which care decision should be made. Computerized protocols, on the other hand, can be patient-specific and evidence based (46). Using computerized decision-support tools variation in clinical practice can be reduced and favorable effects on improve patient outcomes can be accomplished (45,46).
FUTURE
There are still needs for improvement in hemodynamic monitoring. Being able to make the measurements continuously, less invasively, and more reliably are areas where progress is needed. Clearly, using computer aided decision-support technology to help reduce false alarms and to guide clinicians in making better patient diagnosis and more timely and more optimal and effective treatment decision offer ample opportunity for future research and progress.
BIBLIOGRAPHY
1.Gravenstein JS, Paulus DA. Monitoring Practice in Clinical Anesthesia. Philadelphia (PA): Lippincott; 1982.
2.Bruner JMR. Handbook of Blood Pressure Monitoring. Littleton (MA): PSG Publishing Co.; 1978.
3.Daily EK, Schroeder JS. Techniques in Bedside Hemodynamic Monitoring. 3rd ed. St. Louis (MO): Mosby; 1985.
4.Pinsky MF. Functional hemodynamic monitoring. Intensive Care Med 2002;28:386–388.
5.Pinsky MF. Hemodynamic monitoring in the intensive care unit. Clin Chest Med 2003;24:549–560.
6.Gardner RM, Hollingsworth KW. Optimizing ECG and pressure monitoring. Crit Care Med 1986;14:651–658.
7.Pickering TG, et al. Recommendations for blood pressure measurement in humans and experimental animals: part 1: Blood pressure measurement in humans: A statement for professionals from the subcommittee of professional and public education of the American Heart Association council on high blood pressure research. Circulation 2005;111:697–716.
8.Gardner RM. Hemodynamic monitoring: From catheter to display. Acute Care 1986;12:3–33.
9.Gardner RM, Schwartz R, Wong HC, Burke JP. Percutaneous indwelling radial-artery catheters for monitoring cardiovascular function (Prospective Study of the Risk of Thrombosis and Infection). N Engl J Med 1974;290:1227–1231.
MONITORING, HEMODYNAMIC |
575 |
10.Kline AM. Pediatric catheter-related bloodstream infections: Latest strategies to decrease risk. AACN Clin Issues 2005;16: 185–198.
11.Bone RC, et al. Standards of evidence for the safety and effectiveness of critical care monitoring devices and related interventions. Coalition for critical care excellence: Consensus Conference on Physiological Monitoring Devices. Crit Care Med 1995;23:1756–1763.
12.Kutik MH, Gardner RM. Standard for Interchangeability and Performance of Resistive Bridge Blood Pressure Transducers, Arlington (VA): Association for the Advancement of Medical Instrumentation (AAMI); 1986.
13.Gardner RM. Accuracy and reliability of disposable pressure transducers coupled with modern pressure monitors. Crit Care Med 1996;24:879–882.
14.McCann II UG, et al. Invasive arterial BP monitoring in trauma and critical care. Effects of variable transducer level, catheter access, and patient position. Chest 2001; 120:1322– 1326.
15.Gardner RM. Direct blood pressure measurement dynamic response requirements. Anesthesiology 1981;54(3):227–236.
16.Gardner RM. Blood pressure monitoring. In: Webb AR, Shapiro MJ, Singer M, Suter PM, editors. Oxford Textbook of Critical Care. Oxford University Press. 1998; p 1087–1090. chapt 16.
17.Gardner RM. Fidelity of recording: Improving the signal-to- noise ratio. In: Martin J. Tobin, editors. Principles and Practice of Intensive Care Monitoring. New York: McGraw-Hill; 1997. p. 123–132. chapt. 8.
18.Kleinman B, Powell S, Kumar P, Gardner RM. The fast flush testmeasures thedynamicresponseoftheentirebloodpressure monitoring system. Anesthesiology 1992;77:1215–1220.
19.Kleinman B, Powell S, Gardner RM. Equivalence of fast flush and square wave testing of blood pressure monitoring systems. J Clin Monit 1996;12(2):149–154.
20.Promonet C, et al. Time-dependent pressure distortion in a catheter-transducer system: Correction by fast flush. Anesthesiology 2000;92:208–218.
21.Swan HJC, et al. Catheterization of the heart in man with the use of a flow directed balloon-tipped catheter. N Engl J Med 1970;283:447–451.
22.Ganz W, et al. A new technique for measurement of cardiac output by thermodilution in man. Am J Cardiol 1971;27:392– 396.
23.Cole J, Martin WE, Cheung PW, Johnson CC. Clinical studies with a solid state fiberoptic oximeter. Am J Cardiol 1972;29: 383–388.
24.Morris AH, Chapman RH, Gardner RM. Frequency of wedge pressure errors in the ICU. Crit Care Med 1985;13:705–708.
25.Cengiz M, Crapo RO, Gardner RM. The effect of ventilation on the accuracy of pulmonary artery and wedge pressure measurements. Crit Care Med 1983;11:502–507.
26.Rizvi K, et al. Effect of airway pressure display on interobserver agreement in the assessment of vascular pressure in patients with acute lung injury and acute respiratory distress syndrome. Crit Care Med 2005;33:98–103.
27.Liebowitz AB. More reliable determination of central venous and pulmonary artery occlusion pressures: Does it matter? Editorial Crit Care Med 2005;33:243–244.
28.Stevens JH, et al. Thermodilution cardiac output measurements: Effects of the respiratory cycle on its reproducibility. J Am Med Assoc 1985;253:2240–2242.
29.Pinsky MR, Vincent J-L. Lets use the pulmonary artery catheter correctly and only when we need it. Point of view. Crit Care Med 2005;33:1119–1122.
30.Levin PD, Sprung SL. Another point of view: No Swan song for the pulmonary artery catheter. Crit Care Med 33:1123–1124.