

Multidimensional Chromatography
.pdf308 |
Multidimensional Chromatography |
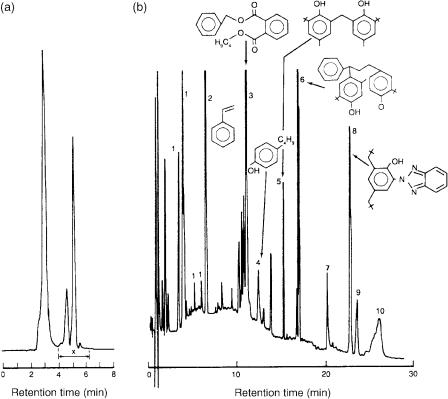
Figure 12.2 Chromatograms of an ABS copolymer sample: (a) microcolumn SEC trace; (b) capillary GC trace of peak ‘x’. Peak identification is as follows: 1, C14 alkanes; 2, C15 alkanes; 3, C18 alkanes; 4, nonylphenol; 5, palmitic acid; 6, styrene – acetonitrile trimer; 7, stearic acid; 8, styrene – acetonitrile trimer; 9, Irganox 1076; 10, trinonylphenyl phosphate; 11, Ethanox 330. Reprinted with permission from Ref. (12).
material in the matrix. This is an effective technique to prevent the introduction of non-volatile components into the capillary GC – MS system.
As representative examples of the use of this technique, Figures 12.2, 12.3 and 12.4 show, respectively, the SEC – GC traces obtained in the analysis of samples
Figure 12.3 Chromatograms of an ignition-resistant high-impact polystyrene sample: (a) Microcolumn SEC trace; (b) capillary GC trace of peak ‘x’. Peak identification is as follows 1, ionol; 2, benzophenone; 3, styrene dimer; 4, palmitic acid; 5, stearic acid; 6, styrene trimers; 7, styrene trimer; 8, styrene oligomer; 9, Irganox 1076 and Irganox 168; 10, styrene oligomer; 11, nonabromodiphenyl oxide; and 12, decabromodiphenyl oxide. Reprinted with permission from Ref. (12).

Industrial and Polymer Applications |
309 |
Figure 12.4 Chromatograms of a styrene – isoprene – styrene triblock copolymer sample:
(a) microcolumn SEC trace; (b) capillary GC trace of the introduced section ‘x’. Peak identification is as follows: 1, ionol; 2, not identified; 3, Irganox 565. Reprinted with permission from Ref. (12).
of emulsion polymerized acrylonitrile – butadiene – styrene – (ABS) copolymer, igni- tion-resistant high-impact polystyrene, and styrene – isoprene – styrene triblock copolymer. The following conditions were used in these three analyses. LC: UV detection at 254 nm; injection volume of 200 nL; fused-silica capillary column (30 cm 250 m i.d.) with an Ultrastyragel 10 000 (styrene/divinylbenzene) polymeric packing; mobile phase, THF at a flow rate of 3 L min. GC: DB-1 column (15 m 0.32 i.d., 0.25 m film thickness); He carrier gas; column connected to an uncoated deactivated inlet (5m 0.32 mm i.d.), with the latter being connected to a 10-port valve, which was used to transfer components from the SEC system to the capillary GC – MS system.
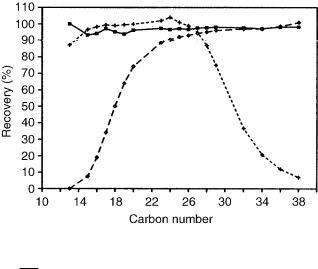
The coupling of SEC with GC has also been used for the analysis of polymer additives from a polystyrene matrix (13). The transfer technique in this case includes concurrent solvent evaporation using a loop-type interface, early vapor exit and co-solvent trapping. The latter allowed recoveries of almost 100% for solutes as volatile as n-tridecane. The adaptation made to the standard loop-type interface by the addition of an extra valve between the LC detector and the LC – GC transfer valve led to improved quantitative results by avoiding the problem of mixing within the injection loop and also improved the recovery of n-alkanes from the mixture. Since the sample pretreatment incorporated dissolving the sample instead of extracting it, quantitative results were obtained. In addition, the effects of shifting the retention time window for the transfer were investigated and demonstrated that recoverabilities of C 1 3 –C38 compounds of up to almost 100% could be obtained. The fraction obtained from 4.25 – 5.25 min, shows the greatest recovery, as can be seen in Figure 12.5.
The coupling of SEC to GC is not an easy process and in order to avoid additional LC interactions that could effect the predominate size exclusion separation relatively polar solvents such as THF are usually employed. The drawback is that polar
310 |
Multidimensional Chromatography |
Figure 12.5 Effect of shifting the time window for the transfer. Operation in the SEC – GC analysis of polymer additives in a poly styene matrix, shown for the following fractions: , 4.00 – 5.00 min; , 4.25 – 5.25 min; , 4.45 – 5.45 min. Reprinted from
Proceedings of the 15th International Symposium on Capillary Chromatography, J. Blomberg et al., ‘Automated sample clean-up using on-line coupling of size-exclusion chromatography to high resolution gas chromatography’, pp. 837– 847, 1993, with permission from Wiley-VCH.
solvents show poor wettability properties when they are introduced in to the retention gaps and the conventional on-column techniques cannot be used for the introduction of large fractions (such as 500 L). Therefore, a more applicable transfer technique, such as concurrent solvent evaporation of THF (ca. 100 °C) with a looptype interface, was used, employing n-decane as the co-solvent. For solutes that eluted within 120 – 150 °C above the transfer temperature, quantitative results could not be obtained by solely using concurrent solvent evaporation, so here the problem was circumvented by using co-solvent trapping. The optimization of the LC – GC transfer within a larger temperature range and co-solvent concentration was achieved by modification of the transfer temperature, and increasing the length of the retention gap.
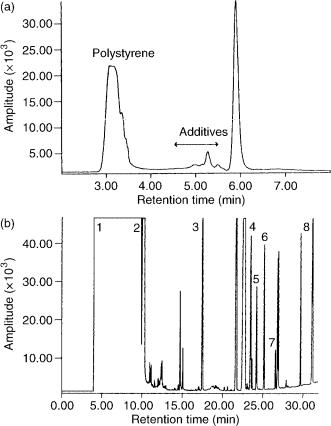
The applicability of this experimental setup and the repeatability of the data obtained were checked by analyzing polystyrene (PS706) after the addition of several well-known polymer additives. The SEC trace is presented in Figure 12.6(a), with the capillary GC trace of the additive fractions being shown in Figure 12.6(b). A relative standard deviation of less than 2% was obtained from 10 consecutive analyses of several additives, including Cyasorb UV531, Tinuvin 120 and Irgfos 168, added to the polymer material.
The quantitative analysis of additives in a polycarbonate homopolymer has been carried out by micro-SEC – capillary GC and by a conventional precipitation technique (14). The validity of the on-line technique was demonstrated and equivalent
Industrial and Polymer Applications |
311 |
Figure 12.6 (a) SEC trace of polystyrene PS706 plus additives. (b) Capillary GC trace of the additive fraction: 1, THF (main solvent); 2, n-decane (co-solvent); 3, n-eicosane (internal standard); 4, Tinuvin 327; 5, Cyasorb UV531; 6, Tinuvin 120; 7, Tinuvin 770; 8, Irgafos 168. Reprinted from Proceedings of the 15th International Symposium on Capillary Chromatography, J. Blomberg et al., ‘Automated sample clean-up using on-line coupling of size-exclu- sion chromatography to high resolution gas chromatography’, pp. 837– 847, 1993, with permission from Wiley-VCH.
concentrations were obtained from both techniques for most of the components, with the exception of Tinuvin 329. A greater concentration was obtained for this additive by using the coupled technique, which may be attributed to additive loss during the precipitation technique. In addition, quantitative results were obtained from ten separate analyses of the sample, with the coupled technique showing a 2 – 3 times lower %RSD for most of the polycarbonate additives. Typical chromatograms obtained by using this coupled technique are shown in Figure 12.7.
Cortes et al. (15) have demonstrated the use of multidimensional chromatography employing on-line coupled microcolumn size exclusion chromatography and

312 |
Multidimensional Chromatography |
Figure 12.7 Chromatograms of a polycarbonate sample: (a) microcolumn SEC trace; (b) capillary GC trace of introduced fractions. SEC conditions: fused-silica (30 cm 250 mm i.d.) packed with PL-GEL (50 Å pore size, 5 mm particle diameter); eluent, THF at a Flow rate of 2.0ml min; injection size, 200 NL; UV detection at 254 nm; ‘x’ represents the polymer additive fraction transferred to LC system (ca. 6 L). GC conditions: DB-1 column (15m 0.25 mm i.d., 0.25 m film thickness); deactivated fused-silica uncoated inlet (5 m 0.32 mm i.d.); temperature program, 100 °C for 8 min, rising to 350 °C at a rate of 12°C/min; flame ionization detection. Peak identification is as follows: 1, 2,4-tert-butylphenol; 2, nonylphenol isomers; 3, di(4-tert-butylphenyl) carbonate; 4, Tinuvin 329; 5, solvent impurity; 6, Irgaphos 168 (oxidized). Reprinted with permission from Ref. (14).
pyrolysis gas chromatography for characterization of a styrene – acrylonitrile copolymer. This system used a 10-port valve and a glass chamber interface for the analysis of non-volatile compounds. A more complete description of the microcolumn liquid chromatography – pyrolysis gas chromatography interface is given in the original reference (15). It is advantageous to use a coupled mode since fractions do not have to be collected manually, evaporated, redissolved in a certain solvent and then manually transferred to a pyrolysis probe by using a syringe. For the characterization of polymers, the coupled techniques of SEC and pyrolysis GC allow the determination of average polymer composition as a function of molecular size. This may also elucidate a more comprehensive understanding of the polymer properties and the polymerization chemistry of particular systems.

Industrial and Polymer Applications |
313 |
Solutions of the styrene – acrylonitrile copolymer were separated on a micro-size exclusion column (50 cm 250 m i.d., packed with Zorbax PSM-1000), using THF as the mobile phase, and with UV detection at 220 nm, and specific fractions were then transferred into an on-line pyrolysis chamber. Within this chamber, the non-volatile polymer fractions were pyrolyzed and the products separated on a capillary GC column (50 m 0.25 mm i.d., coated with 5% phenylmethylsilicone). The variability in composition was studied by obtaining the area ratios of the styrene and acrylonitrile peaks that were formed in each molecular size fraction. The relative composition of this polymer in the six fractions over the molecular-weight range from 1.1 104 to 1.8 104 was determined to be 5.96, with a relative standard deviation of 2.4%. The relative composition of the styrene – acrylonitrile copolymer was independent of molecular size. Figure 12.8 presents the micro SEC trace obtained for this polymer, and also shows the molecular-size fractions that were transferred to the pyrolysis-GC system. A typical pyrolysis-GC trace is given in Figure 12.9, for a fraction with a molecular-weight range of 1 800 000 – 450 000.
The analysis of industrial samples such as the pyrolysis products of Turkish lignites has been carried out by using GC, SEC and coupled HPLC/GC (16). The combustion products of lignites result in atmospheric pollution. The pyrolysis of
Figure 12.8 Microcolumn size exclusion chromatogram of a styrene – acrylonitrile copolymer sample; fractions transferred to the pyrolysis system are indicated 1 – 6. Conditions: fused-silica column (50 cm 250 m i.d.) packed with Zorbax PSM-1000 (7 m df); eluent, THF; flow rate, 2.0 L min; detector, Jasco Uvidec V at 220 nm; injection size, 20 nL. Reprinted from Analytical Chemistry, 61, H. J. Cortes et al., ‘Multidimensional chromatography using on-line microcolumn liquid chromatography and pyrolysis gas chromatography for polymer characterization’, pp. 961 – 965, copyright 1989, with permission from the American Chemical Society.

314 |
Multidimensional Chromatography |
Figure 12.9 Typical pyrolysis chromatogram of fraction from a styrene – acrylonitrile copolymer sample obtained from a microcolumn SEC system: 1, acrylonitrile; 2, styrene. Conditions: 5 % Phenylmethylsilicone (0.33 m df) column (50 m 0.2 mm i.d.); oven temperature, 50 to 240 °C at 10 °C/min; carrier, gas, helium at 60 cm/s; flame-ionization detection at 320 °C; make-up gas, nitrogen at a rate of 20 mL/min.; ‘P’ indicates the point at which pyrolysis was made. Reprinted from Analytical Chemistry, 61, H. J. Cortes et al., ‘Multidimensional chromatography using on-line microcolumn liquid chromatography and pyrolysis gas chromatography for polymer characterization’, pp. 961 – 965, copyright 1989, with permission from the American Chemical Society.
Beypazari, Can and Goynuk lignites was carried out in a conventional Heinze retort. The pyrolysis product of the Goynuk lignite was analyzed by using coupled HPLC/GC, with the condensable total oil and tar products from pyrolysis being dissolved in dichloromethane. A silica – aminosilane bonded silica column, in series with a UV detector, a 10-port valve interface with a 150 l sample loop and a Carlo Erba gas chromatograph equipped with a 25 m 0.33 mm i.d. retention gap, connected to a 25 m 0.33 mm i.d. BP-5 0.5 m analytical fused column, with flameionization detection, was used. The HPLC eluent consisted of 10% dichloromethane in pentane, with helium being used as the GC carrier gas. After elution of the aliphatic fraction which contained saturates and olefins, backflusing was carried out and then analysis of the aromatic fractions was performed. On-line GC of these fractions allowed separation of the components and identification by their retention indices. It was found that alkanes and alkenes were present in the aliphatic fraction, and the aromatic fraction contained quantities of polycyclic aromatic compounds (PACs). In addition, fractionation of the sample by ring size was carried out, with
Industrial and Polymer Applications |
315 |
this being achieved by a forward flow of HPLC eluent and then backflushing after the elution of the three-ring PAC. Analysis of the backflush fraction revealed the presence of some low-molecular-mass polar PACs, including nitrogen-containing PACs as well as higher-molecular-mass PAC species, e.g. containing 4 – 5 rings.
12.6SEC–REVERSED PHASE LC APPLICATIONS
Quantitative determination of the polymer additives in an acrylonitrile – butadiene – styrene (ABS) terpolymer by using microcolumn size exclusion chromatography with THF as the eluent, coupled on-line to a reversed phase column employing typical solvent systems such as acetonitrile – water has been demonstrated (16). A preseparation was carried out by size exclusion chromatography using a narrow-pore-size packing (50 Å). This packing completely resolved the smaller- molecular-size additives from the polymer fraction, as can be seen in Figure 12.10
(a). For the transfer from the SEC system to the reversed phase LC system, a 6-port Valco valve with a 10 L external loop was used. The transferred fraction was then analyzed by reversed phase HPLC for determination of the polymer additives (Figure 12.10(b)). The introduction of 6 l of the THF fraction from the SEC system into the reversed phase system allowed good resolution between the components, and gave peak shapes which were not broad or distorted. The use of microcolumn SEC permitted a small THF volume containing the additive fraction to be transferred. However, if a larger i.d. column had been used, a greater volume of THF would need to be transferred, thus causing broad and distorted peaks in the second dimension.
Johnson et al. (17) have coupled an SEC system, operating in the normal phase mode, using Micropak TSK gels with THF as the eluent, to a gradient LC system in the reversed phase mode, using MicroPak-MCH (monolayer octadecylsilane phase) with acetonitrile – water as the eluent, for the analysis of various additives in rubber stocks. These additives include carbon black, processing oils, antioxidants, vulcanizing accelerators and sulfur. The rubber stocks that were analyzed were butadiene – acrylonitrile (Chemigum N-615) and styrene – butadiene (Plioflex 1502) copolymers. The compositions of the compound rubber stocks is presented in Table 12.1.
The system used in this analysis consisted of four columns, with the first three being size exclusion columns (50 cm 3000H, 50cm 2000H and 80 cm 1000H Micropak TSK gels), followed by a C18 analytical column (Micropak MCH). The chromatogram of the Chemigum rubber stock obtained from the three coupled SEC columns can be seen in Figure 12.11(a). After this stage, a 10 L fraction of each peak in the SEC chromatogram was transferred to the RPLC system via an injection valve. In this mode, a gradient was applied to elute the more hydrophobic components. Standards were run in order to identify the retention times of the components in the SEC coupled system, as well as in the SEC – RPLC system. RPLC traces are shown for two the fractions, i.e. dibutylphthalate and elemental sulfur,
316 |
Multidimensional Chromatography |
Figure 12.10 Microcolumn SEC – LC analysis of an acrylonitrile – butadiene – styrene (ABS) terpolymer sample: (a) SEC trace; (b) LC trace. SEC conditions: fused-silica column (30 cm 250 mm i.d.) packed with PL-GEL (50 Å pore size, 5 mm particle diameter); eluent, THF at a flow rate of 2.0 mL/min; injection size, 200 nL; UV detection at 254 nm; ‘x’ represents the polymer additive fraction (6 L) transferred to LC system. LC conditions: NovaPak C18 Column (15 cm 4.6 mm i.d.); eluent, acetonitrile – water (60:40) to (95:5) in 15 min gradient; flow rate of 1.5 mL/min; detection at 214 nm. Peaks identification is follows: 1, styrene – acrylonitrile; 2, styrene; 3, benzylbutyl phthalate; 4, nonylphenol isomers; 5, Vanox 2246; 6, Topanol; 7, unknown; 8, Tinuvin 328; 9, Irganox 1076; 10, unknown. Reprinted with permission from Ref. (14).
transferred from the SEC coupled system to the reversed system in Figures 12.11 (b) and 12.11(c), respectively.
The same system was used for analysis of the Plioflex stock. The SEC trace is seen in Figure 12.12(a), with the RPLC traces for two of the fractions, (1) Wingtay 100 and (2) mixed disulfide and 2,2 thiobis (benzothiazole) (MBTS), transferred from the SEC coupled system to the reversed system presented in Figures 12.12(b) and 12.12(c), respectively. Plioflex is a more complex sample than Chemigum since it contains processing oil (see Table 12.1). Therefore, the analysis was more complicated due to the presence of a wide molecular weight range of aromatic compounds in this oil (eluted between 30 and 50 min) which could be seen to interfere
Industrial and Polymer Applications |
|
317 |
Table 12.1 Compositions of the compound rubber stocks |
|
|
|
|
|
|
Content a |
|
Component |
Chemigum N-615 |
Plioflex 1502 |
|
|
|
Polymer |
100 |
100 |
HAF carbon black |
50 |
50 |
Aromatic processing oil |
– |
5 |
Dibutyl phthalate |
5 |
– |
Stearic acid |
1 |
1 |
Wingstay 100 b |
– |
1 |
Wingstay 300 c |
1 |
– |
Zinc oxide |
5 |
5 |
MBTS d |
1 |
1 |
TMTD e |
0.3 |
0.3 |
Sulfur |
1.5 |
1.5 |
Total |
164.8 |
164.8 |
|
|
|
aExpressed as parts per hundred of ‘pure’ polymer.
bMixed diarylphenylenediamine.
cAlkylarylphenylenediamine
d2,21-thiobis (benzothiazole).
eTetramethyltrhiuradisulfide.
with other components in the SEC trace (see Figure 12.12(a)). Hence, analysis in the second dimension by RPLC of the transferred fractions allowed the identification of these components.
12.7GC – GC APPLICATIONS
When columns of the same polarity are used, the elution order of components in GC are not changed and there is no need for trapping. However, when columns of different polarities are used trapping or heart-cutting must be employed. Trapping can be used in trace analysis for enrichment of samples by repetitive preseparation before the main separation is initiated and the total amount or part of a mixture can then be effectively and quantitatively transferred to a second column. The main considerations for a trap are that it should attain either very high or very low temperatures over a short period of time and be chemically inactive. The enrichment is usually carried out with a cold trap, plus an open vent after this, where the trace components are held within the trap and the excess carrier gas is vented. Then, in the re-injection mode the vent behind the trap is closed, the trap is heated and the trapped compounds can be rapidly flushed from the trap and introduced into the second column. Peak broadening and peak distortion, which could occur in the preseparation, are suppressed or eliminated by this re-injection procedure (18).
Heart-cutting, with trapping and re-injection, using isothermal dual capillary column chromatography for separation of the UV photolysis products of methyl