

Multidimensional Chromatography
.pdf380 |
Multidimensional Chromatography |
Figure 14.1 The number of possible hydrocarbon isomers of fractions with up to 20 carbon atoms in oil fractions: ———— , paraffins; – – – – –, naphthenes; . . . . . . , mono-olefins; —— , aromatics.
the details of these developments has been kept inside the walls of the research institutes and have never been reported in the open literature.
Since the boiling range of a petroleum fraction is its main characteristic and the fractions are generally designated according to these boiling ranges, this present chapter will be divided into sections according to boiling range.
Multidimensional Chromatographic Applications in the Oil Industry |
381 |
14.2GASES
The analyses of gases in the oil industry comprises the determination of the inert gases (He, H2, O2, Ar and N2), low-boiling compounds (CO, CO2, H2S, COS) and the lower hydrocarbons, saturated and unsaturated, up to hexane. Some special samples, such as natural gas, have to be analysed for low concentrations of higher-boiling compounds (up to C10s) since such compounds have an important influence on the calorific value and dew point.
For measuring the inert species, some of which are present in the majority of gases, the thermal-conductivity detector (TCD) is often the detector of choice for gas analyses. Since the TCD is a concentration detector and its sensitivity is lower than that of mass-flow detectors such as the flame-ionization detector (FID), relatively high concentrations of compounds in the carrier gas are needed. This means that packed columns, with their high loadability, are still quite popular for such analyses.
Some of the analysis configurations in use enable the analysis of specific compounds in gas samples, such as sulfur compounds in hydrocarbon gases and various impurities in main compounds. Other configurations aim at the determination of all of the different constituents of refinery gases. Various standardization organisations, such as the American Society for Testing and Materials (ASTM), Institute of Petroleum (IP), Universal Oil Products (UOP), Deutsches Institut für Normung (DIN) and Gas Processors Association (GPA) (4–8) have published a number of these configurations as standardized methods.
14.2.1 THE ANALYSIS OF TRACES OF SULFUR COMPOUNDS IN ETHENE AND PROPENE
Ethene and propene are produced as bulk feedstocks for the chemical (polymer) industry and therefore their purities are important parameters. In particular, H2S and COS are compounds which may not only cause corrosion problems in processing equipment, but also may have detrimental effects on the catalysts in use. Furthermore, air pollution regulations issued by, among others, the US Environmental Protection Agency (EPA) require that most of the sulfur gases should be removed in order to minimize sulfur emissions into the atmosphere. Therefore, these compounds have to be determined to the ppb level.
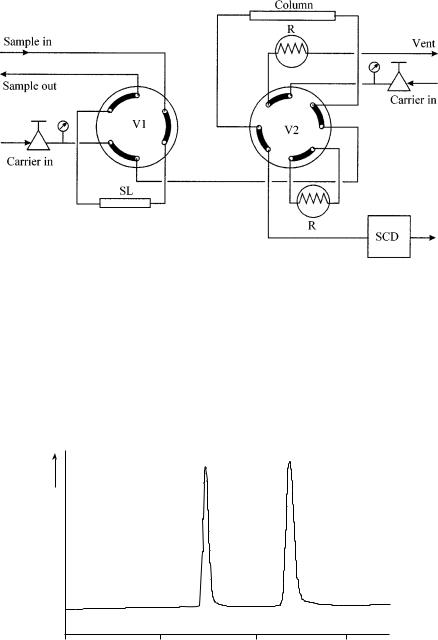
Several methods are available for the determination of sulfur compounds in refinery gas streams. Figure 14.2 depicts a one-column system with column preflush and a sulfur specific detector. In order to prevent adsorption of the acidic sulfur compounds, a H3PO4-treated Carbopack phase is used in a Teflon column. The compounds eluting in front of the H2S and COS are flushed to vent, after which the second valve V2 is switched in order to direct the sulfur compounds towards the sulfur chemiluminescence detector (SCD). The remaining hydrocarbons, possibly coeluting with the sulfur compounds do not interfere, since the selectivity of the SCD for sulfur to carbon is about 107 (9). An example of a typically resulting chromatogram is presented in Figure 14.3, where the lower limit of detection is 50 ppb for both compounds.
382 |
Multidimensional Chromatography |
Figure 14.2 Schematic diagram of the chromatographic system used for the analysis of low concentrations of sulfur compounds in ethene and propene: V1, injection valve; V2, column switching valve; SL, sample loop; R, restriction to replace the column; SCD, sulfur chemiluminescence detector.
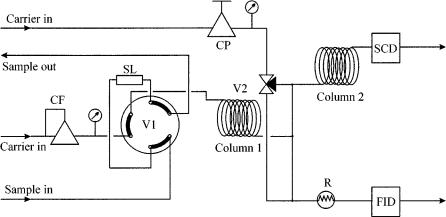
A more sensitive separation scheme is presented in Figure 14.4. This valveless switching system was originally developed by Deans (10, 11) and utilizes pressures to direct the flows through the different columns. Two capillary columns are used, of which the first separates the hydrocarbons from each other and from the sulfur gases.
|
|
1 |
2 |
|
|
|
|
Detector response |
|
|
|
0 |
1 |
2 |
3 |
Retention time (min)
Figure 14.3 Chromatographic separation of sulfur compounds in propene, obtained by using the system illustrated in Figure 14.2: 1, hydrogen sulfide; 2, carbonyl sulfide.
Multidimensional Chromatographic Applications in the Oil Industry |
383 |
Figure 14.4 Schematic diagram of the chromatographic system used for the analysis of very low concentrations of sulfur compounds in ethene and propene: CP, pressure regulator; CF, flow regulator; SL, sample loop; R, restriction to replace column 2; V1, injection valve; V2, three-way valve to direct the effluent of column 1 to either column 2 or the restriction; column 1, non-polar capillary column; column 2, thick-film capillary column; SCD, sulfur chemiluminescence detector; FID, flame-ionization detector.
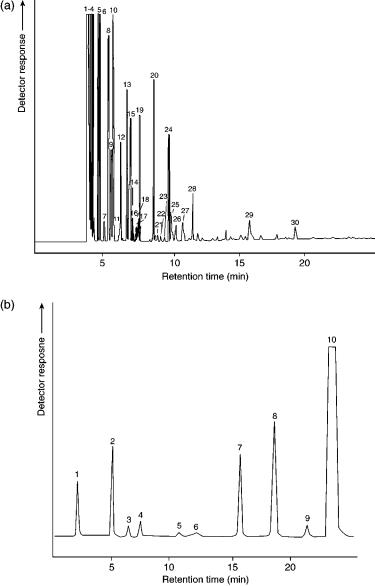
The hydrocarbons are directed to the FID and identified. After this separation, the second value (V2) is switched such that the effluent of column 1 is directed to column 2, a thick-film capillary column, which separates the sulfur compounds from the remaining hydrocarbons and from each other. This effluent is directed to the SCD, where the sulfur compounds are identified. The advantage of this approach above that of the one shown in Figure 14.2 is the fact that the analytes do not pass any valves in the separation process, and thus adsorption of acidic compounds is avoided. Moreover, the hydrocarbons are not disregarded, but can be determined by using the FID, as is shown in Figure 14.5. The lower limit of detection of sulfur compounds when using this configuration is around 1 ppb.
14.2.2THE ANALYSIS OF REFINERY GAS
Refinery gas is the collective noun used for a range of off-gases originating from the various oil processes. A detailed knowledge of the composition of these gases is needed for three reasons, as follows:
•to monitor and adjust individual processes or products;
•to comply with legislative measures concerning environmentally hazardous compounds;
•to establish the economic value of the gas.
For most gas process environments – refineries, catalyst development sites, research and development and plant laboratories – a knowledge of the exact composition of the
384 |
Multidimensional Chromatography |
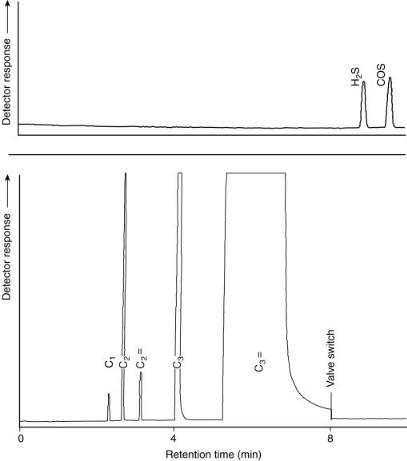
Figure 14.5 Chromatographic separation of (a) sulfur compounds, and (b) hydrocarbons, obtained by using the system illustrated in Figure 14.4.
gas stream components is a prerequisite for achieving optimum control and quality assurance. The refinery analyser configurations therefore have to cope with a wide variety of gas compositions and concentrations.
A five-column configuration of such an analyser system is depicted in Figure 14.6. The first event in the process is the analysis of H2 by injection of the contents of sample loop 2 (SL2) onto column 5 (a packed molecular sieve column). Hydrogen is separated from the other compounds and detected by TCD 2, where nitrogen is used as a carrier gas. The next event is the injection of the contents of sample loop 1 (SL1), which is in series with SL2, onto column 1. After the separation of compounds up to and including C5, and backflushing the contents of column 1, all compounds above C5 (C6 ) are detected by TCD1. The fraction up to and including C5 is directed to column 2, where air, CO, CO2, C2, and C2= (ethene) are separated from

Multidimensional Chromatographic Applications in the Oil Industry |
385 |
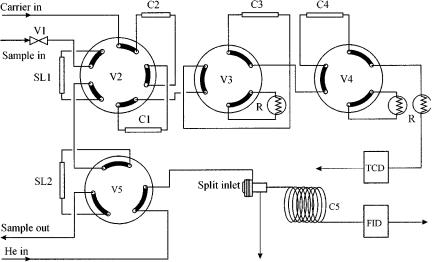
Figure 14.6 Schematic diagram of a five-column chromatographic refinery analyser system: SL, sample loop; V1, two-way valve to block the sample line; V2 and V5, ten-port valves; V3 and V4, six-way valves; C1 C5, packed columns; R, restriction; TCD, thermal conductivity detector.
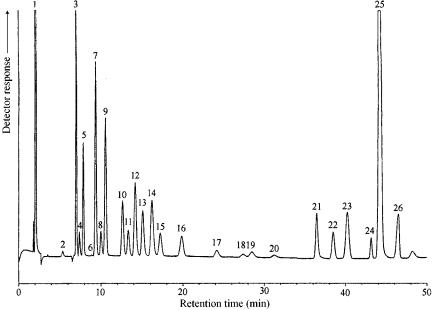
the rest. This fraction is directed to column 3. The remainder of the sample C3s, C4s and C5s on column 2 is separated and detected by TCD1. Meanwhile, the contents of column 3 are separated, while the air is directed to column 4. The remainder, CO2, C 2 and C2, is detected by TCD1. Finally, the contents of column 5 (Ar O2, N2, C1 and CO) are separated and detected by TCD1. The resulting chromatogram is presented in Figure 14.7.
A complicated analyser system such as that described above can only be maintained if all of the valve-switching events are scheduled in the correct positions in the chromatogram. Mismatch of one of the events will cause (parts of) components to be directed to the wrong columns and thus possible misidentifications. Therefore, accurate determination and maintenance of the cutting windows are essential. This can only be accomplished in a fully automated system with accurate flow and temperature controls. Once these prerequisites are fulfilled, the system will operate unattended and produce results of high quality. The repeatabilities generally achieved are of the order of 1% rel.
14.2.3THE ANALYSIS OF NATURAL GAS
Natural gas, found in geological accumulations, normally refers to the gaseous fos- sil-based equivalent of oil. Its composition varies widely, from high concentrations of nitrogen and carbon dioxide to (almost) pure methane. In general, it contains low concentrations of the higher (saturated) hydrocarbons, which influence the physical properties and may present condensation problems in high-pressure transport lines.
386 |
Multidimensional Chromatography |
Figure 14.7 Typical chromatogram obtained by using the refinery analyser system shown in Figure 14.6. Peak identification is as follows: 1, hydrogen; 2, C6 , 3, propane; 4, acetylene; 5, propene; 6, hydrogen sulfide; 6, iso-butane; 8, propadiene; 9, n-butane, 10. iso-butene; 11, 1-butene; 12, trans-2-butene; 13, cis-2-butene; 14, 1,3-butadiene; 15, iso-pentane; 16, n-pen- tane; 17, 1-pentene; 18, trans-2-pentene; 19, cis-2-pentene; 20, 2-methyl-2-butene; 21, carbon dioxide; 22, ethene; 23, ethane; 24, oxygen argon, 25, nitrogen, 26, carbon monoxide.
The economic value of natural gas is primarily determined by the thermal energy it contains, which is expressed in British thermal units (Btu) or calorific value (CV). Other important physical properties comprise the liquid content, the burning characteristics, the dew point and the compressibility. In order to enable the calculation of these properties from its composition, a natural gas analysis should contain a detailed determination of all of the individual components, even in the low-concen- tration range.
Figure 14.8 shows a detailed schematic representation of a natural gas analysis system, which fully complies with GPA standardization (8). This set-up utilizes four packed columns in connection with a TCD and one capillary column in connection with an FID. The contents of both sample loops, which are connected in series, are used to perform two separate analyses, one on the capillary column and one on the packed columns. The resulting chromatograms are depicted in Figure 14.9.
The packed column section contains a stripper pre-column (column 1), which separates the C6 fraction by back-flushing all compounds above n-pentane in one peak. H2S, CO2, C2, O2, N2 and C1 are trapped in columns 3 and 4, while C 3 – C5 hydrocarbons elute from column 2 to the TCD. The remaining components are
Multidimensional Chromatographic Applications in the Oil Industry |
387 |
Figure 14.8 Schematic diagram of the natural gas analyser system: SL, sample loop; V1, two-way valve to block the sample lines; V2, ten-port valve; V3, V4 and V5, six-port valves; R, restriction; TCD, thermal-conductivity detector; FID, flame-ionization detector.
separated by columns 3 and 4 and detected by the TCD. The second channel (through valve 5 (V5)) uses a split/splitless injector in order to decrease the bandwidth of the injected sample from the sample loop. The capillary column separates the individual components up to C10. The lower limit of detection of this second channel is 0.001 vol%.
The previous comments concerning maintenance of the refinery analyser described in Section 14.2.2, also apply to this analysis configuration, i.e. proper automation and the use of accurate flow and temperature controls are a necessity.
14.3GASOLINES AND NAPHTHAS
The US Clean Air Act of 1990 mandates the reformulation of gasoline, being aimed at a reduction of the emissions of toxic compounds from combustion engines. Benzene and toluene are classified as toxic air pollutants under this act. In view of the requirements formulated by the American Environmental Protection Agency (EPA), a quantitative determination of benzene concentrations at all process stages is essential to meet the target values and to achieve optimum control of the refining and blending processes. Similar legislation is pending in other countries. The pollutant limits and corresponding test methods from the (US) Clean Air Act may be expected to serve as guidelines in other jurisdictions. In the US, the EPA regulations specify the level of benzene as not to exceed 1% vol. Similar regulations also exist in Europe.
388 |
Multidimensional Chromatography |
Figure 14.9 (a) Typical chromatogram obtained from the natural gas analyser, capillary column channel. Peak identification is as follows: 1, methane; 2, ethane; 3, propane; 4, butane; 5, 2-methyl-butane; 6, n-pentane; 7, 2,2-dimethyl-butane; 8, 2-methyl-pentane; 9, 3-methyl- pentane; 10, n-hexane; 11, methylcyclopentane; 12, 2,2-dimethyl-pentane; 13, benzene; 14 – 19, C7; 20 – 23, C8s; 24, toluene; 25 – 28, C8s; 29, C9, 30, C10. (b) Corresponding (typical) chromatogram obtained from the packed column channel. Peak identification is as follows: 1, C6 ; 2, propane; 3, isobutane; 4, n-butane; 5, 2-methyl-butane; 6, n-pentane; 7, carbon dioxide; 8, ethane; 9, nitrogen; 10, methane.
Multidimensional Chromatographic Applications in the Oil Industry |
389 |
14.3.1 THE ANALYSIS OF BENZENE, TOLUENE AND HIGHER AROMATICS IN LOW-BOILING FRACTIONS
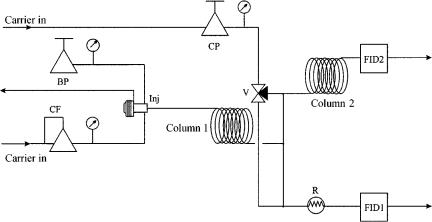
The analysis system depicted in Figure 14.10 is able to analyse the aromatics in oxygenated gasolines by using the Deans switching system. This system pre-sepa- rates the non-aromatics from the sample on the polar first capillary column, and FID1 detects these (group of) compounds. After switching the valve, the eluting aromatics from the first column are further separated on the second capillary column and detected by FID2. The remaining high-boiling components on the first column are transferred directly to FID1. Figure 14.11 presents the resulting chromatogram. In order to enable an accurate quantitation, methyl ethyl ketone (MEK) is used as an internal standard. The lower limit of detection of this system is 0.001 mass%.
14.3.2 PIONA-ANALYSER AND REFORMULYSER
In order to find a balance between environmental legislation and economical refinery requirements, many refiners blend modern stocks into new gasolines for use in highperformance spark-ignition engines. These blended stocks comprise platformates, isomerates, alkylates, light fluid cat(alyst) cracked (FCC) naphtha, FCC gas and oxygenates, such as methyl tert-butyl ether (MTBE), tert-amyl methyl ether (TAME), and alcohols. A detailed analytical characterization of gasoline and naphtha is therefore of the utmost importance for process engineers and blenders.
Figure 14.10 Schematic diagram of the aromatics analyser system: BP, back-pressure regulator; CF, flow controller; CP, pressure controller; Inj, splitless injector with septum purge; V, three-way valve; column 1, polar capillary column; column 2, non-polar capillary column; R, restrictor; FID1, and FID2, flame-ionization detectors.