Multidimensional Chromatography
.pdf232 |
Multidimensional Chromatography |
SW column using methanol:water (1 : 9) containing 0.1 M KH2PO4 and 0.01 M 1-heptanesulfonic acid for elution, and a MicroPak MCH-10 RP column, eluted with a methanol/water gradient solvent system.
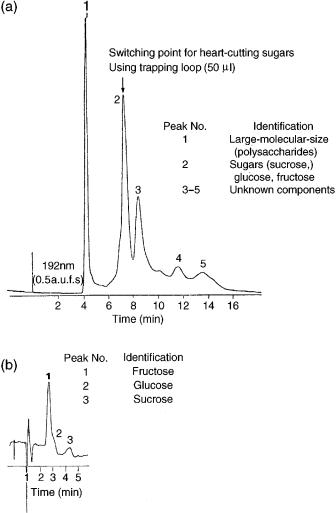
On-column concentration of vitamins in food matrices offers several advantages, i.e. reducing sample preparation times, and increasing detection sensitivity through the use of higher sample loading on the exclusion chromatography (EC) column. Using an analogous method, Apffel et al. (33) carried out the analysis of sugars in a candy formulation. These same authors also analysed sugars in molasses by using a heart-cutting technique and normal-phase HPLC in the second dimension, as shown in Figure 10.8. In this case, the solvents for the two columns are non-compatible, and the volume of solvent that can be passed from the EC column to the normal-phase column is thus greatly restricted.
Johnson et al. (34) coupled SEC in the non-aqueous mode (Micropak TSK gel eluted with tetrahydrofuran) to a gradient RP LC system using acetonitrile/water for the determination of malathion in tomato plants and lemonin in grapefruit peel.
Gel permeation chromatography (GPC)/normal-phase HPLC was used by Brown-Thomas et al. (35) to determine fat-soluble vitamins in standard reference material (SRM) samples of a fortified coconut oil (SRM 1563) and a cod liver oil (SRM 1588). The on-line GPC/normal-phase procedure eliminated the long and laborious extraction procedure of isolating vitamins from the oil matrix. In fact, the GPC step permits the elimination of the lipid materials prior to the HPLC analysis. The HPLC columns used for the vitamin determinations were a 10 m polystyrene/divinylbenzene gel column and a semipreparative aminocyano column, with hexane, methylene chloride and methyl tert-butyl ether being employed as solvent.
Figure 10.9 shows the chromatograms of fortified coconut oil obtained by using
(a) normal-phase HPLC and (b) GPC/normal-phase HPLC. As can be seen from these figures, chemical interferences due to lipid material in the oil were eliminated by using the MD system that was used for quantitative analysis of all of the compounds, except DL- -tocopheryl acetate, where the latter was co-eluted with a trigliceride compound and needed further separation.
Reversed-phase HPLC employing UV detection has been used for the analysis of polar pesticides in aqueous samples, although the sensitivity is usually insufficient for trace analysis experiments. The selectivity can be improved by using more selective electrochemical or fluorescence detectors, suitable for a restricted number of samples, or an additional sample preparation step can be used. A major advantage can be gained using on-line sample enrichment by large-volume injection in combination with column-switching techniques. Hogendoorn and co-workers (36–38) have used this technique for the analysis of single or groups of polar pesticides in water samples. These authors used two C18 columns with high separation power, increasing the selectivity by applying the cutting technique and the sensitivity by using large-volume injections. Chloroallyl alcohol (CAAL), bentazone, isoproturon, metamitron, pentachlorophenol, and other polar pesticides were determined, with the detection limits being at levels of 0.1 g/l.

Foods, Flavours and Fragrances Applications |
233 |
Figure 10.8 Application of the heart-cutting method for the determination of sugars in molasses: (a) exclusion chromatogram of molasses: (b) normal-phase chromatogram of molasses heart-cut. The conditions were as follows: exclusion chromatography, MicroPak TSK 2000 PW column (30 cm 7.5 mm i.d.); 0.1% acetic acid in water at 1.2 ml/min; detection, UV, 192 nm, 0.5 a.u.f.s.; injection volume, 100 l: normal-phase chromatography, MicroPak NH2-10 column (30 cm 4 mm i.d.); acetonitrile –water (65 : 35) at 2.8 ml/min; detection, UV, 192 nm, 0.2 a.u.f.s.; trapping loop volume, 50 l. Reprinted from Journal of Chromatography, 206, J. A. Apffel et al., ‘Automated on-line multi-dimensional high performance liquid chromatographic techniques for the clean-up and analysis of water-soluble samples’, pp. 43 – 57, copyright 1981, with permission from Elsevier Science.

234 |
Multidimensional Chromatography |
Figure 10.9 Chromatograms of fortified coconut oil obtained by using (a) normal-phase HPLC and (b) GPC/normal-phase HPLC. Peak identification is as follows: 1 (a,b), DL- -toco- pheryl acetate, 2 (b), 2,6-di-tert-butyl-4-methylphenol; 2 (a) and 3 (b), retinyl acetate; 3 (a) and 4 (b), tocol; 4 (a) and 5 (b), ergocalciferol. Reprinted from Analytical Chemistry, 60, J. M. Brown-Thomas et al., ‘Determination of fat-soluble vitamins in oil matrices by multidimensional high-performance liquid chromatography’, pp. 1929 –1933, copyright 1988, with permission from the American Chemical Society.
Foods, Flavours and Fragrances Applications |
235 |
10.4 MULTIDIMENSIONAL CHROMATOGRAPHY USING ON-LINE COUPLED HIGH PERFORMANCE LIQUID CHROMATOGRAPHY AND CAPILLARY (HIGH RESOLUTION) GAS CHROMATOGRAPHY (HPLC–HRGC)
In coupled LC – GC, specific components or classes of components of complex mixtures are pre-fractionated by LC and are then transferred on-line to a GC system for analytical separation. Because of the ease of collecting and handling liquids, off-line LC – GC techniques are very popular, but they do present several disadvantages, e.g. the numerous steps involved, long analysis times, possibility of contamination, etc. The on-line coupled LC – GC techniques avoid all of these disadvantages, thus allowing us to solve difficult analytical problems in a fully automated way.
Different transfer techniques and type of interfaces have been developed. Most of the applications involve normal-phase HPLC conditions, although reversed-phase coupled with capillary GC has also been reported.
On-line coupled LC – GC methods have been developed in food analysis for several reasons, i.e. lower detection limits can be reached, the clean-up is more efficient, and large numbers of samples can be analysed with a minimum of manual sample preparation in shorter times.
Several applications involve the removal of large amounts of triglicerides, including the determination of wax esters in olive oil (39), sterols and other minor components in oils and fats (40, 41), PCBs in fish (42), lactones in food products (43, 44), pesticides (45), and mineral oil products in food (46, 47). Grob et al. (47) studied the capacity of silica gel HPLC columns for retaining fats, and concluded that the capacity of such columns is proportional to their size, although the fractions of the volumes that are then transferred to the GC system grow proportionally with the column capacity. For these reasons, 2 – 3 mm i.d. LC columns are to be preferred for LC – GC applications.
In 1996, Mondello et al. (48) published a review article on the applications of HPLC – HRGC developed for food and water analysis over the period from 1986 to 1995. These authors cited 98 references, grouped by following a chronological order and by the subject of the application, as follows:
•composition of edible oils and fats;
•composition of essential oils and flavour components;
•contamination of water and food products;
•mineral oil products in food.
For each application, the LC and GC conditions are listed, together with the type of interface used, and some additional comments on the technique employed and the detection method.
The analysis of sterols, sterols esters, erythrodiol and uvaol, and other minor components of oils and fats, is usually carried out by normal-phase HPLC – HRGC by using a loop-type interface and the concurrent eluent evaporation technique, as reported in the papers cited by Mondello et al. (48) (up to 1995) and in more recent papers (49, 50). More recently, reversed-phase LC – GC methods have been

236 |
|
Multidimensional Chromatography |
|
|
2 |
|
5 |
(b) |
|
|
|
(a) |
|
4 |
|
|
|
8 |
|
|
|
|
|
|
|
3 |
6 |
|
|
|
|
|
|
|
7 |
|
1 |
|
|
5 |
10 |
|
15 |
|
Retention time (min) |
||
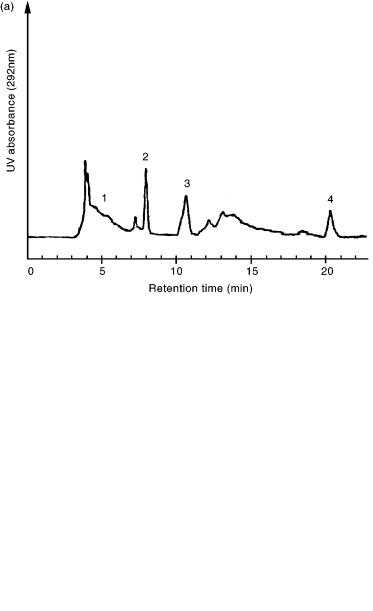
Figure 10.10 Liquid chromatogram (a) of sunflower oil and gas chromatogram (b) obtained after transfer of the indicated fraction (3416 l of methanol – water eluent (78 : 22). Peak identification is as follows: (1) -tocopherol; (2) -tocopherol; (3) campesterol; (4) stigmasterol;
(5) -sitosterol; (6) 5-avenasterol; (7) 7-stigmasterol; (8) 7-avenasterol. LC conditions: 50 4.6 mm i.d. column, slurry packed with 10 m silica; flow rate, 2000 l/min; UV detection, 205 nm. GC conditions: 5% phenyldimethylpolysiloxane column (25 m 0.25 mm i.d.; 0.25 m film thickness); carrier gas, He; column temperature, from 130 °C to 265 °C at 20 °C/min, and then to 300 °C at 3 °C/min. LC– GC transfer: the discharge of the large volume of vapour resulting from the aqueous eluent during LC – GC transfer is promoted by removing the GC column end from the PTV body; after completion of the transfer step, temperature programming of the GC column was started, and the PTV injector was heated at 14 °C sec to 350 °C. Reprinted from Journal of Agricultural and Food Chemistry, 46, F. J. Señoráns et al., ‘Simplex optimization of the direct analysis of free sterols in sunflower oil by on-line coupled reversed phase liquid chromatography– gas chromatography’, pp. 1022 – 1026, copyright 1998, with permission from the American Chemical Society.
developed for the determination of free sterols in edible oils by using a programmable temperature vaporiser (PTV) (41, 51– 53). Figure 10.10 shows the LC– GC separation of the sterol fraction of a sunflower oil obtained by using this system.
Many applications involving the study of the composition of essential oils are based on the use of the on-column interface and retention gap techniques because of the high volatility of the components to be analysed.
In the case of citrus essential oils, LC pre-fractionation can be used to obtain more homogeneous chemical classes of compounds for analysis by GC without any problems of overlapping peaks.
Mondello et al. (54) have developed some applications of on-line HPLC– HRGC and HPLC– HRGC/MS in the analysis of citrus essential oils. In particular, they used LC – GC to determine the enantiomeric ratios of monoterpene alcohols in lemon, mandarin, bitter orange and sweet orange oils. LC – GC/MS was used to study the composition of the most common citrus peel, citrus leaf (petitgrain) and flower (neroli) oils. The oils were separated into two fractions, i.e. monoand sesquiterpene

Foods, Flavours and Fragrances Applications |
237 |
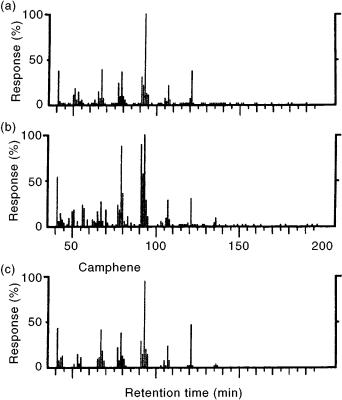
Figure 10.11 Comparison of the mass spectra of a neroli oil peak (camphene) obtained by HPLC – HRGC – MS (a) and GC – MS (b) with a library spectrum of the same compound (c). Reprinted from Perfumer and Flavorist, 21, L. Mondello et al., ‘On-line HPLC – HRGC in the analytical chemistry of citrus essential oils’, pp. 25 – 49, 1996, with permission from Allured Publishing Corp.
hydrocarbons, and oxygenated compounds, or into four fractions containing, respectively, monoand sesquiterpene hydrocarbons, aliphatic aldehydes and esters, and two fractions of alcohols. Since the mass spectra of components of the same class are very similar, and it is necessary to have the spectrum of an extremely pure compound in order to obtain an unambiguous identification when using library matching, the combination of the HPLC – HRGC system with a mass spectrometer allows the components to be more reliably identified. Figure 10.11 shows a comparison of the mass spectra of a peak (camphene) of neroli oil obtained by both HPLC – HRGC – MS and by HRGC – MS with a library spectrum of the same compound.
The use of detection methods such as mass spectrometry (MS) and Fouriertransform infrared (FTIR) spectroscopy can be very useful with respect to the quality
238 |
Multidimensional Chromatography |
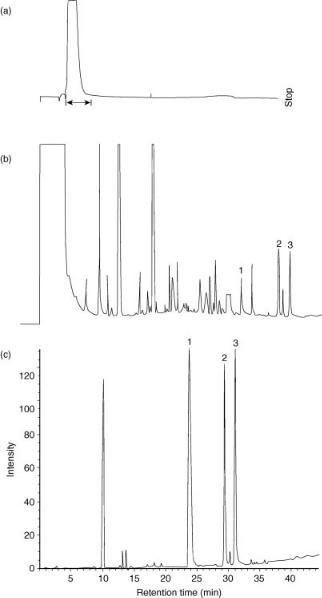
and the amount of information yielded. Sometimes, GC/FTIR has a limited diffusion, compared to GC – MS coupling, due to an overall lower sensitivity. These problems may be overcome if the HRGC/FTIR system is coupled on-line to an LC instrument. An on-line LC – GC/FTIR system has been used for the analysis of citropten and bergapten in bergamot oil, using an on-column interface and partially concurrent eluent evaporation with early vapour exit (55). Figure 10.12 shows the LC chromatogram of bergamot oil (a), plus the corresponding GC/FID (b) and GC/FTIR (c) chromatograms after separation of the transferred fraction. The FTIR chromatogram has been constructed by using a selected wavelength chromatogram (SWC) from 1776 to 1779 cm 1, which falls into the range 1760 – 1780 cm 1, corresponding to the characteristic C – O stretching band of the lactone ring of citropten and bergapten. In this way, any interaction with interfering peaks is avoided.
On-line LC – GC has frequently been used as a clean-up technique for the analysis of trace levels of contaminants (pesticides, plasticizers, dyestuffs and toxic organic chemicals) in water and food products. Several different approaches have been proposed for the analysis of contaminants by on-line LC – GC. Since pesticide residues occur at low concentration in water, soil or food, extraction and concentration is needed before GC analysis is carried out.
Organophosphorus pesticides (OPPs) are extensively used for the protection of olives against several insects. The class of OPPs contains numerous compounds which vary widely in polarity and molecular weight. Capillary GC analysis is the preferred method for the analysis of OPPs, using selective detectors such as the nitrogen – phosphorus (NPD) and flame photometric (FPD) detectors, as well as mass spectrometry (MS). GC analysis has to be performed after removal of the high-molecular-mass fats from the matrix. This pre-separation can be carried out by off-line methods, such as LC or gel permeation chromatography (GPC), although on-line GPC – GC methods have also been developed (56, 57). In the original version of this technique (56), a solvent system of n-decane and the azeotropic mixture of ethyl acetate and cyclohexane was found to give an adequate separation between the fat and the organophosphorus pesticides. The pesticidecontaining fraction was transferred to the GC unit by using a loop-type interface with an early vapour exit and co-solvent trapping. The system presented some difficulties during the transfer of the large eluent fraction (3 ml), and optimization of the transfer temperature was critical. An improved version of the on-line GPC – GC (FPD) method for the determination of OPPs in olive oil has been developed (57) which uses an on-column interface with flow regulation. The miniaturization of the GPC column (the fraction transferred was now reduced to 1.3 ml) and the selection of another combination of main and co-solvent (methyl acetate/cyclopentane, with n-nonane as co-solvent), both with lower boiling points, thus produced a very robust method for the analysis of 28 OPPs in olive oil with an overall detection limit of 0.002 mg/kg.
The application of automated GPC for the clean-up of various matrices has been demonstrated by other authors (58, 59). As well as organophosphorus pesticides, conventional methods for the analysis of organochlorine pesticides (OPCs) in fatty samples may involve various clean-up methods, such as LC or GPC. The main

Foods, Flavours and Fragrances Applications |
239 |
Figure 10.12 (a) LC separation of bergamot oil (305 nm), where the fraction of interest is completely transferred into the GC unit; (b) GC separation (column HP-5, 25 m 0.32 mm i.d., 0.52 m film thickness) of the fraction using an FID, and (c) using FTIR detection (SWC 1776 –1779 cm 1). Peak identification is as follows: (1) 7-methoxycoumarin (internal standard); (2) citropten; (3) bergapten. Reprinted from Journal of High Resolution Chromatography, 14, G. Full et al., ‘On-line coupled HPLC – HRGC: A powerful tool for vapor phase FTIR analysis (LC – GC – FTIR)’, pp. 160 – 163, 1991, with permission from Wiley-VCH.

240 |
Multidimensional Chromatography |
problem to be solved is the separation of the tryglicerides from the most polar analytes while keeping the transfer volume small. In order to achieve this, van der Hoff et al. (60) used a 1 mm i.d. LC silica column (3 m) to obtain transfer volumes of 100 l, containing all the analytes of interest, while maintaining the separation between the most polar analytes and the fat matrix. They analysed a number of different organochlorine compounds (PCBs, the DDT group, HCB and the HCHs) at concentration levels of sub- g/kg in milk fat, by using an on-line LC – GC (ECD) system using partially concurrent eluent evaporation. Figure 10.13 shows the GC chromatogram obtained after on-line LC – GC (ECD) of a human milk analysed for PCBs.
Figure 10.13 GC chromatogram obtained after on-line LC – GC(ECD) of a human milk sample analysed for PCBs (attenuation 64). Peak identification is as follows: (1) PCB 28;
(2) PCB 118; (3) PCB 153; (4) PCB 138; (5) PCB 180; (6) PCB 170; (7) PCB 207. Reprinted from Journal of High Resolution Chromatography, 20, G. R. van der Hoff et al.,
‘Determination of organochlorine compounds in fatty matrices: application of normal-phase LC clean-up coupled on-line to GC/ECD’, pp. 222 – 226, 1997, with permission from WileyVCH.
Foods, Flavours and Fragrances Applications |
241 |
10.5 MULTIDIMENSIONAL CHROMATOGRAPHIC METHODS WHICH INVOLVE THE USE OF SUPERCRITICAL FLUIDS
Supercritical fluid extraction (SFE) has been extensively used for the extraction of volatile components such as essential oils, flavours and aromas from plant materials on an industrial as well as an analytical scale (61). The extract thus obtained is usually analysed by GC. Off-line SFE – GC is frequently employed, but on-line SFE – GC has also been used. The direct coupling of SFE with supercritical fluid chromatography (SFC) has also been successfully caried out. Coupling SFE with SFC provides several advantages for the separation and detection of organic substances: low temperatures can be used for both SFE and SFC, so they are well suited for the analysis of natural materials that contain compounds which are temperaturesensitive, such as flavours and fragrances.
Different approaches have been developed for the direct coupling of SFE and GC. Hawthorne et al. (62,63) analysed various flavour and fragrance compounds of natural products extracted with supercritical (SC) CO2 by depositing the extracted analytes coming from the extraction cell outlet restrictor directly inside the GC capillary column through the on-column injector, which was cooled to cryogenically trap the analyte species at an appropriate oven temperature. Another approach was developed by Hartonen et al. (64). These authors used a cryotrap thermal desorption unit external to the GC to collect the extracted compounds and introduce them into the GC column. In this way, the supercritical fluid used for the extraction does not flow through the separation column, thus increasing the lifetime of the latter. The extracted compounds are focused not only by selecting the lowest possible trapping temperature, but also by a low initial GC temperature. In this way, the separation of very volatile compounds is more efficient and more reproducible.
Selected applications of coupled SFE – SFC consider the analysis of tocopherols in plants and oil by-products (65) or the analysis of lipid-soluble vitamins (66) by using a dynamic on-line SFE-SFC coupling, integrated in the SF chromatograph, based on the use of micropacked columns.
A method which uses supercritical fluid/solid phase extraction/supercritical fluid chromatography (SF SPE SFC) has been developed for the analysis of trace constituents in complex matrices (67). By using this technique, extraction and clean-up are accomplished in one step using unmodified SC CO2. This step is monitored by a photodiode-array detector which allows fractionation. Figure 10.14 shows a schematic representation of the SF/SPE/SFC set-up. This system allowed selective retention of the sample matrices while eluting and depositing the analytes of interest in the cryogenic trap. Application to the analysis of pesticides from lipid sample matrices have been reported. In this case, the lipids were completely separated from the pesticides.
Analogous to HPLC – HRGC, the combination of packed column SFC and capillary column GC can be used for the analysis of complex samples. The advantage of SFC/GC with respect to HPLC/GC is the absence of problems associated with the evaporation of the HPLC mobile phase prior to the GC analysis.
