

Multidimensional Chromatography
.pdf318 |
Multidimensional Chromatography |
Figure 12.11 Coupled SEC – RPLC separation of compound Chemigum rubber stock:
(a) SEC trace; (b) RPLC trace of fraction 1, dibutylphthalate; (c) RPLC trace of fraction 2, elemental sulfur. Coupled SEC conditions: MicroPak TSK 3000H (50 cm) 2000H (50 cm) 1000 H (80 cm) columns (8 mm i.d.); eluent, THF at a flow rate of 1 mL min; UV detection at 215 nm (1.0 a.u.f.s.); injection volume, 200 L. RPLC conditions: MicroPak MCH (25 cm 2.2 mm i.d.) column; flow rate, 0.5 mL/min; injection volume, 10 L; gradient, acetonitrile – water (20 : 80 v/v) to 100% acetonitrile at 3% acetonitrile/min; UV detection at 254 nm (0.05 a.u.f.s.). Reprinted from Journal of Chromatography, 149, E. L. Johnson et al., ‘Coupled column chromatography employing exclusion and a reversed phase. A potential general approach to sequential analysis’, pp. 571 – 585, copyright 1978, with permission from Elsevier Science.
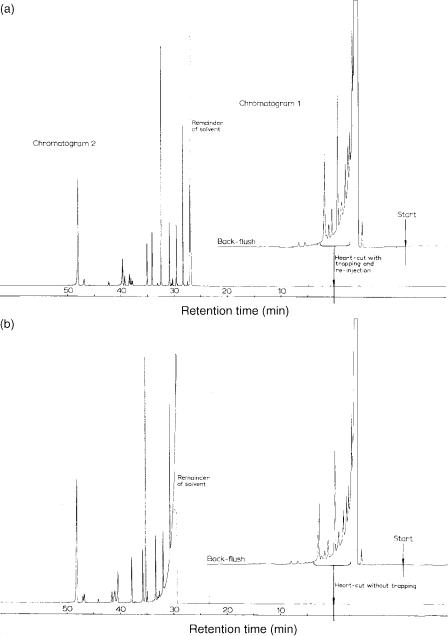
isopropyl ether has been carried out, as well as heart-cutting without trapping of the selected fractions (19). The reaction mixture was preseparated on a 20 m poly (propylene glycol) column and then re-injected on a Marlophen column (100 m 0.25 mm i.d.). The separation with trapping demonstrated the effectiveness of the trapping and re-injection procedure since more of the solvent peak that results from the fronting of the tail is eliminated and does not interfere by overlapping with peaks of higher retention on the second column. This allows well resolved chromatograms

Industrial and Polymer Applications |
319 |
Figure 12.12 Coupled SEC – RPLC separation of Plioflex rubber stock: (a) SEC; (b) RPLC trace of fraction 1, Wingstay 100 (Five-peak pattern is representative of diarylphenylenediamine isomers); (c) RPLC trace of fraction 2, mixed disulfide and MBTS (2,2´-thiobis (benzothiazole)). Obtained under the same conditions as given for Figure 12.11. Reprinted from Journal of Chromatography, 149, E. L. Johnson et al., ‘Coupled column chromatography employing exclusion and a reversed phase. A potential general approach to sequential analysis’, pp. 571 – 585, copyright 1978, with permission from Elsevier Science.
and higher peak intensities for trace components to be obtained, as can be seen in Figures 12.13(a) (with trapping) and 12.13(b) (without trapping).
Multi-column switching can be an effective approach for the determination of high and low concentrations of sample components in complex mixtures. This is a very powerful technique for the analytical and preparative separation of components
320 |
Multidimensional Chromatography |
Figure 12.13 Illustration of isothermal dual capillary column chromatography used for separation of UV photolysis products of methyl isopropyl ether. (a) Heart-cut and back-flushing at preseparation: chromatogram 1, PPG pre-column (20 m 0.25 mm i.d.); 55 °C, 0.2 bar N2; 3 L. Chromatogram 2, Marlophen main column (100 m 0.25 mm i.d.); 1.5 bar N2; sample, heart-cut from chromatogram 1. (b) Obtained under the same conditions as (a), but without trapping of the heart-cut. Reprinted with permission from Ref. (19).
Industrial and Polymer Applications |
321 |
that are not completely resolved, or not resolved at all, when using a single GC column.
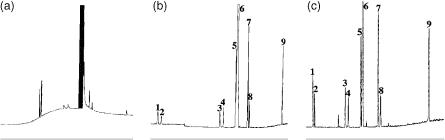
The determination of trace impurities in various major industrial materials such as gasoline, styrene and aniline by using a combination of programmed-temperature sample introduction, mass-flow-controlled multi-column dual-oven capillary gas chromatography and on-line mass spectrometry has been demonstrated (20). The cryotrapping at the inlet of the second column resulted in significant improvement in the resolution of critical peak pairs and reproducibility of the analysis. The multicolumn analysis of aniline was performed by using an OV-17 (25 m 0.32 mm i.d., df 1.0 m precolumn (Figure 12.14(a)) and an HP(1 – 50 m 0.32 mm i.d., df 1.05 m) second column. The shaded compound (peak) is solvent flushed via a splitline to permit detection by mass spectrometry of impurities in the aniline and also to prevent overloading of the MS detector. The analysis of aniline was carried out both with (Figure12.14(c)) and without cryotrapping (Figure 12.14(b)), where it is found that the use of cryotrapping leads to increased resolution between the phenol and aniline present in the sample.
Another example of multi-column analysis has been demonstrated for the determination of impurities in styrene. The marked compounds in the styrene sample (Figure 12.15(a)) were solvent flushed via a splitline, with the analysis being carried out with a cryotrapping separation (CTS) (see Figure 12.15(b)). The first column, was an Ultra-2 (25 m 0.32 mm i.d., df 0.25 m) precolumn, while the main column was a DB-WAX (30 m 0.32 mm, df 0.25 m) with an FID being employed as the detection system.
This multi-column swithching (GC – GC) technique has also been shown to be a powerful method for the separation of benzene and 1-methyl-cyclopentane in gasoline, as well as for the analysis of m-and p-xylenes in ethylbenzene.
Figure 12.14 Chromatographic analysis of aniline: (a) Precolumn chromatogram (the compound represented by the shaded peak is solvent flushed); (b) main column chromatogram without cryotrapping; (c) main column chromatogram with cryotrapping. Conditions: DCS, two columns and two ovens, with and without cryotrapping facilities: columns OV-17 (25 m 0.32 mm i.d., 1.0 m d.f.) and HP-1 (50 m 0.32 mm, 1.05 m df). Peak identification is as follows: 1, benzene; 2, cyclohexane; 3, cyclohexylamine; 4, cyclohexanol; 5, phenol; 6, aniline; 7, toluidine; 8, nitrobenzene; 9, dicyclohexylamine. Reprinted with permission from Ref. (20).
322 |
Multidimensional Chromatography |
Figure 12.15 Chromatographic analysis of styrene and its impurities: (a) precolumn chromatogram (the compound represented by the shaded peak is solvent flushed prior to transfer to the second column); (b) main column chromatogram with cryotrapping. Conditions: DCS, two columns and two ovens: CTS, columns, Ultra-2 (25 m 0.32 mm i.d., 0.52 m d.f.) and DB-WAX (30 m 0.32 mm i.d., 0.25 m df). Reprinted with permission from Ref. (20).
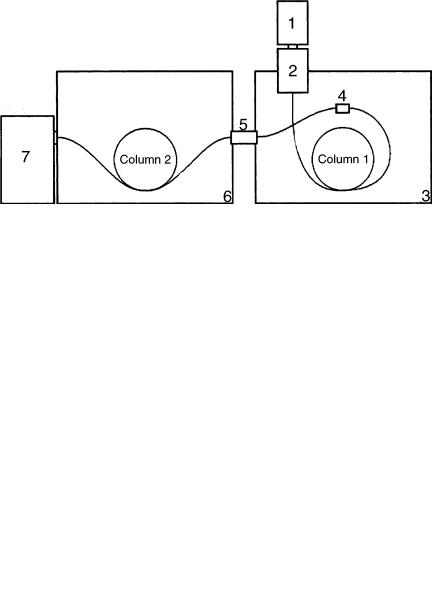
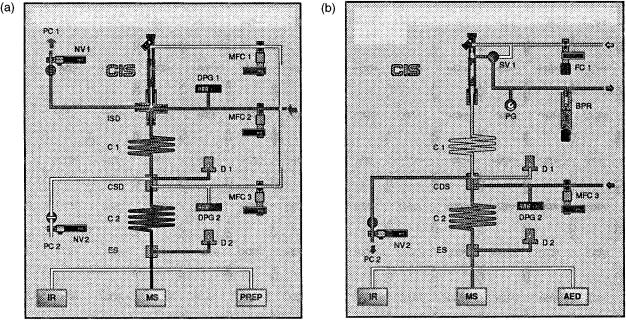
The system used to carry out such an analysis is shown in Figure 12.16 with the schematic diagrams of the dual-column switching (DCS) and multi-column switching (MCS) modules being presented in Figure 12.17. The solvent flush via the splitline is carried out when the MFC3 valve is open (Figure 12.17 (b)).
Figure 12.16 Schematic diagrams of the applied system involving cryotrapping, consisting of a manual or automated injector (1), a temperature-programmable cold-injection system with septumless sampling head (2), a gas chromatograph (3) configured with an FID monitor, column-switching-device (4) and MCS or DCS pneumatics, connected via a heated transfer line with an included cryotrap (5) to a second gas chromatograph (6) with a mass-selective detector (7) (MCS, multi-column switching; DCS, dual-column switching). Reprinted with permission from Ref. (20).
Applications Polymer and Industrial
Figure 12.17 Schematic diagrams of solvent-flush systems. (a) Dual-column MCS unit, which is positioned prior to the first column (C 1); flushing is carried out with both NV 1 and MFC 2 open. (b) Dual-column DCS unit; solvent flushing is carried out via the splitline, with MFC 3 open (NV, needle valve; MFC, mass flow control). Reprinted with permission from Ref. (20).
323
324 |
Multidimensional Chromatography |
12.8SFC – GC AND NORMAL PHASE-LC – SFC APPLICATIONS
Supercritical fluid chromatography (SFC) is an intermediate mode between gas and liquid chromatography which combines the best features of each of these techniques. This is a chromatographic technique in which the mobile phase is neither a liquid or a gas but a supercritical fluid, with physical properties that are intermediate between those of gases and liquids. Supercritical chromatography is of importance either in the first or second dimension since it permits the separation and determination of compounds that cannot be analyzed by HPLC or GC. Such compounds could be either non-volatile, of high molecular mass, reactive or thermally labile, thus making them unsuitable for GC. Thermally labile compounds could include polymer additives, with the low operating temperatures of SFC being important for the analysis of such compounds. In addition, one of the advantages that SFC has over HPLC is that when using CO2 as a mobile phase it can be easily interfaced to a multitude of detection systems, including UV, FID, MS and FTIR. SFC could also be an attractive alternative to normal phase LC and SEC for the analysis of high-molecular-mass species such as polymers and fossil fuels since SEC analyses are hindered by poor efficiency, while normal phase LC analysis lacks a universal detection system. Hence, SFC with FID detection allows the analysis of high-boiling petroleum fractions, group-type analysis of saturates, olefins and aromatics in petroleum fuels (21).
12.9NORMAL PHASE-LC – SFC APPLICATIONS
The use of microcolumn LC generates small peak volumes and allows the coupling of SFC by using a solvent-venting injection procedure. The preseparation of polymer additives from various polymers was carried out on a 320 m i.d. fused-silica column packed with 5 m polystyrene particles, using THF as the eluent (22). The low-molecular-weight additives (MW 1200) were eluted at the total permeation volume since they were more retained than their excluded polymer counterparts. The evaporation of the solvent from the collected fraction was carried out by flushing the loop with nitrogen gas, in turn leaving the polymer additives coated on the wall of the retention gap. The additives were then transferred to the SFC column by switching the liquid CO2 flow via the retention gap to the SFC system. The additives were focused by the effect of the higher temperature, while their separation was achieved by gradient elution by systematically changing the density of the supercritical fluid.
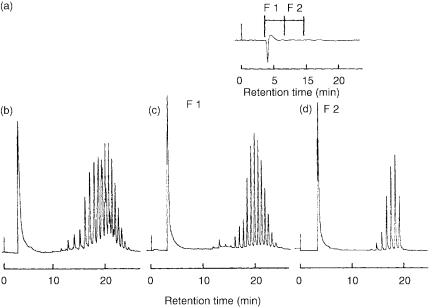
An application of an LC – SFC system has been demonstrated by the separation of non-ionic surfactants consisting of monoand di-laurates of poly (ethyleneglycol) (23). Without fractionation in the precolumn by normal phase HPLC (Figure 12.18 (a)) and transfer of the whole sample into the SFC system, the different homologues coeluted with each other. (Figure 12.18(b)). In contrast with prior fractionation by HPLC into two fractions and consequent analysis by SFC, the homologues in the two fractions were well resolved (Figures 12.18(c) and 12.18(d)).
Industrial and Polymer Applications |
325 |
Figure 12.18 LC – SFC analysis of monoand di-laurates of poly(ethylene glycol) (n 10) in a surfactant sample: (a) normal phase HPLC trace; (b) chromatogram obtained without prior fractionation; (c) chromatogram of fraction 1 (F1); (d) chromatogram of fraction 2 (F2). LC conditions: column (20 cm 0.25 cm i.d.) packed with Shimpak diol; mobile phase, n-hexane methylene chloride ethanol (75 25 1); flow rate, 4 L min; UV detection at 220 nm. SFC conditions: fused-silica capillary column (15 m 0.1 mm i.d.) with OV-17 (0.25m film thickness); Pressure-programmed at a rate of 10 atm min from 80 atm to 150 atm, and then at a rate of 5 atm min; FID detection. Reprinted with permission from Ref. (23).
12.10SFC–GC APPLICATIONS
An on-line supercritical fluid chromatography – capillary gas chromatography (SFC – GC) technique has been demonstrated for the direct transfer of SFC fractions from a packed column SFC system to a GC system. This technique has been applied in the analysis of industrial samples such as aviation fuel (24). This type of coupled technique is sometimes more advantageous than the traditional LC – GC coupled technique since SFC is compatible with GC, because most supercritical fluids decompress into gases at GC conditions and are not detected by flame-ioniza- tion detection. The use of solvent evaporation techniques are not necessary. SFC, in the same way as LC, can be used to preseparate a sample into classes of compounds where the individual components can then be analyzed and quantified by GC. The supercritical fluid sample effluent is decompressed through a restrictor directly into a capillary GC injection port. In addition, this technique allows selective or multistep heart-cutting of various sample peaks as they elute from the supercritical fluid
326 |
Multidimensional Chromatography |
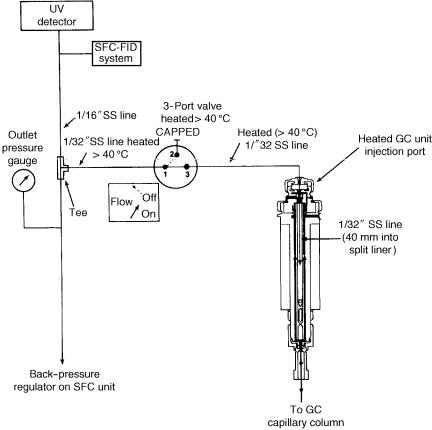
chromatograph. The determination of the heart-cut times are achieved by monitoring the response from the on-line ultraviolet absorbance and flame ionization detectors. A schematic diagram of the instrumental setup used for these analyses is given in Figure 12.19.
In addition, solute focusing is possible by maintaining a low initial temperature (e.g. 40 °C) for a long period of time (8 – 12 min ) to allow the mixture of decompressed carbon dioxide, helium gas and the solutes to focus on the GC column. The optimization of the GC inlet temperature can also lead to increased solute focusing. After supercritical fluid analysis, the SF fluid effluent is decompressed through a heated capillary restrictor from a packed column (4.6 mm i.d.) directly into a hot GC split vaporization injector.
Figure 12.19 Schematic diagram of the interface system used for supercritical fluid chromatography – gas chromatography. Reprinted from Journal of High Resolution Chromatography, 10, J. M. Levy et al., ‘On-line multidimensional supercritical fluid chromatography capillary gas chromatography’, pp. 337 – 341, 1987, with permission from Wiley-VCH.
Industrial and Polymer Applications |
327 |
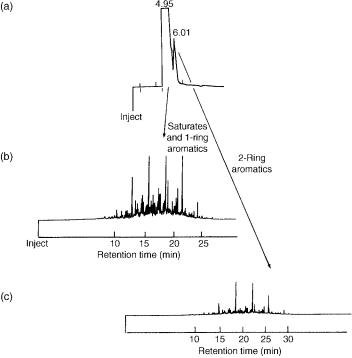
The preseparation utilized a 5 m cyano column (250 cm 4.6 mm i.d.) and a 5 m silica column (250 cm 4.6 mm i.d.) in series, followed by GC analysis on an SE-54 column (25 m 0.2 mm i.d., 0.33 m film thickness). The SFC system separated the aviation sample into two peaks, including saturates and single-ring aromatics as the first peak, and two-ring aromatic fractions as the second peak. These fractions were selectively cut and then transferred to the GC unit for further analysis. (Figure 12.20).
Another application of SFC – GC was for the isolation of chrysene, a polyaromatic hydrocarbon, from a complex liquid hydrocarbon industrial sample (24). A 5 m octadecyl column (200 cm 4.6 mm i.d.) was used for the preseparation, followed by GC analysis on an SE-54 column (25 m 0.2 mm i.d., 0.33 m film thickness). The direct analysis of whole samples transferred from the supercritical fluid chromatograph and selective and multi-heart-cutting of a particular region as it elutes from the SFC system was demonstrated. The heart-cutting technique allows the possibility of separating a trace component from a complex mixture (Figure 12.21).
Figure 12.20 SFC – GC analysis of a sample of aviation fuel: (a) SFC separation into two peaks; (b and c) corresponding GC traces of the respective peaks (flame-ionization detection used throughout). Reprinted from Journal of High Resolution Chromatography, 10, J. M. Levy et al., ‘On-line multidimensional supercritical fluid chromatography capillary gas chromatography’, pp. 337 –341, 1987, with permission from Wiley-VCH.