

Multidimensional Chromatography
.pdf222 |
Multidimensional Chromatography |
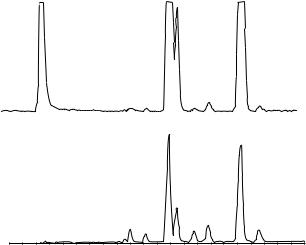
Figure 10.1 Analysis of racemic 2,5-dimethyl-4-hydroxy-3[2H]-furanone (1) obtained from a ‘strawberry’ tea, flavoured with the synthetic racemate of 1 (natural component), using an MDGC procedure: (a) dichloromethane extract of the flavoured ‘strawberry’ tea, analysed on a Carbowax 20M pre-column (60 m, 0.32 mm i.d., 0.25 m film thickness; carrier gas H2, 1.95 bar; 170 °C isothermal); (b) chirospecific analysis of (1) from the strawberry tea extract, transferred for stereoanalysis by using a permethylated -cyclodextrin column (47 m 0.23 mm i.d.; carrier gas H2, 1.70 bar; 110 °C isothermal). Reprinted from Journal of High Resolution Chromatography, 13, A. Mosandl et al., ‘Stereoisomeric flavor compounds. XLIV: enantioselective analysis of some important flavor molecules’, pp. 660 – 662, 1990, with permission from Wiley-VCH.
Mondello et al. (2, 20 – 23) have used a multidimensional gas chromatographic system based on the use of mechanical valves which were stable at high temperatures developed in their laboratory for the determination of the enantiomeric distribution of monoterpene hydrocarbons ( -pinene, sabinene and limonene) and monoterpene alcohols (linalol, terpinen-4-ol and -terpineol) of citrus oils (lemon, mandarin, lime and bergamot). Linalyl acetate was also studied in bergamot oil. The system consisted of two Shimadzu Model 17 gas chromatographs, a six-port twoposition valve and a hot transfer line. The system made it possible to carry out fully
Foods, Flavours and Fragrances Applications |
223 |
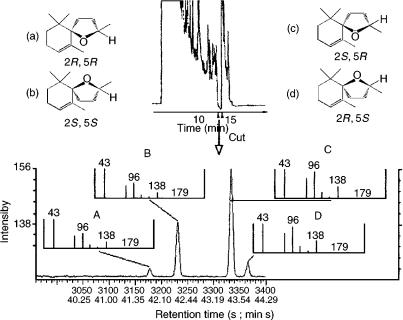
Figure 10.2 MDGC – MS differentiation between the enantiomers of theaspiranes in an aglycone fraction from purple passion fruit: DB5 pre-column (25 m 0.25 mm i.d., 0.25 m film thickness; carrier gas He, 0.66 ml/min; oven temperature, 60 – 300 °C at 10 °C/min with a final hold of 25 min); permethylated -cyclodextrin column (25 m 0.25 mm i.d., 0.25 m film thickness; carrier gas He, 1.96 ml/min; 80 °C isothermal for 20 min and then programmed to 220 °C at 2 °C/min). Reprinted from Journal of High Resolution Chromatography, 16, G. Full et al., ‘MDGC – MS: a powerful tool for enantioselective flavor analysis’, pp. 642 – 644, 1993, with permission from Wiley-VCH.
automated multiple transfers, because retention times on the pre-column were reproducible even for those components eluted after numerous transfers. Moreover, when the MDGC system was not used, the two chromatographs can be operated independently without any hardware modification. Figure 10.3 shows chromatograms of a cold pressed lemon oil obtained with an SE-52 pre-column and the system in the stand-by position, the same oil obtained with the SE-52 column and the system in the cut position, and that obtained with the chiral column (modified -cyclodextrin) for the fractions transferred from the pre-column.
Table 10.2 reports some results obtained for cold-pressed and distilled citrus oils. As can be seen, the values obtained are characteristic of the different oils, and can be used as references for the authenticity and quality of the oil.
In recent years, together with enantioselective analysis, the determination of the natural abundance of stable isotopes by means of stable isotope ratio mass spectrometry (IRMS) can be very useful for the assignment of the origin of foods and food ingredients, and of authenticity evaluation (24).

224 |
Multidimensional Chromatography |
Figure 10.3 Gas chromatograms of a cold-pressed lemon oil obtained (a) with an SE-52 column in the stand-by position and (b) with the same column showing the five heart-cuts;
(c) shows the GC – GC chiral chromatogram of the transferred components. The asterisks in
(b) indicate electric spikes coming from the valve switching. The conditions were as follows: SE-52 pre-column, 30 m, 0.32 mm i.d., 0.40 – 0.45 m film thickness; carrier gas He, 90 KPa (stand-by position) and 170 KPa (cut position); oven temperature, 45 °C (6 min ) – 240 °C at 2 °C/min: diethyl-tert-butyl- -cyclodextrin column, 25 m 0.25 mm i.d., 0.25 m film thickness; carrier gas He, 110 KPa (stand-by position) and 5 KPa (cut position); oven temperature, 45 °C (6 min), rising to 90 °C (10 min) at 2 °C/min, and then to 230 °C at 2 °C/min. Reprinted from Journal of High Resolution Chromatography, 22, L. Mondello et al.,
‘Multidimensional capillary GC– GC for the analysis of real complex samples. Part IV. Enantiomeric distribution of monoterpene hydrocarbons and monoterpene alcohols of lemon oils’, pp. 350 – 356, 1999, with permission from Wiley-VCH.

Table 10.2 Enantiomeric distribution of various components in cold-pressed and distilled citrus oils (2, 20 – 23)
|
|
|
|
Cold-pressed |
|
|
|
Cold-pressed |
|
|
|
Distilled |
|
|
|
Cold-pressed |
|
|
|
Distilled |
|
|||||
|
|
|
|
key lime |
|
|
|
Persian lime |
|
|
|
lime |
|
|
|
|
Bergamot |
|
|
|
Bergamot |
|
||||
|
|
|
|
|
|
|
|
|
|
|
|
|
|
|
|
|||||||||||
Component |
( ) |
( ) |
( ) |
( ) |
( ) |
( ) |
( ) |
( ) |
( ) |
( ) |
||||||||||||||||
|
|
|
|
|
|
|
|
|
|
|
|
|
|
|
|
|
|
|
|
|
|
|
|
|
|
|
-Pinene |
3.4 |
– 3.5 |
96.6 |
– 96.5 |
9.1 |
– 10.3 |
90.9 |
– 89.7 |
3.2 |
– 4.0 |
96.8 |
– 96.0 |
6.8 |
– 9.5 |
93.2 |
– 90.5 |
8.9 |
– 8.2 |
91.1 |
– 91.8 |
||||||
Sabinene |
15.1 |
– 15.2 |
84.9 |
– 84.8 |
18.2 |
– 23.4 |
81.8 |
– 76.6 |
|
|
– |
|
– |
14.1 |
– 18.8 |
85.9 |
– 81.2 |
15.9 |
– 15.2 |
84.1 |
– 84.8 |
|||||
Limonene |
97.1– 98.2 |
2.9 |
–1.8 |
96.6 |
– 97.3 |
0.4 |
– 2.7 |
94.5 |
– 91.3 |
5.5 |
– 8.7 |
98.1 |
– 97.3 |
1.9 |
– 2.7 |
98.0 |
– 97.7 |
2.0 |
– 2.3 |
|||||||
Linalol |
29.8 |
– 28.5 |
70.2 |
– 71.5 |
45.6 |
– 30.7 |
54.4 |
– 69.3 |
50.2 |
– 50.0 |
49.8 |
– 50.0 |
0.6 |
– 0.3 |
99.4 |
– 99.7 |
18.4 |
– 1.3 |
81.6 |
– 98.7 |
||||||
Terpinen-4-ol |
29.2 |
– 29.5 |
70.8 |
– 70.5 |
18.6 |
– 24.9 |
81.4 |
– 75.1 |
42.3 |
– 45.0 |
57.7 |
– 55.0 |
9.7 |
– 26.3 |
90.3 |
– 73.7 |
31.8 |
– 27.1 |
68.1 |
– 72.9 |
||||||
-Terpineol |
17.2 |
– 14.5 |
82.8 |
– 85.5 |
25.5 |
– 19.2 |
74.5 |
– 80.8 |
46.7 |
– 43.2 |
53.3 |
– 56.8 |
82.5 |
– 30.6 |
17.5 |
– 69.4 |
73.4 |
– 88.8 |
26.6 |
– 11.2 |
||||||
Linalyl acetate |
|
|
– |
|
– |
|
|
– |
|
– |
|
|
– |
|
– |
0.3 |
– 0.1 |
99.7 – 99.9 |
|
1.1 – 0.9 |
98.9 |
– 99.1 |
||||
|
|
|
|
|
|
|
|
|
|
|
|
|
|
|
|
|
|
|
|
|
|
|
|
|
|
|
|
|
|
|
|
|
|
|
|
|
|
|
|
|
|
|
|
|
|
|
|
|
|
|
|
|
|
|
|
|
Cold-pressed |
|
|
|
Distilled |
|
|
|
Cold pressed |
|
|
|
Distilled |
|
||||
|
|
|
mandarin |
|
|
|
mandarin |
|
|
|
lemon |
|
|
|
lemon |
|
||||
|
|
|
|
|
|
|
|
|
|
|
|
|
||||||||
Component |
( ) |
( ) |
( ) |
( ) |
( ) |
( ) |
( ) |
( ) |
||||||||||||
|
|
|
|
|
|
|
|
|
|
|
|
|
|
|
|
|
||||
-Pinene |
97.0 |
– 98.8 |
3.0 |
– |
1.2 |
96.1 – 97.7 |
3.9 |
– 2.3 |
4.2 |
– 7.0 |
95.8 |
– 93.0 |
6.4 |
– 6.6 |
93.6 |
– 93.4 |
||||
Sabinene |
76.2 |
– 80.5 |
23.8 |
– |
19.5 |
77.8 – 79.9 |
22.2 |
– 20.1 |
12.5 |
– 15.3 |
87.5 |
– 84.7 |
14.6 |
– 12.7 |
85.4 |
– 87.3 |
||||
Limonene |
98.0 |
– 97.7 |
2.0 |
– |
2.3 |
98.3 – 97.8 |
1.7 |
– 2.2 |
98.0 |
– 98.5 |
2.0 |
– 1.5 |
98.3 |
– 98.3 |
1.7 |
– 1.7 |
||||
Linalol |
86.9 |
– 80.2 |
13.1 |
– |
19.8 |
83.7 – 79.6 |
16.3 |
– 20.4 |
28.5 |
– 49.2 |
71.5 |
– 50.8 |
40.0 |
– 46.9 |
60.0 |
– 53.1 |
||||
Terpinen-4-ol |
10.0 |
– 19.2 |
90.0 |
– |
81.8 |
25.3 – 28.7 |
74.7 |
– 71.3 |
13.7 |
– 26.9 |
86.3 |
– 73.1 |
28.5 |
– 28.4 |
71.5 |
– 71.6 |
||||
-Terpineol |
30.4 |
– 23.2 |
69.6 |
– |
76.8 |
38.8 – 26.6 |
61.2 |
– 73.4 |
18.0 |
– 35.8 |
82.0 |
– 64.2 |
23.6 |
– 23.0 |
76.4 |
– 77.0 |
||||
Linalyl acetate |
|
|
– |
|
– |
|
|
– |
|
– |
|
|
– |
– |
|
|
– |
|
– |
|
|
|
|
|
|
|
|
|
|
|
|
|
|
|
|
|
|
|
|
|
|
226 |
|
|
Multidimensional Chromatography |
|
|
|
Auxiliary gas |
|
|
|
PR2 |
|
|
|
Carrier gas |
|
SV2 |
SV4 |
|
NV+ He |
|
|||
PR1 |
NV− |
FID3 Open split |
46 |
|
|
SV1 |
|
Furnace |
45 |
Injector |
|
Cryogenic |
44 |
|
|
|
trap |
|
|
|
|
|
He |
Ion source |
|
Column 1 |
FID1 FID2 Column 2 |
|
|
|
|
|
||
|
Split |
Live-T |
SV3 |
|
|
Switching device |
|
||
|
|
|
||
|
|
|
CO2 |
|
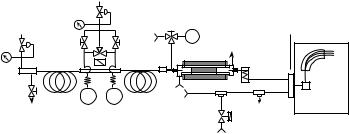
Figure 10.4 Schematic representation of the multidimensional GC – IRMS system developed by Nitz et al. (27): PR1 and PR2, pressure regulators; SV1 – SV4, solenoid valves; NV and NV , needle valves; FID 1– FID3, flame-ionization detectors. Reprinted from
Journal of High Resolution Chromatography, 15, S. Nitz et al., ‘Multidimensional gas chromatography – isotope ratio mass spectrometry, (MDGC – IRMS). Part A: system description and technical requirements’, pp. 387 – 391, 1992, with permission from Wiley-VCH.
Conventional IRMS requires relatively large sample volumes in a purified gaseous form. Recently, an ‘on-line’ GC – IRMS system has been developed which combines the high purification effect of GC with the utmost precision of IRMS. Sometimes this system may not be sufficient to determine characteristic minor components from complex matrices, and therefore MDGC– IRMS systems have been developed for the analysis of complex plant extracts and flavour components (25 – 27).
Figure 10.4 shows a schematic representation of the multidimensional GC – IRMS system developed by Nitz et al. (27). The performance of this system is demonstrated with an application from the field of flavour analysis. A Siemens SiChromat 2 – 8 double-oven gas chromatograph equipped with two FIDs, a live-T switching device and two capillary columns was coupled on-line with a triple-collec- tor (masses 44, 45 and 46) isotope ratio mass spectrometer via a high efficiency combustion furnace. The column eluate could be directed either to FID3 or to the MS by means of a modified ‘Deans switching system’.
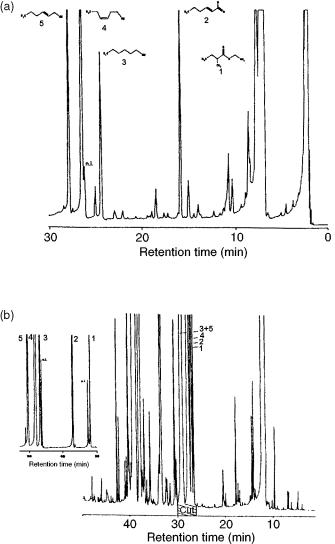
Figure 10.5 shows the gas chromatograms obtained from a natural cis-3-hexen- 1-ol fraction after GC – IRMS (a) and MDGC – IRMS (b) analysis. These authors studied the applicability of the multidimensional method by comparing the 13C values of the components determined by the two methods. The data obtained are reported in Table 10.3. The well-separated compounds (trans-2-hexenal and trans-2- hexen-1-ol) in both measurements show good congruity. Studies carried out with standard mixtures showed that MDGC – IRMS analysis can give better precision, because standard deviation data are significantly lower than those obtained by conventional GC – IRMS analysis.
In 1998, another application of MDGC – IRMS analysis was developed (25). A Siemens SiChromat 2 – 8 MDGC system, connected to a Finnigan MAT Delta S
Foods, Flavours and Fragrances Applications |
227 |
Figure 10.5 (a) Gas chromatogram obtained from a natural cis-3-hexen-1-ol fraction after unidimensional separation: CPWax-52-CB column 25 m, 0.32 mm i.d., 1.2 m film thickness; carrier gas He, 0.7 bar; oven temperature, 60 °C (5 min ) – 180 °C at 2 °C/min). (b) Gas chromatogram obtained from a natural cis-3-hexen-1-ol fraction after multidimensional separation: SPB-5 pre-column, 30 m 0.25 mm i.d., 1 m film thickness; carrier gas He, 1.8 bar; oven temperature; 60 °C (5 min ) – 100 °C at 2 °C/min with a hold of 5 min and then programmed to 220 °C at 5 °C/min; DB-Wax column 30 m 0.25 mm i.d., 0.25 m film thickness; carrier gas He, 1.3 bar; oven temperature 60 °C (5 min), then rising to 220 °C at 2 °C/min (cf. Table 10.3). Reprinted from Journal of High Resolution Chromatography, 15, S. Nitz et al., ‘Multidimensional gas chromatography – isotope ratio mass spectrometry, (MDGC – IRMS). Part A: system description and technical requirements’, pp. 387 – 391, 1992, with permission from Wiley-VCH.
228 |
|
|
Multidimensional Chromatography |
|
Table 10.3 |
13C values of the various components of a natural cis-3-hexen-1-ol fraction |
|||
(cf. Figure 10.5) (27) |
|
|
|
|
|
|
|
|
|
|
|
|
13C values (n 5) |
|
No.a |
Component |
Conventional GC — IRMSb |
MDGC-IRMSb |
|
1 |
Ethyl 2-methylbutyrate |
– |
|
27.20 0.4 |
2 |
trans-2-Hexenal |
29.23 0.3 |
29.71 0.3 |
|
3 |
1-Hexanol |
30.91 |
0.3 |
32.49 0.2 |
4 |
cis-3-Hexen-1-ol |
32.95 |
0.2 |
34.99 0.4 |
5 |
trans-2-Hexen-1-ol |
31.09 |
0.5 |
31.12 0.3 |
|
|
|
|
|
aNumbering as shown on Figure 10.5.
bValues given relative to the universal standard PDB (Belemnitella americana from the Cretaceous Pedee formation, South California, USA).
Reprinted from Journal of High Resolution Chromatography, 15, S. Nitz et al., ‘Multidimensional gas chromatography – isotype ratio mass spectrometry (MDGC – IRMS). Part A: system description and technical requirements, pp. 387 – 391, 1992, with permission from Wiley-VCH.
isotope mass spectrometer via a combustion interface was employed. The results confirmed those previously obtained by Nitz et al. (27), as follows:
• the 13C values obtained by MDGC – IRMS are in agreement with those obtained by GC – IRMS and also elemental analysis measurements;
•the precision of the measurements expressed as standard deviations is significantly lower than 0.03‰;
•the results demonstrated the absence of isotope discrimination and systematical errors due to the MDGC system with live switching by ‘live T-piece’ coupling.
The authors demonstrated the importance that correct use of the MDGC – IRMS system is essential for the achievement of precise and accurate measurements. Table 10.4 reports the GC – IRMS measurements of some standard reference materials, obtained with different cut conditions. As can be seen from this table, premature cuts result in 13C values which are significantly higher than the true values, while delayed cuts give lower 13C values. This fact indicates that the beginning of the peak is enriched in 13C, while the end is depleted.
Table 10.4 GC–IRMS |
measurements of |
standard reference |
materials obtained under |
different cut conditions (25) |
|
|
|
|
|
|
|
|
|
13C (‰) |
|
|
|
|
|
Condition |
5-Nonanone |
Menthol |
(R)- -Decalactone |
|
|
|
|
Complete cuts |
27.84 |
26.61 |
30.05 |
Premature cuts |
3.58 |
14.70 |
13.09 |
Delayed cuts |
57.06 |
71.60 |
91.28 |
|
|
|
|
Reprinted from Journal of High Resolution Chromatography, 21, D. Juchelka et al., ‘Multidimensional gas chromatography coupled on-line with isotype ratio mass spectrometry (MDGC–IRMS): progress in the analytical authentication of genuine flavor components’, pp. 145–151, 1998, with permission from Wiley-VCH.
Foods, Flavours and Fragrances Applications |
229 |
Wines and other alcoholic beverages such as distillates represent very complex mixtures of aromatic compounds in an ethanol –water mixture. Once an extract or concentrate of the required compounds is prepared, a suitable chromatographic system must be used to allow separation and resolution of the species of interest. Many applications have been developed that use MDGC.
In 1991, Askari et al. (28) carried out the direct determination of the enantiomeric distribution of the monoterpene alcohols ( -terpineol, linalol, and the furanoid linalol oxides) in muscat grapes, musts and wines by using MDGC analysis. This work was carried out on trichlorofluoromethane extracts, using a SiChromat 2 chromatograph equipped with a Carbowax 20M pre-column and differently modified-cyclodextrin columns. The results obtained for fresh grape juices show characteristic enantiomeric ratios for monoterpene alcohols (stereo-controlled enzimatic biogenesis), while the same alcohols are present as a racemic mixture in the corresponding wines.
Sotolon (4,5-dimethyl-3-hydroxy-2(5H)-furanone) and solerone (4-acetyl--butirrolactone) were claimed to be responsible for some aroma characteristic of flor sherries wines. These compounds are present only as traces, and are chemically unstable. A system of two gas chromatographs coupled with a four-port switching valve was used to quantitate these components without previous fractionation. The first chromatograph was equipped with an on-column injector, in order to avoid thermal degradation of sotolon in the heated injector, a DB-5 column and an FID. The second chromatograph was equipped with an on-column injector, a DB-1701 column and an FID. The method allowed quantification of solerone and sotolon at concentrations as low as a few ppb (29).
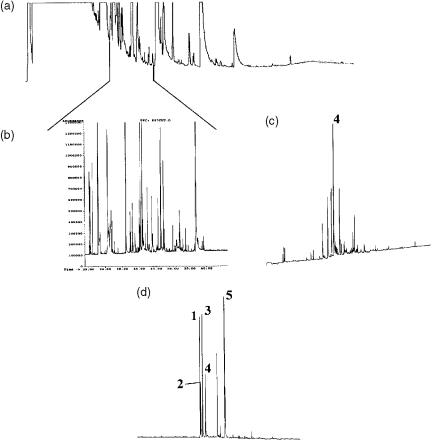
The use of specific detectors together with the MDGC system can help in the identification of specific compounds, for example, those containing nitrogen and sulfur, present in very low concentrations in complex matrices. An MDGC system that consists of a temperature-programmed cold injection system, a multicolumn switching system (Gerstel), and two HP 5890 GC ovens connected by a cryotrap interface, has been used for the analysis of nitrogen and sulfur components of a whiskey extract. The second oven was equipped with a mass-selective detector, a chemiluminescence sulfur detector and a nitrogen thermionic detector (30). Figure 10.6 shows a selected cut from the pre-column (Carbowax 20M), cryofocused and passed into the main column (5% polydimethylsiloxane) for simultaneous sulfur and nitrogen MS detection. Some sulfur and nitrogen compounds were easily located in the TIC trace from their respective specific traces, and could thus be readily identified.
Another way to improve the analysis of complex matrices can be the combination of a multidimensional system with information-rich spectral detection (31). The analysis of eucalyptus and cascarilla bark essential oils has been carried out with an MDGC instrument, coupling a fast second chromatograph with a matrix isolation infrared spectrometer. Eluents from the first column were heart-cut and transferred to a cryogenically cooled trap. The trap is then heated to re-inject the components into an analytical column of different selectivity for separation and subsequent detection. The problem of the mismatch between the speed of fast separation and the
230 |
Multidimensional Chromatography |
Figure 10.6 Analysis of nitrogenand sulfur-containing compounds using an MDGC system: (a) pre-column chromatogram; (b) main column chromatogram, TIC; (c) main column chromatogram, nitrogen trace; (d) main column chromatogram, sulfur trace of the selected cut shown in A, of a whiskey extract. The conditions were as follows: precolumn, Carbowax 20M, 15 m 0.25 mm i.d., 0.25 m film thickness; main column, 5% diphenylpolysiloxane, 60 m 0.25 mm i.d., 0.25 m film thickness; column segments to selective detectors, 5 m; column segment to MS detector, 15 m. Reprinted from Proceedings of the 15th International Symposium on Capillary Chromatography, K. MacNamara and A. Hoffmann, ‘Simultaneous nitrogen, sulphur and mass spectrometric analysis after multi-column switching of complex whiskey flavour extracts’, 1993, with permission from Prof. P. Sandra.
slow response of the IR spectrometer was solved by the use of an efficient off-line interface. The matrix isolated eluents can be analysed by infrared spectrometry in a near real-time analysis. Figure 10.7 shows the separation of a fraction of eucalyptus oil. By using this technique, even minor components can be detected with sufficient IR spectral quality to permit their identification by a spectral library search.
Foods, Flavours and Fragrances Applications |
|
231 |
||
(a) |
1 |
4 |
5 |
8 |
|
|
|
||
|
|
|
|
|
2 |
7 |
9 |
3 |
|
(b)
1.10 1.20 1.30 1.40 1.50 1.60 1.70 1.80 1.90 2.00 2.10 2.20 Retention time (min)
Figure 10.7 (a) IR reconstructed chromatogram and (b) FID chromatogram of a fraction of the eucalyptus oil transferred from a DB-Wax column. The secondary separation was carried out by using an RTX-1701 column, isothermally at 95 °C with a linear velocity of ~90 cm/s. Peak identification is as follows: (1) water; (2) -pinene; (3) camphene; (4) sabinene; (5) - pinene; (6) -phellandrene; (7) -terpinene; (8) unknown; (9) -terpinene. Reprinted from Analytical Chemistry, 66, N. Ragunathan et al., ‘Multidimensional fast gas chromatography with matrix isolation infrared detection’, pp. 3751 – 3756, copyright 1994, with permission from the American Chemical Society.
10.3 MULTIDIMENSIONAL HIGH PERFORMANCE LIQUID CHROMATOGRAPHY
Multidimensional HPLC offers very high separation power when compared to monodimensional LC analysis. Thus, it can be applied to the analysis of very complex mixtures. Applications of on-line MD-HPLC have been developed, using various techniques such as heart-cut, on-column concentration or trace enrichment; applications in which liquid phases on both columns are miscible and compatible are frequently reported, but the on-line coupling of columns with incompatible mobile phases have also been studied.
The on-line combination of high performance gel filtration chromatography (GFC), using aqueous compatible, rigid microparticulate exclusion columns, and reversed-phase chromatography (RPC), using C18 columns, have been employed by Enri and Frei (32) to separate senna glicoside extracts. This combination is ideal from the standpoint that the solvents in both techniques are compatible. Another example of this technique is the analysis of vitamin B in a protein food (33). The size-exclusion chromatography (SEC) system consisted of a Micropak TSK-2000