

Multidimensional Chromatography
.pdfMultidimensional Chromatography in Environmental Analysis |
349 |
Figure 13.6 Direct RPLC analysis of a blank ground water sample spiked with 4.5 ( g l 1 ETU, (a) with and (b) without column-switching. A 60 4.6 mm i.d. column and a 150 4.6 mm i.d. column were used for C-1 and C-2, respectively, with pure water as M-1 and methanol – 0.025 M ammonium acetate (pH, 7.5) (5:95, v/v) as M-2; S-1 and S-2 are the interfering peaks. Reprinted from Chromatographia, 31, E. A. Hogendoorn et al., ‘Columnswitching RPLC for the trace-level determination of ethylenethiourea in aqueous samples’, pp. 285 – 292, 1991, with permission from Vieweg Publishing.
Since only a small fraction of the interfering material reaches the second column and subsequently the detector, the next analysis can start after the analyte has been transferred to column 2. This provides a high throughput (about 7 samples per hour).
This method can also be used to analyse soil samples. For instance, fenpropimorph, which is a non-polar pesticide with good UV sensitivity but poor selectivity, has, after treatment, been determined in soil samples (31). In this example, an amount of soil was extracted overnight with acetonitrile; this was then poured into a Buchner filter and rinsed with the same solvent. The acetonitrile solution was concentrated and, prior to LC analysis, the extract was diluted with water and 100 l were then injected into the LC system.
350 |
Multidimensional Chromatography |
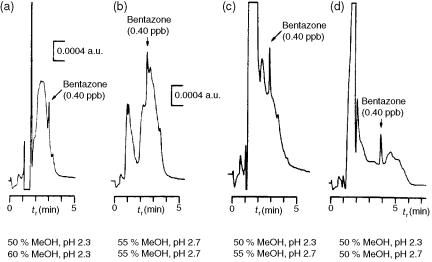
Figure 13.7 Selectivity effected by employing different step gradients in the coupledcolumn RPLC analysis of a surface water containing 0.40 g l 1 bentazone, by using direct sample injection (2.00 ml). Clean-up volumes, (a), (c) and (d) 4.65 ml of M-1, and (b) 3.75 ml of M-1: transfer volumes, (a), (c) and (d), 0.50 ml of M-1, and (b), 0.40 ml of M-1. The displayed chromatograms start after clean-up on the first column. Reprinted from Journal of Chromatography, A 644, E. A. Hogendoorn et al., ‘Coupled-column reversed-phase liquid chromatography-UV analyser for the determination of polar pesticides in water’, pp. 307 – 314, copyright 1993, with permission from Elsevier Science.
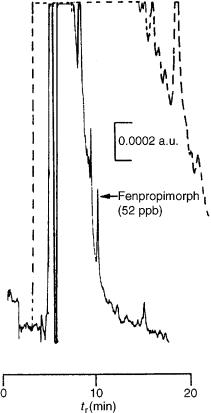
The experimental conditions are shown in Table 13.1, while Figure 13.9 shows the chromatogram of a soil sample extract spiked with fenpropimorph obtained by this method, plus the chromatogram from the two columns connected in series without column switching.
In multiresidue analysis, where more analytes with a wide polarity range need to be determined, large transfer volumes are required, and consequently, the selectivity is lower. However, since the major interferences in water analysis are the polar humic and fulvic acids, removing this early eluting interference in coupled-column RPLC will also be feasible in multiresidue methodology.
Several examples have been described in the literature, and some of these are included in Table 13.1.
For instance, a group of triazine herbicides has been determined in environmental water samples. In this example (33), a group of four triazines (simazine, atrazine, terbuthylazine and terbutryn) were determined by LC – LC by using the experimental conditions specified in Table 13.1. The flow-rate was 1 ml min 1 in both cases. The total analysis time was only 7 min, which enables a sample throughput of up to 60 samples per day. However, the limits of detection from this system were only about 0.1 – 0.15 g l 1, which is not enough for drinking water according to EEC regulations. These authors proposed a solid-phase extraction step
Multidimensional Chromatography in Environmental Analysis |
351 |
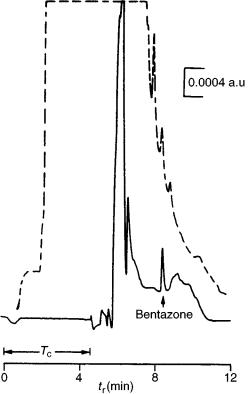
Figure 13.8 RPLC-UV (220 nm) chromatogram of a surface water sample containing 0.40 g l 1 bentazone (injection volume, 2.00 ml): solid line, chromatogram obtained with the coupled-column procedure; dashed line, chromatogram obtained with the same two columns coupled on-line without column switching, using a mobile phase of methanol – 0.02 M phosphate buffer (pH 2.7 (50:50, v/v)) at 1 ml min 1; Tc, clean-up time on the first column using the coupled-column procedure. Reprinted from Journal of Chromatography, A 644, E. A. Hogendoorn et al., ‘Coupled-column reversed-phase liquid chromatography-UV analyser for the determination of polar pesticides in water’, pp. 307 – 314, copyright 1993, with permission from Elsevier Science.
for determining the pesticides at levels of 0.1 g l 1, which requires limits of detection of 0.02 g l 1.
Atrazine is a widely used triazine which can degrade to several products, including deisopropylatrazine (DIA), deethylatrazine (DEA) and hydroxyatrazine (HA). These species are highly polar and their determination by GC requires a derivatization step. LC methods combined with SPE (off-line or on-line) are therefore the ones which are most commonly used. The LC–LC method proposed in the literature (34) can allow low levels to be detected with a small sample volume. The experimental conditions are shown in Table 13.1. Due to the different polarity between the most
352 |
Multidimensional Chromatography |
Figure 13.9 Coupled-column RPLC-UV (215 nm) analysis of 100 l of an extract of a spiked soil sample (fenpropimorph, 0.052 mg Kg 1). LC conditions: C-1, 5 m Hypersil SAS (60 m 4.6 mm i.d.); C-2, 5 m Hypersil ODS (150 m 4.6 mm i.d.); M-1, acetonitrile-0.5 % ammonia in water (50 : 50, v/v); M-2, acetonitrile – 0.5 % ammonia in water (90:10, v/v); flow-rate, 1 ml min 1; clean-up volume, 5.9 ml; transfer volume, 0.45 ml. The dashed line represents the chromatogram obtained when using the two columns connected in series without column switching. Reprinted from Journal of Chromatography A, 703, E. A. Hogendoorn and P. van Zoonen, ‘Coupled-column reversed-phase liquid chromatography in environmental analysis’, pp. 149 – 166, copyright 1995, with permission from Elsevier Science.
polar metabolite (DIA) and atrazine, a large transfer volume is required and this leads to a decrease in the selectivity. However, since the more polar compounds are the major source of interference, separation on C-1 allows the large excess of early eluting polar interference to be removed and thus improves the selectivity. The analytes are separated in C-2 by gradient elution because of the difference in polarity. The limits of detection are between 0.2 (atrazine) and 0.5 (HA) g l 1, but it should be pointed out that only 2 ml of sample are needed. When an off-line C18 SPE stage is applied, limits of detection down to 0.02 – 0.1 g l 1 were reached. Figure 13.10
Multidimensional Chromatography in Environmental Analysis |
353 |
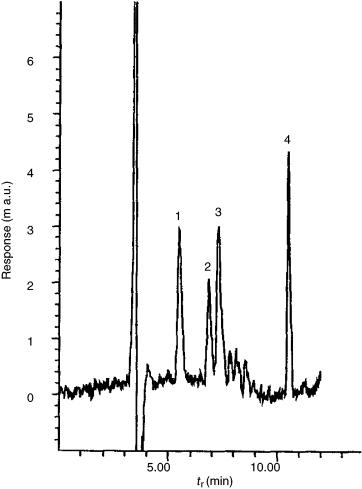
shows the chromatogram of a surface water spiked at 2 gl 1 of atrazine, and its metabolites, obtained under the conditions shown in Table 13.1.
Another interesting group of pesticides contains gluphosinate, glyphosate and aminomethylphosphonic acid (AMPA). Gluphosinate and glyphosate are widely used as non-selective contact herbicides, while aminomethylphosphonic acid is the main metabolite of glyphosate. All are very polar and detection by LC thus requires a derivatization step to enhance their fluorescence since they do not exhibit UV absorption. The method (28) includes precolumn derivatization with a 9-fluorenyl- methylchloroformate (FMOC-Cl) reagent, followed by LC–LC separation. The experimental conditions are shown in Table 13.1.
Since there is a high percentage of acetonitrile in the derivatization solution, the latter must be diluted in order to decrease the retention of the derivative in the first column and so that the derivatives can be separated from the excess reagent. The three compounds can be determined at a level of 1 g l 1, with the sample throughput being at least 40 samples per day.
When AMPA or gluphosinate are determined alone, the sensitivity is higher because a higher dilution is not required. For glyphosate, when the transfer volume is precisely adjusted to 280 l for the FMOC-glyphosate-containing fraction, a limit of detection of about 0.2 g l 1 can be reached (28).
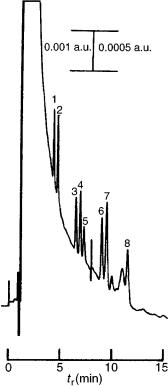
Chlorophenoxy acids are relatively polar pesticides which are usually determined by LC because volatile derivatives have to be prepared for GC analysis. This group of herbicides can be detected by multiresidue methods combined with automated procedures for sample clean-up, although selectivity and sensitivity can be enhanced by coupled-column chromatographic techniques (52). The experimental conditions for such analyses are shown in Table 13.1.
The first attempts employing two C18 columns showed that the selectivity was not high enough, although this improved when the first column was substituted by a 5 m GFF II internal surface reversed-phase material. This is known as a restricted- access-material (RAM) column which, since it restricts some compounds because of their size and includes reversed-phase interaction and ionic exchange, is very useful for analysing herbicides in samples with high contents of humic and fulvic acids (54).
Figure 13.11 shows the chromatogram obtained for a surface water sample spiked with various chorophenoxy acids at a level of 0.5 g l 1, under the same conditions as previously and after enrichment on a C18 column and clean-up on silica SPE cartridges.
With dicamba, a more polar chlorobenzoic acid herbicide, a gradient step is needed to elute all of the compounds in one chromatographic run. Depending on the buffer and selectivity of the detector, the baseline can be severely disturbed. If this happens, a step-gradient elution is recommended (52), and in this way the method can detect all of the compounds at very low levels.
Another interesting application of LC–LC is the determination of low-molecular- mass carbonyl compounds in air. Carbonyl compounds, such as aldehydes and ketones, are now being given more and more attention, both as pollutants and as
354 |
Multidimensional Chromatography |
Figure 13.10 LC – LC chromatogram of a surface water sample spiked at 2 g l 1 with atrazine, and its metabolites (registered at 220 nm). Conditions: volume of sample injected, 2 ml; clean-up time, 2.60 min; transfer time, 4.2 min; The blank was subtracted. Peak identification is as follows: 1, DIA; 2, HA; 3, DEA; 4, atrazine. Reprinted from Journal of Chromatography, A 778, F. Hernández et al., ‘New method for the rapid determination of triazine herbicides and some of their main metabolites in water by using coupled-column liquid chromatography and large volume injection’, pp. 171 – 181, copyright 1997, with permission from Elsevier Science.
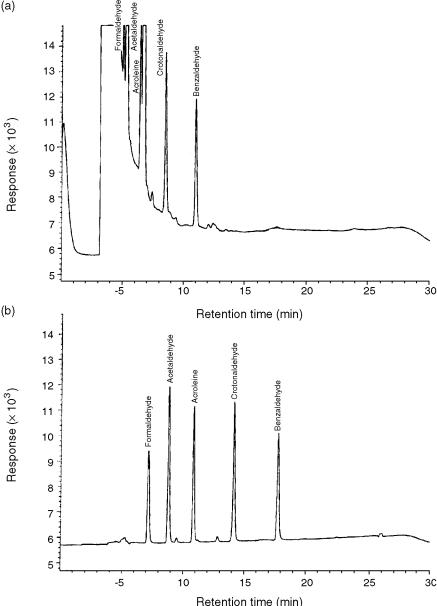
possible key compounds in photochemical reactions. In this example (53), 13 different aldehydes and ketones were determined in air and water samples by using cou- pled-column RPLC. These compounds were determined by UV detection of the derivative formed with 2,3-dinitrophenylhydrazine in C18 SPE cartridges. With two
Multidimensional Chromatography in Environmental Analysis |
355 |
Figure 13.11 Column-switching RPLC trace of a surface water sample spiked with eight chlorophenoxyacid herbicides at the 0.5 g l 1 level: 1, 2,4-dichlorophenoxyacetic acid; 2, 4-chloro-2-methylphenoxyacetic acid; 3, 2-(2,4-dichlorophenoxy) propanoic acid; 4, 2- (4-chloro-2-methylphenoxy) propanoic acid; 5, 2,4,5-trichlorophenoxyacetic acid; 6, 4-(2,4- dichlorophenoxy) butanoic acid; 7, 4-(4-chloro-2-methylphenoxy) butanoic acid; 8, 2-(2,4,5- trichlorophenoxy) propionic acid. Reprinted from Analytica Chimica Acta, 283, J. V. Sancho-Llopis et al., ‘Rapid method for the determination of eight chlorophenoxy acid residues in environmental water samples using off-line solid-phase extraction and on-line selective precolumn switching’, pp. 287 – 296, copyright 1993, with permission from Elsevier Science.
coupled-columns, the sensitivity and selectivity are both higher because interfering peaks do not enter the second column. This is demonstrated in Figure 13.12, which shows the chromatograms obtained both with and without column switching. The experimental conditions are reported in Table 13.1. As can be seen from this figure, there are significant differences in the selectivity and sensitivity for the two chromatograms, which again demonstrates the suitability of RPLC – RPLC methodology.
The coupling of low-resolution liquid chromatography (or SPE) to liquid chromatography has been widely applied to environmental analysis because of the improvement in sensitivity.
356 |
Multidimensional Chromatography |
Figure 13.12 Illustration of the clean-up method, showing the analysis of an air sample (a) with and (b) without column switching. Details of the analytical conditions are given in the text. Reprinted from Journal of Chromatography, A 697, P. R. Kootstra and H. A. Herbold, ‘Automated solid-phase extraction and coupled-column reversed-phase liquid chromatography for the trace-level determination of low-molecular-mass carbonyl compounds in air’, pp. 203 – 211, copyright 1995, with permission from Elsevier Science.
Multidimensional Chromatography in Environmental Analysis |
357 |
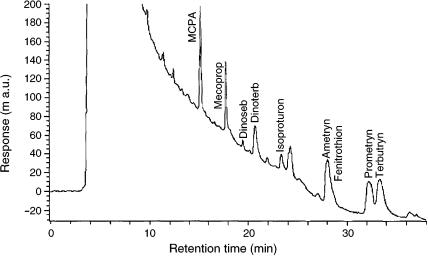
A general step is the coupling of a 10 mm long precolumn (2–3 mm i.d.), filled with C18 or polystyrene – divinylbenzene, to a 10 – 50 m RPLC column. A PLRP-s precolumn achieved higher breakthrough volume for the more polar compounds and is thus highly recommended. This set-up has been used to determine several groups of pesticides (40, 55–62), phenols (41, 63–65), PAHs (66, 67), naphthalenesulfonates (68, 69), etc. The sample volume depends on the breakthrough volumes of the compounds to be determined, with typical values being between 10 and 200 ml.
For example, Figure 13.13 shows the chromatogram obtained when 200 ml of tap water was spiked at levels of 1 g l 1 of such pesticides. The limits of detection achieved by using this method were between 0.05 and 0.5 g l 1, although more polar compounds such as vamidothion or 4-nitrophenol could not be determined (61).
Various highly crosslinked polymers, with slightly different properties, such as Envi-Chrom P, Lichrolut EN, Isolute ENV or HYSphere-1, have been applied in environmental analysis, mainly for polar compounds. For phenol, for instance, which is a polar compound, the recoveries (%) when 100 ml of sample was analysed were 5, 16 and 6 for PLRP-s, Envi-Chrom P and Lichrolut EN, respectively (70).
Chemically modified polymers have been used to determine polar compounds in water samples (37, 71). Chemical modification involves introducing a polar group into polymeric resins. These give higher recoveries than their unmodified analogues for polar analytes. This is due to an increase in surface polarity which enables the aqueous sample to make better contact with the surface of the resin (35).
Figure 13.13 On-line trace enrichment – RPLC-diode-array detection (DAD) chromatogram (at 230 nm) obtained from 200 ml of tap water spiked with various pesticides at levels of 1 g l 1. Reprinted from Chromatographia, 43, C. Aguilar et al., ‘Determination of pesticides by on-line trace enrichment – reversed-phase liquid chromatography – diode-array detection and confirmation by particle-beam mass spectrometry’, pp. 592 – 598, 1996, with permission from Vieweg Publishing.
358 |
Multidimensional Chromatography |
One problem with SPE – LC is the low selectivity of the precolumn. Immunosorbents, which have been developed for a few compounds (72), can considerably improve selectivity. The selectivity was high for different pollutants (73, 74). Figure 13.14 shows that selectivity is higher with an anti-isoproturon cartridge than with a PLRP-S precolumn.
Some groups of pollutants also have specific problems. For instance, PAHs tend to adsorb on the walls of the system with which they come into contact and so an organic solvent or surfactant must be added to the sample. Several solvents have been tested (66, 67): isopropanol or acetonitrile are the most often used solvents, while Brij is the most recommended surfactant (66). A very critical parameter in these cases is their concentration.
Another problem is the determination of ionic substances. Although these can be analysed by an ionic exchange precolumn, there are some significant limitations and, in most cases, common sorbents are preferred. In this case, an ion-pair reagent must be added to the sample to form an ion-pair and so reduce the polarity. This is used, for instance, to determine naphthalenesulfonic acids in environmental samples. Tetrabuthylamonium (TBA) is the most common ion-pair reagent (68), although when LC is coupled to mass spectrometry, it must be replaced by a volatile ion-pair reagent, e.g. triethylamine (69).
One problem with environmental samples that has already been mentioned concerns humic and fulvic acids which may be retained in the precolumn and co-elute with the more polar compounds. Of course, this depends on the selectivity of the sorbent in the precolumn. A simple solution is to add sodium sulphite to the solution prior to preconcentration. This approach has led to good results (37, 71).
Figure 13.15 shows the influence of adding sodium sulphite on the chromatogram of a river water sample.
Another solution to this particular problem is to use a restricted-access-material (RAM) column prior to the precolumn (54).
For the determination of a wide range of neutral, acidic and basic pollutants, two precolumns can be coupled in series (75). A PLRP-S precolum is used to trap the neutral and non-ionized acidic pollutants and a precolumn packed with the same sorbent and loaded with a sodium dodecylsulfate (SDS) (to form the ion-pair) is used to trap the positively charged (basic) pollutants. Each precolumn is coupled to one analytical column.
Sensitivity is usually higher with SPE – LC than with LC – LC, although both selectivity and sample throughput are lower (76).
13.4LIQUID CHROMATOGRAPHY – GAS CHROMATOGRAPHY
13.4.1INTRODUCTION
The main drawback of GC is sample introduction and this is especially important when analytes are to be determined at trace levels. Today, however, there is no problem with introducing 10 – 100 l of organic solvents such as ethyl acetate or alkanes