

Professional VSTO 2005 - Visual Studio 2005 Tools For Office (2006) [eng]
.pdfChapter 6
Data Labels
Data labels are labels that are imposed on the chart plot area to identify a specific part of the chart. Consider Figure 6-10.
Figure 6-10
As you select each setting, the chart plot area updates to show the default labels that may be displayed. You will notice that with three choices selected, the chart plot area appears cluttered. Information overload through a cluttered chart is just as bad as insufficient information. Always strive to find a good balance with the data being presented on the chart surface.
Data Tables
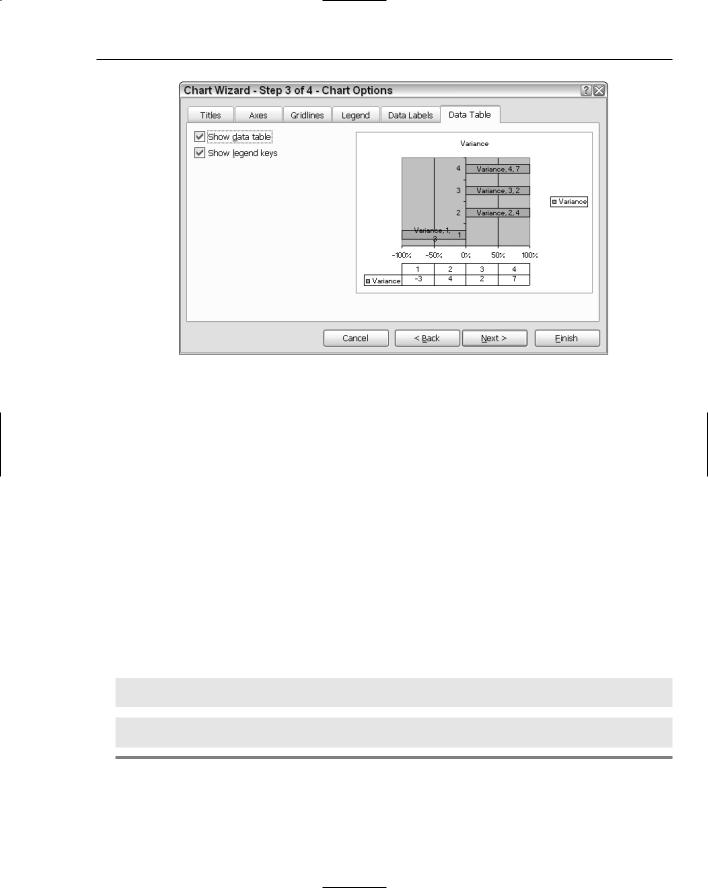
The last tab on page 3 of the Chart Wizard is the Data Table tab. Consider Figure 6-11 with the selected data table checkbox. Notice that the chart has imposed a table of values immediately beneath the chart.
Data tables provide an easy reference for the data displayed in a chart. Data tables are new for VSTO. For non-VSTO approaches, a data table must be built manually and imposed on the chart surface during the render phase.
The final page of the Chart Wizard allows the user to site the chart either in the existing worksheet or in a new worksheet. All the design-time options are available to runtime code. So let’s begin.
218
The Charting Tool
Figure 6-11
Creating VSTO Char ts
Charts are implicitly tied to worksheets. In fact, the Worksheets object actually exposes a Chart object, which represents the default chart in the worksheet. However, you should note that this implicit bond can be broken if you need to generate charts that aren’t bound to a worksheet. We provide some strategies for that in a moment. For the vast majority of use cases, charts will be associated with a worksheet.
Whether bound to a worksheet or not, charts are created by adding an object of type Chart to the chart collection. The addition is a placeholder and nothing meaningful appears at this point. To finalize the chart display, you’ll need to add data to the chart. Let’s focus for a moment on the typical case.
Stand-Alone Charts
The Worksheet document exposes a Chart object. You may create a new chart by calling the Add method of the charts collection. Consider Listing 6-1.
Visual Basic
Dim xlChart As Excel.Chart = DirectCast(Globals.ThisWorkbook.Charts.Add(),
Excel.Chart)
C#
Excel.Chart xlChart = (Excel.Chart)Globals.ThisWorkbook.Charts.Add(missing,
missing, missing, missing);
Listing 6-1 Creating charts bound to a worksheet
219

Chapter 6
Listing 6-1 shows that the Add method accepts four optional parameters. By default, the newly added chart forces the worksheet holding the chart to be the active worksheet. When you create a chart using the Add method of the Charts collection, the fourth parameter type is implied as Excel.XlSheetType
.xlChart and you should just pass missing to the method call for C#. In fact, specifying the type as xlChart will generate an exception. Visual Basic suffers no such inconvenience. As soon as you have added the chart to the Charts collection you can begin to customize the chart and load data.
The code in the Visual Basic sections are assumed to run from sheet1.vb unless otherwise specified. Visual Basic contains the appropriate references and imports to cause the code to compile successfully. In the case of events, where appropriate, the handlers will be added through code.
Embedded Charts
As the name implies, embedded charts are charts that are created as part of the worksheet. The usual means for creating this type of chart is to use the Chart Wizard. Earlier on in the chapter, we saw that the Chart Wizard can be used to create charts at design time. Listing 6-2 shows how to use the Chart Wizard to create charts at runtime.
Visual Basic
Dim ChartObjects as Excel.ChartObjects =
DirectCast (Me.ChartObjects(), Excel.ChartObjects)
Dim chartObject As Excel.ChartObject = ChartObjects.Add(1,20,250,250)
chartObject.Chart.ChartWizard(Me.Range(“A1”, “E1”), Excel.XlChartType.xl3DColumn, Title:=”First Chart”)
chartObject.Name = “InitialiChartObject”
ChartObjects = DirectCast (Me.ChartObjects(), Excel.ChartObjects)
Dim chartObject2 As Excel.ChartObject =ChartObjects.Add(251,20,250,250)
chartObject2.Chart.ChartWizard(Me.Range(“F1”, “K1”), Excel.XlChartType.xl3DColumn, Title:=”Second Chart”)
chartObject2.Name = “SecondaryChartObject” chartObject2.Activate()
C#
Excel.ChartObjects ChartObjects = (Excel.ChartObjects)this.ChartObjects(missing);
Excel.ChartObject chartObject = ChartObjects.Add(1, 20, 250, 250);
chartObject.Chart.ChartWizard(this.Range[“A1”, “E1”], Excel.XlChartType.xl3DColumn, missing, missing, missing, missing, missing, “First Chart”, missing, missing, missing);
chartObject.Name = “InitialiChartObject”;
ChartObjects = (Excel.ChartObjects)this.ChartObjects(missing);
220

The Charting Tool
Excel.ChartObject chartObject2 = ChartObjects.Add(251, 20, 250, 250);
chartObject2.Chart.ChartWizard(this.Range[“F1”, “K1”], Excel.XlChartType.xl3DColumn, missing, missing, missing,
missing, missing, “Second Chart”, missing, missing, missing); chartObject2.Name = “SecondaryChartObject”; chartObject2.Activate();
Listing 6-2 Creating embedded charts
The type of chart may be set at the series level or at the chart space level. The series level setting overrides the chart space level setting. Some charts, such as the scatter and bubble charts, do not allow you to set the chart type at the series level.
Loading Char ts with Data
Earlier on in the chapter, we examined the Chart Wizard. You may recall that the data was loaded and manipulated at design time. However, the chart is capable of loading data at runtime as well. Let’s begin by examining some scenarios through code. The first bit of code manipulates the Chart object to provide results similar to those in the exercises that we performed at the beginning of the chapter using the Chart Wizard. The code in Listing 6-3 will load data without the use of the Chart Wizard.
Visual Basic
Dim ChartObjects1 As Excel.ChartObjects = DirectCast (Me.ChartObjects(), Excel.ChartObjects)
Dim chartObject1 As Excel.ChartObject = ChartObjects1.Add(100, 20, 400,
300)
Dim rng As Excel.Range
rng = Me.Application.Range(“B1:B5”)
chartObject1.Chart.ChartWizard(rng, Excel.XlChartType.xl3DColumn, Title:=”Custom Chart”)
chartObject1.Name = “myChartObject”
chartObject1.Interior.Color = ColorTranslator.ToOle(Color.Silver) chartObject1.Activate()
C#
Excel.ChartObjects ChartObjects1 = (Excel.ChartObjects)this.ChartObjects(missing); Excel.ChartObject chartObject1 = ChartObjects1.Add(100, 20, 400, 300);
chartObject1.Chart.ChartWizard(this.Range[“B1”, “B5”], Excel.XlChartType.xl3DColumn, missing, missing, missing, missing, missing, “Custom Chart”, missing, missing, missing);
chartObject1.Name = “myChartObject”;
chartObject1.Interior.Color = ColorTranslator.ToOle(Color.Silver); chartObject1.Activate();
Listing 6-3 Using the Chart Wizard to render charts
221

Chapter 6
Listing 6-3 creates a chart that is loaded from data in a spreadsheet range given by B1:B5. If you care to examine the code, you should see that ChartObjects1 contains a reference to the newly added chart that has been sized appropriately. The size of the chartspace area derives its dimensions from the parameters of the Add method. However, the dimensions may be easily changed at some later point in time. Note also that if you enter incorrect parameters, a runtime exception will be thrown indicating only that the Chart Wizard method has failed. The error message does not indicate the offending parameter.
The Chart Wizard implicitly uses each column as a series. The setting is equivalent to choosing the first radio button in Figure 6-3. Series terminology will be explained in detail later in the chapter.
At this point, the chart contains no data and will display as an empty square on the spreadsheet. The next step involves invoking the Chart Wizard. The Chart Wizard will handle the manual labor of building the chart from a specified data source. As we mentioned before, the data source is limited to an Excel range.
The code in Listing 6-3 also adds a name to the chart object. This name is only available to calling code and does not display on the chart surface.
The Chart Wizard is flexible enough to construct a chart based on an empty range. Notice Figure 6-12 with the black outline around the range B1:B5. That range forms the series in the new chart. As soon as you enter a number, the chart updates to show the new information.
Figure 6-12
222

The Charting Tool
If you think about this long and hard, a light bulb should come on. Through this mechanism, the chart is able to respond to data loads in real time. That sort of responsiveness is well suited for real-time applications such as stock market software. And the code to build it is not much different from what is presented here. Simply add a range, and load the data continually into that range. Bind the Chart Wizard to that range, choose an appropriate chart type, and charge the customer an arm and a leg for several months of development effort. At the end of the chapter, you will be able to build that type of application easily.
There is one more quirk here that you should be aware of. The chart simply plots contiguous data that it finds on the spreadsheet. It doesn’t necessarily limit its data input to the range that is specified in code. This is certainly problematic because it means that you cannot plot a subset of a range in a spreadsheet; the chart will plot every point. Let’s consider a sophisticated example from the dataset here:
A |
B |
C |
D |
E |
|
|
|
|
|
1 |
11 |
22 |
14 |
4 |
9 |
2 |
7 |
2 |
22 |
6 |
2 |
3 |
3 |
4 |
8 |
4 |
9 |
4 |
3 |
22 |
11 |
7 |
44 |
5 |
|
|
|
|
|
Realize that if we simply plot the data by assigning a range A1:E5, we expect to find five series. Each series will contain the points assigned to the specific row. For instance, we expect to find series 1 containing points 1, 11, 22, 14, and 4. Likewise, series 4 should contain points 8, 4, 9, 4, and 3. However, it is possible to exercise some control over the points in this series. Consider Listing 6-4.
Visual Basic
Dim xlChart As Excel.Chart = DirectCast(Globals.ThisWorkbook.Charts.Add(), Excel.Chart)
Dim cellRange As Excel.Range = Globals.Sheet1.Range(“a1”, “e5”)
xlChart.SetSourceData(cellRange.CurrentRegion) xlChart.ChartType = Excel.XlChartType.xl3DColumn
Dim oSeries As Excel.Series = DirectCast(xlChart.SeriesCollection(1),
Excel.Series)
oSeries.XValues = Me.Range(“a1”, “e1”)
oSeries.Name = “Normal Series 1”
oSeries = DirectCast(xlChart.SeriesCollection(2), Excel.Series) oSeries.XValues = Me.Range(“a2”, “d2”)
oSeries.Name = “Shortened Series 2”
oSeries = DirectCast(xlChart.SeriesCollection(3), Excel.Series) oSeries.XValues = Me.Range(“b1”, “b5”)
oSeries.Name = “Awkard”
xlChart.Location(Excel.XlChartLocation.xlLocationAsObject, Me.Name)
223

Chapter 6
C#
using System; using System.Data;
using System.Drawing; using System.Windows.Forms;
using Microsoft.VisualStudio.Tools.Applications.Runtime; using Excel = Microsoft.Office.Interop.Excel;
using Office = Microsoft.Office.Core;
namespace XValue
{
public partial class Sheet1
{
private void Sheet1_Startup(object sender, System.EventArgs e)
{
Excel.Chart xlChart = (Excel.Chart)Globals.ThisWorkbook.Charts.Add(missing, missing, missing, missing);
Excel.Range cellRange = this.Range[“a1”, “e5”] as Excel.Range;
xlChart.SetSourceData(cellRange.CurrentRegion, missing); xlChart.ChartType = Excel.XlChartType.xl3DColumn;
Excel.Series oSeries = (Excel.Series)xlChart.SeriesCollection(1); oSeries.XValues = this.Range[“a1”, “e1”];
oSeries.Name = “Normal Series 1”;
oSeries = (Excel.Series)xlChart.SeriesCollection(2); oSeries.XValues = this.Range[“a2”, “d2”]; oSeries.Name = “Shortened Series 2”;
oSeries = (Excel.Series)xlChart.SeriesCollection(3); oSeries.XValues = this.Range[“b1”, “b5”]; oSeries.Name = “Awkard”;
xlChart.Location(Excel.XlChartLocation.xlLocationAsObject, this.Name);
}
private void Sheet1_Shutdown(object sender, System.EventArgs e)
{
}
}
}
Listing 6-4 Series customization from range dataset
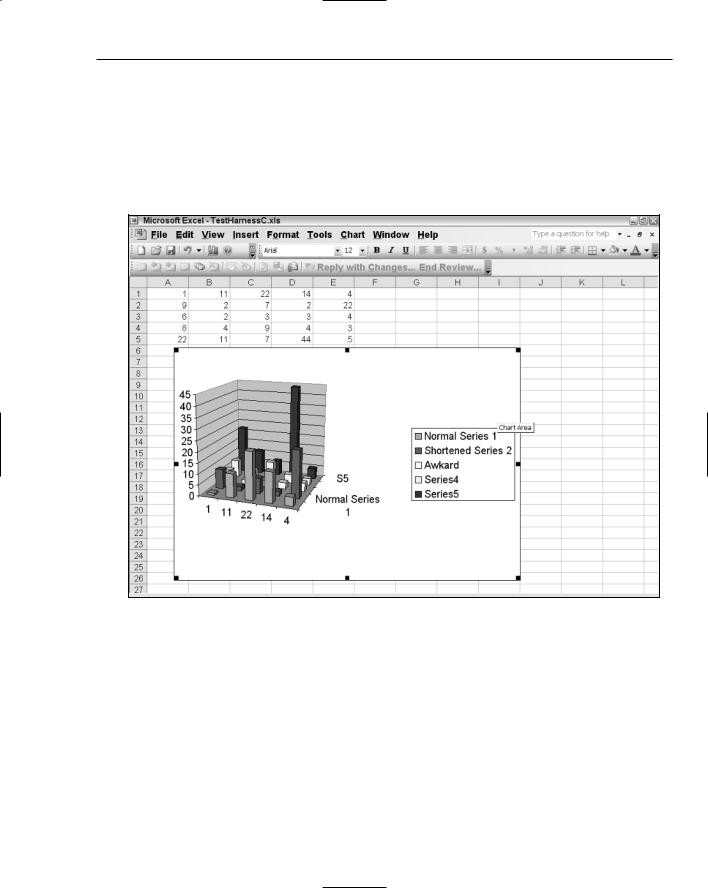
The chart dataset is set to A1:E5. However, for series 1, we instruct the chart to source its X values from the range A1:E1. This is the default. We name the series appropriately. For series 2, we instruct the chart to source its X values from the range A2:D2. This is not the default; the range is shorter than the default by one cell, E2. We name the series appropriately. For series 3, we instruct the chart to source its X values from the range B1:B5. This is not the default. We name the series appropriately. The remaining two series are plotted with the default values given by range A4:E4 and A5:E5, respectively.
224
The Charting Tool
Unfortunately, for the second series, where the range A2:D2 specifically elides the E2 cell, the chart continues to plot the entire range. The only way to force the chart to respect our wishes is to insert an empty cell at E2. Be aware of this limitation when sourcing from the spreadsheet. It’s not particularly pleasant because the action necessitates a change in the original dataset.
For icing on the cake, the last line of code simply locates the chart on the specified sheet. You may use this setting to locate the chart to any other worksheet provided that the worksheet is valid and available. Figure 6-13 shows the code in action.
Figure 6-13
Before going on, you should notice that the chart in Figure 6-12 is a 3-D chart. However, there are only two axes. The category and value axes are perpendicular to each other. But you should also notice that the chart has depth that seems to imply a third axis is present. However, this depth is not the result of a third axis. A VSTO chart cannot have three axes. Instead, the perceived depth is automatically created by the chart engine in order to label the series correctly.
225

Chapter 6
Essential Char t Object Hierarchy
Fortunately for the average developer seeking to implement charting functionality in windows applications, only a small part of the Chart object hierarchy knowledge is actually required to build robust software. For instance, knowledge of the axes, series, and titles is sufficient to qualify you as a chart expert. The reason behind this claim is that, for a large majority of charting requirement, that is all the knowledge that is actually required. However, it does not mean that you cannot benefit from learning more about the object hierarchy.
Series Manipulation
The Series collection implies that a chart may have more than one series. We reserve an in-depth analysis of charts with multiple series for later in the chapter. For now, you should note that the Series object may be used to override certain global chart settings. For instance, the chart type that is set at the chart level, may be overridden at the series level so that each series contains its own chart type. In spite of this flexibility, you should be aware that there are limitations to the number of chart types can be imposed on a single chart surface.
The Series object also allows for the customization of all things related to the series. For instance, labels, captions, font settings, and colors may be imposed on the series. In addition, trend lines and error bars also form part of the series functionality as well.
You should note that the SeriesCollection does not contain a count method. To find the number of series in a chart surface, you will actually need to iterate the collection. This limitation is a VSTO imposed limitation. If you use regular Interop, the series collection does expose a count property. Though the code has been presented to manipulate series in the preceding section, let’s formalize it here with the code in Listing 6-5.
Visual Basic
Dim oSeries As Excel.Series = DirectCast (xlChart.SeriesCollection(1),
Excel.Series)
oSeries.XValues = Me.Range(“a1”, “e1”) oSeries.Name = “Normal Series 1”
C#
Excel.Series oSeries = (Excel.Series)xlChart.SeriesCollection(1); oSeries.XValues = this.Range[“a1”, “e1”]; oSeries.Name = “Normal Series 1”;
Listing 6-5 Series manipulation
While other Excel programming surfaces allow a series to be made up of an infinite number of points, VSTO-based series can only contain a finite number of points. This number is smaller for 3-D charts and larger for 2-D charts. The series is key to unlocking the rich feature set of the Excel chart.
Axes and Scaling
A formal definition of a chart axis has already been presented. Code has also shown how to retrieve references to particular axes using an index reference. However, it is also possible to retrieve an axis through a name.
226

The Charting Tool
One important reason for using a name instead of an index is that the index may change based on the type of chart and the manipulation of the series. This change may invalidate the index being used. However, a named reference is guaranteed to be correct. One additional benefit is that the code is much more readable. Consider the code in Listing 6-6 that shows how to use a named reference.
Visual Basic
Dim axisScale As Excel.Axis = CType(Globals.ThisWorkbook.ActiveChart.Axes(Excel.XlAxisType.xlValue,Excel.XlAxisGr oup.xlPrimary), Excel.Axis)
C#
Excel.Axis axisScale = (Excel.Axis)Globals.ThisWorkbook.ActiveChart.Axes(Excel.XlAxisType.xlValue, Excel.XlAxisGroup.xlPrimary);
Listing 6-6 Working with the primary chart axis
In the code snippet presented, the axes parameter supports two parameters. The first parameter indicates the specific axis. For charts with mulitple series, the chart code can explicitly request either the primary or the secondary axis.
By default, Microsoft Excel handles unit scaling internally. Consider a data source that spans values from 1 to 10 on the category axis. It’s appropriate for each mark to represent a unit, since the width can easily fit on the category axis. However, if the data set includes a range from 0 through 50,000, then some sort of scale must be applied to allow the data to fit on the chart axis.
If you are not content with the internal scaling that Microsoft Excel has imposed, you can easily apply your own unit so that tick marks increment in units of 10,000 for instance. Listing 6-7 shows some code to make this possible.
Visual Basic
Dim ChartObjects1 As Excel.ChartObjects = CType(Me.ChartObjects(), Excel.ChartObjects)
Dim chartObject1 As Excel.ChartObject = ChartObjects1.Add(100, 20, 400,
300)
chartObject1.Chart.ChartWizard(Me.Range(“A1”, “A3”), Excel.XlChartType.xlLine, Title:=”Scale Chart”)
chartObject1.Activate()
Dim axisScale As Excel.Axis = DirectCast ( chartObject1.Axes(Excel.XlAxisType.xlValue, Excel.XlAxisGroup.xlPrimary), Excel.Axis)
If axisScale IsNot Nothing Then
axisScale.ScaleType = Excel.XlScaleType.xlScaleLogarithmic axisScale.MajorUnitIsAuto = False
axisScale.MajorUnit = 1000 End If
C#
private void Sheet1_Startup(object sender, System.EventArgs e)
{
Excel.ChartObjects ChartObjects1 = (Excel.ChartObjects)this.ChartObjects(missing);
Excel.ChartObject chartObject1 = ChartObjects1.Add(100, 20, 400, 300);
227