

Professional VSTO 2005 - Visual Studio 2005 Tools For Office (2006) [eng]
.pdfChapter 6
As with multiple series, you can precisely control the two charts on the chart surface. Listing 6-20 shows some code to manipulate the charts independently (see Figure 6-28).
Figure 6-28
The VSTO chart offers no way to split axes to specific intervals. Again, this is only a VSTO-imposed limitation. This functionality is alive and well through other automation techniques.
Perspectives and 3-D Drawing
VSTO is quite capable of taking it up a notch or two. And you may need that type of flexibility if your requirements dictate that the chart must have bang for the buck. One good way to dazzle is to use perspectives and 3-D functionality. Another simpler approach is to customize the surfaces of the chart.
Listing 6-21 has some code to illustrate some basic concepts for customizations.
258

The Charting Tool
Visual Basic
Private Sub Sheet1_Startup(ByVal sender As Object, ByVal e As System.EventArgs) Handles Me.Startup
Dim xlChart As Excel.Chart = DirectCast (Globals.ThisWorkbook.Charts.Add(), Excel.Chart)
Dim cellRange As Excel.Range = Me.Range(“a1”, “b5”)
xlChart.SetSourceData(cellRange.CurrentRegion)
xlChart .ChartType = Excel.XlChartType.xl3DBarClustered
xlChart .RightAngleAxes = false xlChart .Perspective = 15 xlChart .Elevation = 44
End Sub
C#
using System; using System.Data;
using System.Drawing; using System.Windows.Forms;
using Microsoft.VisualStudio.Tools.Applications.Runtime; using Excel = Microsoft.Office.Interop.Excel;
using Office = Microsoft.Office.Core;
namespace Perspectives
{
public partial class Sheet1
{
private void Sheet1_Startup(object sender, System.EventArgs e)
{
Excel.Chart xlChart = (Excel.Chart)Globals.ThisWorkbook.Charts.Add(missing, missing, missing, missing);
Excel.Range cellRange = this.Range[“a1”, “b5”] as Excel.Range;
xlChart.SetSourceData(cellRange.CurrentRegion, missing); xlChart .ChartType = Excel.XlChartType.xl3DBarClustered;
xlChart .RightAngleAxes = false; xlChart .Perspective = 15; xlChart .Elevation = 44;
}
private void Sheet1_Shutdown(object sender, System.EventArgs e)
{
}
}
}
Listing 6-21 Chart perspectives
The code produces the chart in Figure 6-29.
Notice how the perspective of the chart is tilted by 15 degrees. While this is a theoretical exercise, such functionality can have real impact in an enterprise software world, especially when chart objects are mixed with pieces of text on-screen. Also, you should notice that the chart type can simply be changed to a 3-D-supported type, and the chart engine will render a 3-D image.
259

Chapter 6
Figure 6-29
The final line of code sets the elevation of the chart. The elevation is measured in degrees, since it acts as a sort of rotation to the chart view plane. If you examine Figure 6-29, the elevation angle is responsible for the awkward tilt. Valid values range from 0 through 44 degrees. Where would this functionality be helpful? Consider an application that displays a chart that is able to respond to mouse movements in real time. As the mouse moves, code grabs the mouse coordinates and updates the perspective. Highend analytical packages are built on this simple premise.
Chart Point Customization
A series is a collection of points plotted on a chart surface. The code you’ve seen so far has manipulated the series as a whole; that is, the collection of points. Let’s turn our attention to the individual points that form part of the series. It just so happens that the SeriesCollection exposes a Points object collection that provides access to the individual points that make up the series. If you think about it for a moment, you should begin to form a picture of endless possibilities in your mind.
Consider a requirement that performs a certain customization on a chart based on the value of each point. One approach to fulfilling this requirement is to gain access to the Points object collection. Consider the code in Listing 6-22.
260

The Charting Tool
Visual Basic
Dim xlChart As Excel.Chart = DirectCast (Globals.ThisWorkbook.Charts.Add(), Excel.Chart)
Dim cellRange As Excel.Range = Me.Range(“a1”, “e1”) xlChart.SetSourceData(cellRange)
xlChart.ChartType = Excel.XlChartType.xlPie
‘get a reference to the series collection to customize a chart point Dim series As Excel.Series =
DirectCast(Globals.ThisWorkbook.ActiveChart.SeriesCollection(1),Excel.Series) Dim oPoint As Excel.Point = series.Points(1)
oPoint.HasDataLabel = True
oPoint.Interior.Color = ColorTranslator.ToOle(Color.Red)
C#
using System; using System.Data;
using System.Drawing; using System.Windows.Forms;
using Microsoft.VisualStudio.Tools.Applications.Runtime; using Excel = Microsoft.Office.Interop.Excel;
using Office = Microsoft.Office.Core;
namespace Points
{
public partial class Sheet1
{
private void Sheet1_Startup(object sender, System.EventArgs e)
{
Excel.Chart xlChart = (Excel.Chart)Globals.ThisWorkbook.Charts.Add(missing, missing, missing, missing);
Excel.Range cellRange = this.Range[“a1”, “e1”] as Excel.Range; xlChart.SetSourceData(cellRange, missing);
xlChart.ChartType = Excel.XlChartType.xlPie;
//get a reference to the series collection to customize a chart point Excel.Series series = xlChart .SeriesCollection(1) as Excel.Series; Excel.Point oPoint = series.Points(1) as Excel.Point; oPoint.HasDataLabel = true;
oPoint.Interior.Color = ColorTranslator.ToOle(Color.Red);
}
private void Sheet1_Shutdown(object sender, System.EventArgs e)
{
}
}
}
Listing 6-22 Customization of points in a data series
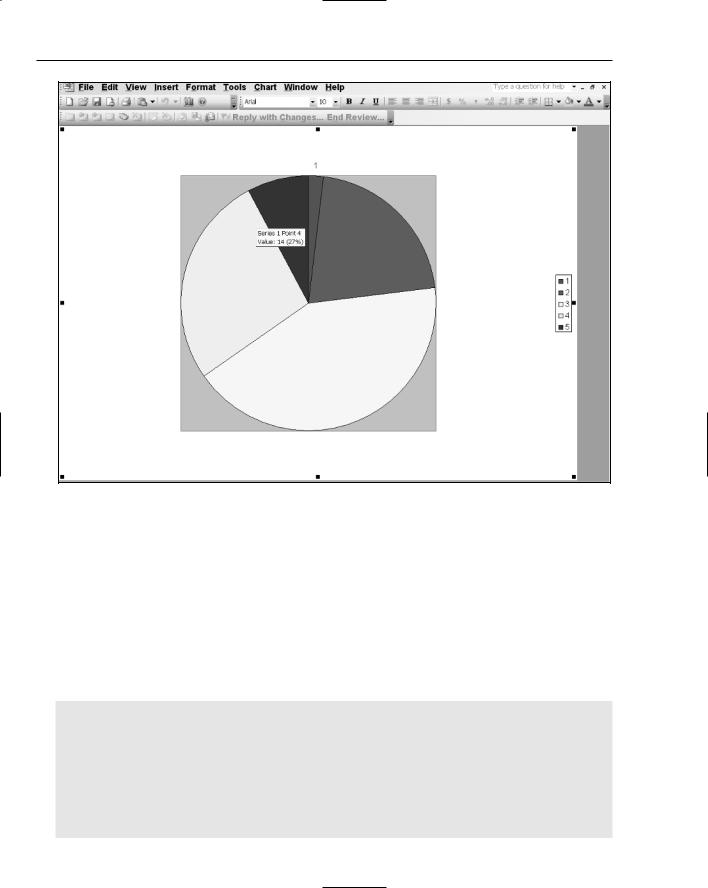
The larger idea here is that the series collection provides access to the points object collection. Each point corresponds to the value in the first row of the spreadsheet, as shown in Figure 6-30. In Figure 6-30, one slice of the pie is colored red, since it represents the first point in the collection.
261
Chapter 6
Figure 6-30
For simplicity, the code simply picks the first point. However, you can let your imagination run wild here because you have access to all the points that can be plotted on the chart surface. For instance, you may consider adding a MarkerStyle to the point if it meets a specific criterion. However, you should be careful because MarkerStyles apply to the series as a whole and not to this single point. Another point worth noting is that certain chart types, line charts for instance, don’t support point color formatting.
Now that the basics are safely out of the way, let’s consider an advanced scenario. How do we test a point to determine its value before applying customization? As pointed out previously, we may need to apply some specific format if a value of a point is above 5 for instance. Listing 6-23 has some code that demonstrates an approach.
Visual Basic
Dim xlChart As Excel.Chart = DirectCast (Globals.ThisWorkbook.Charts.Add(), Excel.Chart)
Dim cellRange As Excel.Range = Me.Range(“a1”, “b5”)
xlChart.SetSourceData(cellRange.CurrentRegion)
Globals.ThisWorkbook.ActiveChart.ChartType =
Excel.XlChartType.xl3DBarClustered
‘get a reference to the series collection to customize a chart point
Dim series As Excel.Series =
DirectCast(Globals.ThisWorkbook.ActiveChart.SeriesCollection(1),Excel.Series)
262

The Charting Tool
Dim stopFlag As Boolean = False Dim index As Integer = 0
Do
Try
index = index + 1
Dim oPoint As Excel.Point = DirectCast(series.Points(index),Excel.Point)
oPoint.HasDataLabel = True
If oPoint.DataLabel IsNot Nothing Then Dim val As Double = 0
If Double.TryParse(oPoint.DataLabel.Text, NumberStyles.Integer Or NumberStyles.AllowTrailingWhite Or NumberStyles.AllowLeadingWhite Or NumberStyles.AllowLeadingSign Or NumberStyles.AllowDecimalPoint, NumberFormatInfo.InvariantInfo, val) Then
If val > 5 Then
‘do something with point End If
End If
End If
Catch ex As Exception stopFlag = True
End Try
Loop While Not stopFlag
C#
//get a reference to the series collection to customize a chart point Excel.Series series =
Globals.ThisWorkbook.ActiveChart.SeriesCollection(1) as Excel.Series;
bool stop = false; int index = 0;
do
{
try
{
index++;
Excel.Point oPoint = series.Points(index) as Excel.Point; oPoint.HasDataLabel = true;
if (oPoint.DataLabel != null)
{
double val = 0;
if (Double.TryParse(oPoint.DataLabel.Text, NumberStyles.Integer | NumberStyles.AllowTrailingWhite | NumberStyles.AllowLeadingWhite | NumberStyles.AllowLeadingSign | NumberStyles.AllowDecimalPoint, NumberFormatInfo.InvariantInfo, out val))
{
if (val > 5)
{
//do something with point
}
}
}
263

Chapter 6
}
catch (Exception ex)
{
stop = true;
}
} while (!stop);
Globals.ThisWorkbook.ActiveChart.Refresh();
Listing 6-23 Code to test point values
To compile this code you will need to include the System.Globalization namespace.
First, an appropriate reference is obtained for series. With that reference, the code checks to see if the appropriate MarkerStyle has been applied. The size of the marker is adjusted for visibility purposes. This code is essentially a repeat from the code in Listing 6-21. From that point, things get progressively ugly. Here is why.
The idea behind the code is to test each point to see if it matches some criterion. In that case, if the value is greater than 5, then some action is taken. However, the Points object collection does not contain a count property. What’s worse is that the Points object is implemented as a method. If you care to examine the documentation at this point, it indicates that the Points(Points.Count) is an index into the last point in the series. However, since Points is implemented as a method, Points.Count access is simply an invalid syntax.
The end user is usually not interested in this sort of squabbling, so in the interest of getting this to work, we improvise with a counter and a do-while loop. Since the collection is not zero based, the index is incremented to 1 on the first pass. The value of the index is passed as an index into the Points object collection. The while loop will continue to work as long as the indices are valid. An exception is thrown to notify us that the last index was out of bounds. At that point, we set a Boolean flag to stop the while loop. You should note that we have broken with best practices convention by using exceptions to determine logic flow. This is awful!
Inside the loop, we need to find out if the point contains a DataLabel. The DataLabel is equal to the data point being plotted. However, the data point is of type string that we retrieve from the DataLabel.Text property. Using the .NET TryParse method, we obtain the value of the text and convert it to double. We are not interested in using a simple parse on the string, since an invalid input can throw an exception resulting in the while loop stopping prematurely. If you care to examine the TryParse method, you should note that the various parameters that are OR’d together simply provide more flexibility in handling the input. The code certainly works but is not elegant at all.
As it turns out, the Excel.Points object collection contains a count method. That important morsel of information is buried deep inside the help documentation. But, we can use this to our benefit by simply replacing the line that casts the point to a series.Points with one that casts to an Excel.Points object instead in Listing 6-23. Now that we have a count, we can replace the entire loop code with cleaner, more efficient code. The lesson learned here is that a suitable programming resource can often prevent unnecessary work and result in more efficient code. Listing 6-24 is another example of the Excel.Points object in action.
264

The Charting Tool
Visual Basic
Dim series As Excel.Series = DirectCast(Globals.ThisWorkbook.ActiveChart.SeriesCollection(1), Excel.Series)
Dim pnts As Excel.Points = DirectCast(series.Points(), Excel.Points)
Dim i As Integer
For i = 1 To pnts.Count - 1 Step i + 1 Dim val As Excel.Point = pnts.Item(i) If i / 2 = 0 Then
val.Shadow = True
Else
val.Shadow = False End If
Next
C#
Object o; Excel.Points pnts; Excel.Series series;
o = ((Excel.Chart)Globals.ThisWorkbook.Charts[1]).SeriesCollection(1); series = (Excel.Series)o;
pnts = (Excel.Points)series.Points(missing);
for (int i = 1; i < pnts.Count; i++)
{
Excel.Point val = pnts.Item(i); if (i % 2 == 0)
val.Shadow = true;
else
val.Shadow = false;
}
Listing 6-24 Series point iteration
The code in Listing 6-24 is essentially unchanged from other code presented earlier, so there is no need to beat a dead horse. On the other hand, the new piece of code requires some analysis. As pointed out earlier, if we cast the object returned from the series.Points() method call into an Excel.Points object, we gain the use of a count property. And the code approach is neither a hack nor is it inefficient. It’s simply poorly documented. Inside the for loop, we can perform some action based on the value of the point. In our case, we add a shadow effect to every odd point value.
Adding Objects to the Chart Surface
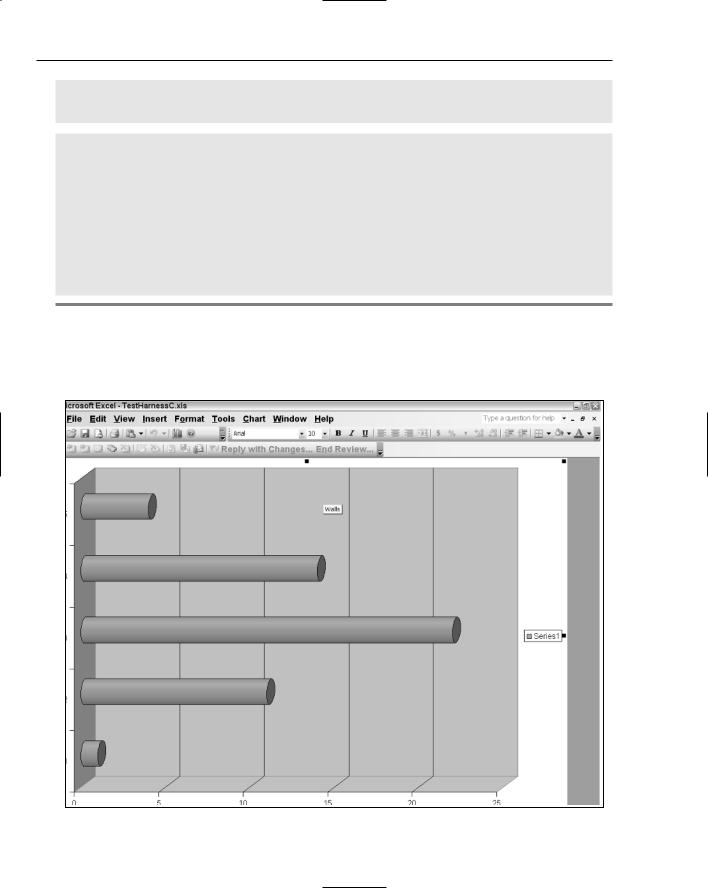
From time to time, the end user gets bored with the default shapes and may require the ability to jazz things up a bit. How does VSTO charting rise to this challenge? VSTO-based charts can convert default shapes into aesthetic flattery. Consider Listing 6-25, which converts a 3-D clustered bar into a cylinder.
Visual Basic
Private Sub CreateCylinderShape()
Dim xlChart As Excel.Chart = DirectCast (Globals.ThisWorkbook.Charts.Add(), Excel.Chart)
Dim cellRange As Excel.Range = Me.Range(“a1”,”e1”) xlChart.SetSourceData(cellRange)
xlChart.ChartType = Excel.XlChartType.xl3DBarClustered
‘get a reference to the series collection to customize a chart point
265
Chapter 6
Dim series As Excel.Series = xlChart .SeriesCollection(1) series.BarShape = Microsoft.Office.Interop.Excel.XlBarShape.xlCylinder
End Sub
C#
private void CreateCylinderShape()
{
Excel.Chart xlChart = (Excel.Chart)Globals.ThisWorkbook.Charts.Add(missing, missing, missing, missing);
Excel.Range cellRange = this.Range[“a1”, “e1”] as Excel.Range; xlChart.SetSourceData(cellRange, missing);
xlChart.ChartType = Excel.XlChartType.xl3DBarClustered;
//get a reference to the series collection to customize a chart point Excel.Series series = xlChart .SeriesCollection(1) as Excel.Series;
series.BarShape = Microsoft.Office.Interop.Excel.XlBarShape.xlCylinder;
}
Listing 6-25 Conversion of bars to cylinders
Well, that was surprisingly easy to achieve. As you can see, the series contains built-in support for this conversion. In fact, the enumeration contains six members that allow for interesting charts to be rendered on the chart surface. Figure 6-31 shows the result of the code.
Figure 6-31
266

The Charting Tool
From time to time, the end user may also require that certain portions of the data may be highlighted or emphasized. We have already presented code to show how to iterate the Points collection. However, this approach is somewhat limited since the Points object is marked as read-only. As an alternative, you can perform the cast described in Listing 6-23 to gain access to a Point object collection that is not readonly. Another good way to emphasize data is simply to draw or impose a picture on the chart surface next to the area of interest. This is the basic concept but you are free to employ your imagination.
Let’s consider an example that renders data to a chart and then emphasizes a particular area of the chart by placing an image next to an area of the chart in response to the end-user click event. The example will proceed with the difficult part, you should be able to wire the click event to the part of the code shown in Listing 6-26.
Visual Basic
Private Sub CreateFlag()
Dim xlChart As Excel.Chart = DirectCast (Globals.ThisWorkbook.Charts.Add(), Excel.Chart)
Dim cellRange As Excel.Range = Me.Range(“a1”,”e1”) xlChart.SetSourceData(cellRange)
xlChart.ChartType = Excel.XlChartType.xl3DBarClustered
‘get a reference to the series collection to customize a chart point Dim series As Excel.Series =
DirectCast(Globals.ThisWorkbook.ActiveChart.SeriesCollection(1) ,Excel.Series) xlChart .Shapes.AddPicture(“c:\download\ images.jpg”,
Microsoft.Office.Core.MsoTriState.msoCTrue, Microsoft.Office.Core.MsoTriState.msoFalse, 50, 50, 100, 100)
End Sub
C#
private void CreateFlag()
{
Excel.Chart xlChart = (Excel.Chart)Globals.ThisWorkbook.Charts.Add(missing, missing, missing, missing);
Excel.Range cellRange = this.Range[“a1”, “e1”] as Excel.Range; xlChart.SetSourceData(cellRange, missing);
xlChart.ChartType = Excel.XlChartType.xl3DBarClustered;
//get a reference to the series collection to customize a chart point Excel.Series series = xlChart .SeriesCollection(1) as Excel.Series; xlChart .Shapes.AddPicture(@”c:\download\images.jpg”,
Microsoft.Office.Core.MsoTriState.msoCTrue, Microsoft.Office.Core.MsoTriState.msoFalse, 50, 50, 100, 100);
}
Listing 6-26 Addition of picture objects to chart surface
The code shows that a gif image is imposed on the chart surface. The CreateFlag method contains code that simply uses the Globals object hook to gain access to the shapes property. The Shapes property is an object collection that holds all the shapes that are part of the Chart collection. We simply use the AddPicture method to add our own picture to the collection. The picture is given by the file path C:\download\flag.bmp. If the path is not valid, an exception is thrown. Figure 6-32 shows the code in action.
The code shows that an image may be imposed on the chart surface. This is truly magical. Functionality such as this is simply not possible through some of the Excel automation surfaces such as the Office Web Components. However, you should take care to not overdo that type of functionality.
267