

Учебники / Textbook and Color Atlas of Salivary Gland Pathology - DIAGNOSIS AND MANAGEMENT Carlson 2008
.pdfSerous cell
Apical microvillus
Pinocytotic vesicle
Heterogeneous electron-dense secretory granules
Intercellular secretory canaliculus
Tight junction
Spherical nucleus
Striated duct cell
Centrally-located nucleus
Mitochondria
Infoldings of basal plasma membrane resulting in striated appearance
|
|
|
Serous |
|
|
|
|
|
secretory |
|
|
|
|
|
endpiece |
|
|
|
|
Junction between |
|
|
|
|
striated duct cell and |
|
|
|
|
|
|
cholinergic axon |
|
|
|
Striated |
|
|
|
||
(intralobular) |
|
|
|
||
duct |
|
|
|
|
Intercalated |
|
|
|
|||
|
|
|
|
|
|
accompanied by |
|
||||
|
|
ducts |
|||
nonmyelinated |
|
|
|||
Na+ |
|
|
|||
postganglionic |
Water |
||||
axon |
Cl |
Salts |
|||
|
|
|
|
|
-amylase |
|
|
|
|
€ |
|
|
|
|
Immunoglobulin |
Peroxidase |
|
|
|
To interlobular |
Proline-rich |
||
|
|
|
|||
|
|
excretory ducts |
Lysozyme |
proteins |
|
|
|
|
|
|
|
|
|
|
Kallikrein |
|
|
|
|
|
K+ |
|
|
Intercalated duct cell
Prominent apical web of microfilaments
|
Process of |
|
myoepithelial cell |
|
Mucous cell |
|
Tight junction |
|
Homogeneous |
|
electron-translucent |
|
secretory vesicles |
|
Flattened basal |
|
nucleus |
|
Serous demilune |
|
(as seen in routine |
|
histological preparations) |
|
Junctions between cholinergic axons |
|
and intercalated duct cells |
|
Myoepithelial |
|
cell |
|
Complex arborization |
|
of adrenergic and |
|
cholinergic axons |
Water |
around secretory unit |
or ‘endpiece’ |
|
Salts |
|
Neutral |
Mucous secretory |
glycoproteins |
|
Sialomucins |
endpiece |
Sulphomucins |
|
|
Adrenergic |
|
nerve |
|
terminals |
|
Arteriole |
|
accompanied by |
|
adrenergic axons |
Figure 1.14. Diagram showing the histology of the major components of the salivary glands. Published with permission, Elsevier Churchill Livingstone, Oxford, Standring S, Editor in Chief, Gray’s Anatomy, 39th edition.

Surgical Anatomy, Embryology, and Physiology of the Salivary Glands |
17 |
Control of Salivation
There is a continuous low background saliva production that is stimulated by drying of the oral and pharyngeal mucosa. A rapid increase in the resting levels occurs as a reflex in response to masticatory stimuli including the mechanoreceptors and taste fibers. Other sensory modalities such as smell are also involved. The afferent input is via the salivatory centers, which are themselves influenced by the higher centers. The higher centers may be facilitory or inhibitory depending on the circumstances. The efferent secretory drive to the salivary glands passes via the parasympathetic and sympathetic pathways. There are no peripheral inhibitory mechanisms.
Cholinergic nerves (parasympathetic) often accompany ducts and branch freely around the secretory endpieces (acini). Adrenergic nerves (sympathetic) usually enter the glands along the arteries and arterioles and ramify with them. Within the glands, the nerve fibers intermingle such that cholinergic and adrenergic axons frequently lie in adjacent invaginations of a single Schwann cell. Secretion and vasoconstriction are mediated by separate sympathetic axons, whereas a single parasympathetic axon may, through serial terminals, result in vasodilatation, secretion, and constriction of myoepithelial cells.
Secretory endpieces are the most densely innervated structures in the salivary glands. Individual acinar cells may have both cholinergic and adrenergic nerve endings. The secretion of water and electrolytes, which accounts for the volume of saliva produced, results from a complex set of stimuli that are largely parasympathetic. The active secretion of proteins into the saliva depends upon the relative levels of both sympathetic and parasympathetic stimulation.
Although the ducts are less densely innervated than secretory acini, they do influence the composition of the saliva. Adrenal aldosterone promotes resorption of sodium and secretion of potassium into the saliva by striated ductal cells. Myoepithelial cell contraction is stimulated predominantly by adrenergic fibers, although there may be an additional role for cholinergic axons.
Summary
•Although embryologically the parotid consists of a single lobe, anatomically the facial nerve
lies in a distinct plane between the anatomical superficial and deep lobes.
•There are fixed anatomical landmarks indicating the origin of the extracranial facial nerve as it leaves the stylomastoid foramen.
•The lower pole of the parotid gland is separated from the posterior pole of the submandibular gland by only thin fascia. This can lead to diagnostic confusion in determining the origin of a swelling in this area.
•The relationship of the submandibular salivary duct to the lingual nerve is critical to the safe removal of stones within the duct.
•Great care must be taken to identify the lingual nerve when excising the submandibular gland. The lingual nerve is attached to the gland by the parasympathetic fibers synapsing in the submandibular (sublingual) ganglion.
•The sublingual gland may drain into the submandibular duct or it may drain directly into the floor of the mouth via multiple secretory ducts.
References
Berkovitz BKB, Langdon JD, Moxham BJ. 2003. The facial nerve and the parotid gland. In: Langdon JD, Berkovitz BKB, Moxham BJ (eds), Surgical Anatomy of the Infratemporal Fossa. London: Martin Dunitz, pp. 181–206.
Berkovitz BKB, Moxham BJ. 1988. A Textbook of Head and Neck Anatomy. London: Wolfe.
Bernstein L, Nelson RH. 1984. Surgical anatomy of the extraparotid distribution of the facial nerve. Arch Otolaryngol 110:177–183.
Davis RA, Anson BJ, Budinger JM, Kurth LE. 1956. Surgical anatomy of the facial nerve and parotid gland based on 350 cervicofacial halves. Surg Gynecol Obstet 102:385–412.
Ellis H. 1997. Clinical Anatomy (9th ed.). Oxford: Blackwell. Flatau AT, Mills PR. 1995. Regional anatomy. In: Norman JE deB, McGurk M (eds.), Color Atlas and Text of the
Salivary Glands. London: Mosby Wolfe, pp. 13–39. Garetea-Crelgo J, Gay-Escoda C, Bermejo B, Buenechea-
Imaz R. 1993. Morphological studies of the parotid lymph nodes. J Cranio-Maxillo-Facial Surg 21:207–209.
Gosain AK, Yousif NJ, Madiedo G et al. 1993. Surgical anatomy of the SMAS: A reinvestigation. Plast Reconstr Surg 92:1254–1263.
Hawthorn R, Flatau A. 1990. Temporomandibular joint anatomy. In: Norman JE deB, Bramley P (eds.), A Textbook and Colour Atlas of the Temporomandibular Joint. London: Mosby Wolfe, pp. 1–51.
Holt JJ. 1996. The stylomastoid area: Anatomic-histologic study and surgical approach. Laryngoscope 106:396–399.

18 Surgical Anatomy, Embryology, and Physiology of the Salivary Glands
Jost G, Levet Y. 1983. Parotid fascia and face lifting: A critical evaluation of the SMAS concept. Plast Reconstr Surg 74:42–51.
Langdon JD. 1998. Sublingual and submandibular gland excision. In: Langdon JD, Patel MF (eds.), Operative Maxillofacial Surgery. London: Chapman & Hall, pp. 376–380.
Langdon JD. 1998. Parotid surgery. In: Langdon JD, Patel MF (eds.), Operative Maxillofacial Surgery. London: Chapman & Hall, pp. 386–388.
Marks NJ. 1984. The anatomy of the lymph nodes of the parotid gland. Clin Otolaryngol 9:271–275.
McKean ME, Lee K, McGregor IA. 1985. The distribution of lymph nodes in and around the parotid gland: An anatomical study. Br J Plast Surg 38:1–5.
McMinn RMH, Hutchings RT, Logan BM. 1984. A Colour Atlas of Applied Anatomy. London: Wolfe.
Meningaud J-P, Bertolus C, Bertrand J-C. 2006. Parotidec-
tomy: Assessment of a surgical technique including facelift incision and SMAS advancement. J Cranio-Maxil- lofacial Surg 34:34–37.
Mitz V, Peyronie M. 1976. The superficial musculo-aponeu- rotic system (SMAS) in the parotid and cheek area. Plast Reconstr Surg 58:80–88.
Thaller SR, Kim S, Patterson H et al. 1989. The submuscular aponeurotic system (SMAS): A histologic and comparative anatomy evaluation. Plast Reconstr Surg 86:691–696.
Wassef M. 1987. Superficial fascia and muscular layers in the face and neck: A histological study. Aesthetic Plast Surg 11:171–176.
Williams PL (ed.). 1995. Gray’s Anatomy (38th ed.). Oxford: Blackwell.
Zigiotti GL, Liverani MB, Ghibellini D. 1991. The relationship between parotid and superficial fasciae. Surg Radiol Anat 13:293–300.

Chapter 2
Diagnostic Imaging of Salivary
Gland Pathology
Pradeep K. Jacob, MD, MBA
Outline
Introduction
Imaging Modalities
Computed Tomography (CT)
CT Technique
Advanced Computed Tomography
Magnetic Resonance Imaging (MRI)
MRI Technique
Spin-Echo T1
Spin-Echo T2
Proton Density Images (PD)
Gradient Recalled Echo Imaging (GRE)
Short Tau Inversion Recovery (STIR)
Gadolinium (Gd) Contrast
Fluid Attenuation Inversion Recovery (FLAIR)
Diffusion Weighted Images (DWI)
MR Spectroscopy (MRS)
Dynamic Contrast Enhanced Magnetic Resonance
Imaging
Other Magnetic Resonance Imaging Techniques
Ultrasonography (US)
US Technique
Radionuclide Imaging (RNI)
Positron Emission Tomography (PET)
Positron Emission Tomography/Computed
Tomography (PET/CT)
Diagnostic Imaging Anatomy
Parotid Gland
Submandibular Gland (SMG)
Sublingual Gland (SLG)
Minor Salivary Glands
Pathology of the Salivary Glands
Vascular Lesions
Lymphangioma (Cystic Hygroma)
Hemangioma
Acute Sialadenitis
Chronic Sialadenitis
HIV-Lymphoepithelial Lesions
Mucous Escape Phenomena
Sialadenosis (Sialosis)
Sialolithiasis
Sjogren’s Syndrome
Sarcoidosis
Congenital Anomalies of the Salivary Glands
First Branchial Cleft Cyst
Neoplasms—Salivary, Epithelial
Benign
Pleomorphic Adenoma
Warthin’s Tumor
Oncocytoma
Malignant Tumors
Mucoepidermoid Carcinoma
Adenoid Cystic Carcinoma
Neoplasms—Non-salivary
Benign
Lipoma
Neurogenic Tumors
Malignant
Lymphoma
Metastases
Summary
References
Introduction
Anatomic and functional diagnostic imaging plays a central role in modern medicine. Virtually all specialties of medicine to varying degrees depend on diagnostic imaging for diagnosis, therapy, and follow-up of treatment. Because of the complexity of the anatomy, treatment of diseases of the head and neck, including those of the salivary glands, are particularly dependent on quality medical imaging and interpretation. Medical diagnostic imaging is divided primarily into two major categories, anatomic and functional. The anatomic imaging modalities include computed tomography (CT), magnetic resonance imaging (MRI), and
19

20 Diagnostic Imaging of Salivary Gland Pathology
ultrasonography (US). Although occasionally obtained, plain film radiography for the head and neck, including salivary gland disease, is mostly of historical interest. In a similar manner, the use of sialography has been significantly reduced, although both plain films and sialography are of some use in imaging sialoliths. Functional diagnostic imaging techniques include planar scintigraphy, single photon emission computed tomography (SPECT), positron emission tomography (PET), and magnetic resonance spectroscopy (MRS), all of which are promising technologies. Recently, the use of a combined anatomic and functional modality in the form of PET/CT has proved invaluable in head and neck imaging. Previously widely employed procedures including gallium radionuclide imaging are less important today than in the past.
Imaging Modalities
COMPUTED TOMOGRAPHY (CT)
Computed tomography has become indispensable in the diagnosis, treatment, and follow-up of diseases of the head and neck. The latest generation of multiple-row detector CT (MDCT) provides excellent soft tissue and osseous delineation. The rapid speed with which images can be obtained along with the high spatial resolution and tissue contrast make CT the imaging modality of choice in head and neck imaging. True volumetric data sets obtained from multidetector row scanners allow for excellent coronal, sagittal, or oblique reformation of images as well as a variety of 3-D renderings. This allows the radiologist and surgeon to characterize a lesion and assess involvement of adjacent structures or local spread from the orthogonal projections or three-dimensional rendering. The ability to manipulate images is critical when assessing pathology in complex anatomy, such as evaluation of parotid gland masses to determine deep lobe involvement, facial nerve involvement, or extension into the skull base. Images in the coronal plane are important in evaluating the submandibular gland in relation to the floor of the mouth. Lymphadenopathy and its relationship to the carotid sheath and its contents and other structures are also well delineated. CT is also superior to MRI in demonstrating bone detail and calcifications. CT is also the fastest method of imaging head and neck anatomy. Other advantages include
widespread availability of scanners, high-resolu- tion images, and speed of image acquisition, which also reduces motion artifacts. Exposure to ionizing radiation and the administration of IV contrast are the only significant disadvantages to CT scanning.
CT Technique
The CT scanner contains a gantry, which holds an X-ray tube and a set of detectors. The X-ray tube is positioned opposite the detectors and is physically coupled. A “fan beam” of X-rays is produced and passes through the patient to the detectors as the tube and detector rotate around the patient. In the newer generation of scanners, the multiple rows of detectors are fixed around the gantry and only the tube rotates. A table carries the patient through the gantry. The detectors send signals, dependent on the degree of X-ray attenuation, to a computer, which uses this data to construct an image using complex algorithms.
For most CT studies (especially in the head and neck), intravenous contrast is administered. IV contrast is a solution consisting of organic compounds bonded with iodine molecules. Iodine is a dense atom with an atomic weight of 127, which is good at absorbing X-rays and is biocompatible. IV contrast readily attenuates the X-ray beam at concentrations optimal for vascular and soft tissue “enhancement,” but short of causing attenuationrelated artifacts. Streak artifacts, however, can occur if the concentration is too high, as seen occasionally at the thoracic inlet and supraclavicular region from dense opacification of the subclavian vein during rapid bolus injection of IV contrast.
CT of the neck should be performed with intravenous contrast whenever possible to optimize delineation of masses and inflammatory or infectious changes in the tissues and to enhance vascular structures. Imaging is obtained from the level of the orbits through the aortic arch in the axial plane with breath hold. The images are reconstructed using a computer algorithm to optimize soft tissue delineation, and displayed in soft tissue window and level settings (Figures 2.1 and 2.2). In a similar manner images are reconstructed using a computer algorithm to optimize bone details as more sharp and defined (Figure 2.3). The lung apex is often imaged in a complete neck evaluation and displayed using lung window settings

Diagnostic Imaging of Salivary Gland Pathology |
21 |
Figure 2.1. Axial CT of the neck in soft tissue window without contrast demonstrating poor definition between soft tissue structures. The blood vessels are unopacified and cannot be easily distinguished from lymph nodes. Note the sialolith (arrow) in the hilum of the left submandibular gland.
Figure 2.3. Axial CT of the skull base reconstructed in a sharp algorithm and in bone window and level display demonstrating sharp bone detail. Note the sharply defined normal right stylomastoid foramen (arrow).
Figure 2.2. Axial CT of the neck in soft tissue window with IV contrast demonstrates improved visualization of structures with enhancement of tissues and vasculature. Note the small lipoma (arrow) anterior to the left submandibular gland, which distorts the anterior aspect of the gland with slight posterior displacement.
(Figure 2.4a). Dedicated CT scans of the chest are beneficial in the postoperative evaluation of patients with salivary gland malignancies, as lung nodules can be observed, possibly indicative of metastatic disease (Figure 2.4b). Multiplanar reformatted images of the neck are obtained typically in the coronal and sagittal planes (Figures 2.5 and 2.6), although they may be obtained in virtually any plane desired or in a 3-D rendering.
The Hounsfield unit (H) (named for Godfrey Hounsfield, inventor of the CT scanner) is the unit of density measurement for CT. These units are assigned based on the degree of attenuation of the X-ray beam by tissue in a given voxel (volume element) and are assigned relative to water (0 H) (Table 2.1). The scale ranges from −1024 H for air, to +4000 H for very dense bone. The images are created based on a grayscale from black (−1024 H) to white (+4000 H) and shades of gray. Despite the wide range of units, the majority of tissues in the human body are between −100 and +100 H. Soft tissues and parenchymal organs are in a range between 20 and 80 H, whereas fat is approximately −100 H. Simple fluid is 0 H, but proteinaceous fluid can be upward of 25 H. Unclotted and clotted

22 Diagnostic Imaging of Salivary Gland Pathology
a
b
Figure 2.4. Axial CT of the neck at the thoracic inlet in lung windows demonstrating lung parenchyma (a). Axial image of dedicated CT of chest demonstrating cannon ball lesions in a patient previously treated for adenoid cystic carcinoma of the palate (b). These lesions are representative of diffuse metastatic disease of the lungs, but not pathognomonic of adenoid cystic carcinoma.
Figure 2.5. Coronal CT reformation of the neck in soft tissue window at the level of the submandibular glands. Orthogonal images with MDCT offer very good soft tissue detail in virtually any plane of interest in order to assess anatomic and pathologic relationships.
blood varies depending on the hemoglobin concentration and hematocrit, but average measurements are 50 H and 80 H, respectively. CT images are displayed using a combination of “window widths” (WW, range of CT numbers from black to white), and “window levels” (WL, position of the
Figure 2.6. Sagittal CT reformation of the neck in soft tissue window at the level of the parotid gland. Note the accessory parotid gland (black arrow) sitting atop the parotid (Stenson’s) duct (thin white arrow). Also note the retromandibular vein (large white arrow) and external auditory canal.
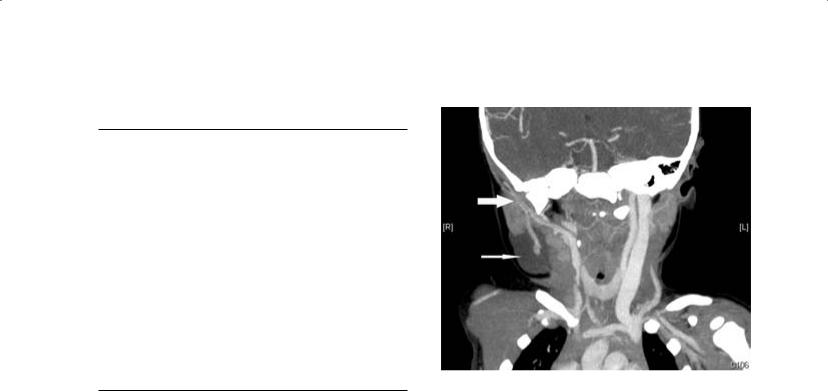
Table 2.1. CT density in Hounsfield units (H).
Tissue or Structure |
Hounsfield Unit (H) |
|
|
Water or CSF |
0 |
Fat |
−100 |
Soft tissue, muscle (a) |
50–60 |
Unclotted blood (b) |
35–50 |
Clotted blood (b) |
50–75 |
Parotid gland (c) |
−10 to +30 |
Submandibular gland (c) |
+30–+60 |
Sublingual gland (d) |
60–90 |
Bone |
1000 |
Lung |
−850 |
Air |
−1024 |
Calcification |
150–200 |
Grey matter |
35–40 |
White matter |
25–35 |
(a)Depends on degree of fat deposition.
(b)Depends on the hemoglobin concentration and hematocrit.
(c)Depends on age and fat deposition.
(d)Very limited evaluation secondary to partial volume effect. CSF = cerebrospinal fluid.
Diagnostic Imaging of Salivary Gland Pathology |
23 |
Figure 2.7. CT angiogram of the neck at the level of the parotid gland demonstrating the retromandibular vein and adjacent external carotid artery (large white arrow). Note the right cervical lymphangioma (thin white arrow) associated with the tail of the right parotid gland.
window on the scale), which are based on the attenuation characteristics of tissues. Typically, head and neck images are interpreted using “soft tissue windows” (WW 500 H, WL 30 H), “bone windows” (WW 2000, WL 500), or “lung windows” (WW 1500, WL −500). “Soft tissue windows” demonstrate the slight density differences of soft tissues, whereas “bone windows” demonstrate cortical and medullary features of bones with sharp detail. “Lung windows” demonstrate the sharp interface of air and the fine soft tissue components of lung parenchyma.
Although the density of the salivary glands is variable, the parotid glands tend to be slightly lower in density relative to muscle, secondary to a higher fat content, and become progressively more fat replaced over time. The CT density of parotid glands varies from −10 to +30 H. The submandibular glands are denser than parotid glands and are equivalent in density to muscle. The submandibular glands vary in density from +30 to +60 H.
CT angiography (CTA) is a powerful method that allows visualization of arterial vasculature, demonstrating the vascular anatomy of arteries and veins. CTA can be critical in preoperative evaluation to determine the degree of vascularity
of lesions and to plan an appropriate surgical approach to minimize blood loss or perform preoperative embolization. CTA is obtained with fast image acquisition over a defined region of interest while administering a rapid IV contrast bolus timed to arrive in the region of interest during image acquisition. CTA images may be rendered in 3-D data sets and rotated in any plane (Figure 2.7). CTA is not only useful for preoperative planning; it can also be quite useful in diagnosis of salivary gland vascular pathology such as aneurysms or arteriovenous fistulae (AVFs) (Wong, Ahuja, and King et al. 2004).
CT scanning, as with all imaging modalities, is prone to artifacts. Artifacts can be caused by motion, very dense or metallic implants (dental amalgam), and volume averaging. Motion artifact is common and may result from breathing, swallowing, coughing, or sneezing during the image acquisition or from an unaware or uncooperative patient. Metallic implants cause complete attenuation of X-rays in the beam and result in focal loss of data and bright and dark streaks in the image. Because the image is created from a three-dimen- sional section of tissue averaged to form a twodimensional image, the partial volume or volume averaging artifact results from partial inclusion of structures in adjacent images. Finally, the beam

24 Diagnostic Imaging of Salivary Gland Pathology
hardening artifact is produced by attenuation of low energy X-rays, by dense objects, from the energy spectrum of the X-ray beam, resulting in a residual average high energy beam (or hard X- rays), which results in loss of data and dark lines on the image. This phenomenon is often seen in the posterior fossa of head CT scans caused by the very dense petrous bones. A multidetector row CT scanner can help reduce metallic artifacts using advanced algorithms, and can reduce motion artifacts secondary to faster scanning speeds.
Advanced Computed Tomography
Newer CT techniques including CT perfusion and dynamic contrast enhanced multi-slice CT have been studied. Dynamic multi-slice contrast enhanced CT is obtained while scanning over a region of interest and simultaneously administering IV contrast. The characteristics of tissues can then be studied as the contrast bolus arrives at the lesion and “washes in” to the tumor, reaches a peak presence within the mass, and then decreases over time, that is, “washes out.” This technique has demonstrated differences in various histologic types of tumors, for example, with early enhancement in Warthin’s tumor with a time to peak at 30 seconds and subsequent fast washout. The malignant tumors show a time to peak at 90 seconds. The pleomorphic adenomas demonstrate a continued rise in enhancement in all four phases (Yerli, Aydin, and Coskum et al. 2007).
CT perfusion attempts to study physiologic parameters of blood volume, blood flow, mean transit time, and capillary permeability surface product. Statistically significant differences between malignant and benign tumors have been demonstrated with the mean transit time measurement. A rapid mean transit time of less then 3.5 seconds is seen with most malignant tumors, but with benign tumors or normal tissue the mean transit time is significantly longer (Rumboldt, Al-Okkaili, and Deveikis 2005).
MAGNETIC RESONANCE IMAGING (MRI)
Magnetic resonance imaging represents imaging technology with great promise in characterizing salivary gland pathology. The higher tissue contrast of MRI, when compared to CT, enables subtle differences in soft tissues to be demonstrated. Gadolinium contrast enhanced MRI further and accen-
tuates the soft tissue contrast. Subtle pathologic states such as perineural spread of disease are better delineated when compared with CT. This along with excellent resolution and exquisite details make MRI a very powerful technique in head and neck imaging, particularly at the skull base. However, its susceptibility to motion artifacts and long imaging time as well as contraindication due to claustrophobia, pacemakers, aneurysm clips, and deep brain and vagal nerve stimulators limit its usefulness in the general population as a routine initial diagnostic and follow-up imaging modality. Many of the safety considerations are well defined and detailed on the popular Web site www.mrisafety.com.
MRI Technique
Although the physics and instrumentation of MRI are beyond the scope of this text, a fundamental understanding of the variety of different imaging sequences and techniques should be understood by clinicians in order to facilitate reciprocal communication of the clinical problem and understanding of imaging reports.
In contrast to CT, which is based on the use of ionizing radiation, MRI utilizes a high magnetic field and pulsed radiofrequency waves in order to create an image or obtain spectroscopic data. MRI is based on the proton (hydrogen ion) distribution throughout the body. The basic concept is that protons are normally oriented in a random state. However, once placed in the imaging magnet, a high magnetic field, a large proportion of protons align with the magnetic field. The protons remain aligned and precess (spin) in the magnetic field until an external force acts upon them and forces them out of alignment. This force is an applied radiofrequency pulse, used for a specified time and specified frequency by an antenna called a transmit coil. As the protons return to the aligned state, they give off energy in the form of their own radiofrequency pulse, determined by their local chemical state and tissue structure. The radiofrequency pulse given off is captured by an antenna, called a receive coil. The energy of the pulse and location is recorded and the process repeated multiple times and averaged, as the signal is weak. The recorded signal is used to form the image. Several different types of applied pulse sequences of radio waves result in different types of images.

The impact of MRI is in the soft tissue contrast that can be obtained, non-invasively. The relaxation times of tissues can be manipulated to bring out soft tissue detail. The routine sequences used in clinical scanning are spin-echo (SE), gradient echo (GRE), and echo-planar (EPI). Typical pulse sequences for head and neck and brain imaging include spin-echo T1, spin-echo T2, proton density (PD), FLAIR, dwi, post-contrast T1, and STIR. A variant of the spin-echo, the fast spin-echo sequence (FSE), allows for a more rapid acquisition of spin-echo images. Any one of these can be obtained in the three standard orientations of axial, coronal, and sagittal planes. Oblique planes may be obtained in special circumstances.
Spin-Echo T1
On T1 weighted images a short repetition time (tr) and short echo time (te) are applied, resulting in an image commonly used for anatomic depiction. Water signal is very low and is displayed as dark gray to black pixels on the grayscale. Fat is very bright, allowing tissue planes to be delineated. Fast flowing blood is devoid of signal and is therefore very black. Muscle tissue is an intermediate gray. Bone that has few free protons is also largely devoid of signal. Bone marrow, however, will vary depending on the relative percentage of red versus yellow marrow. Red marrow will have a signal similar to but slightly lower than muscle, whereas yellow marrow (fat replaced) will be bright. In the brain, cerebrospinal fluid (CSF) is dark, and flowing blood is black. Grey matter is dark relative to white matter (contains fatty myelin), but both are higher than CSF but less than fat. Cysts (simple) are dark in signal unless they are complicated by hemorrhage or infection or have elevated protein concentration, which results in an increased signal and slightly brighter display (Figure 2.8, Table 2.2).
Spin-Echo T2
The T2 images are obtained with a long tr and te. The T2 image is sensitive to the presence of water in tissues and depicts edema as a very bright signal. Therefore, CSF or fluid-containing structures such as cysts are very bright. Complicated cysts can vary in T2 images. If hemorrhagic, they can have a heterogenous or even uniformly dark signal caused by a susceptibility artifact. These
Diagnostic Imaging of Salivary Gland Pathology |
25 |
Figure 2.8. Axial MRI T1 weighted image at level of the skull base and brainstem without contrast demonstrating high signal in the subcutaneous fat, intermediate signal of the brain, and low signal of the CSF and mucosa. Note dilated right parotid duct (arrow).
Figure 2.9. Axial MRI FSE T2 weighted image demonstrating the high signal of CSF and subcutaneous fat, intermediate signal of the brain and mucosa, and the low signal in the arteries.