

Учебники / Textbook and Color Atlas of Salivary Gland Pathology - DIAGNOSIS AND MANAGEMENT Carlson 2008
.pdf36 Diagnostic Imaging of Salivary Gland Pathology
a |
a |
b |
b |
Figure 2.22. CT (a) and PET (b) images in axial plane demonstrating normal parotid gland activity (arrow).
does not influence FDG imaging (Stahl et al. 2002). SUV of greater then 2.5 has become a threshold for abnormal or neoplastic uptake (originally described by Patz et al.) (Patz, Lowe, and Hoffman et al. 1993; Wang et al. 2007). However, careful analysis must be undertaken when evaluating lesions based on SUVs, as there is a significant
Figure 2.23. CT (a) and PET (b) images in axial plane demonstrating normal submandibular (long thin arrow) and sublingual gland (medium arrow) activity. Note the abnormal uptake higher than and anterior to the submandibular glands (short fat arrow). Metastatic lymphadenopathy was diagnosed at the time of surgery.
overlap of SUVs for malignant and benign tumors and inflammatory conditions. One cannot depend on SUV measurements alone and must take into consideration clinical data as well as radiologic imaging findings.

Table 2.3. SUV of salivary glands.
Gland |
SUV Max |
SUV Mean |
SUV Mean |
|
(Range) (a) |
± SD (a) |
± SD (b) |
|
|
|
|
Parotid gland |
0.78–20.45 |
1.75 ± 0.79 |
1.90 ± 0.68 |
Submandibular |
0.56–5.14 |
2.22 ± 0.77 |
2.11 ± 0.57 |
gland |
|
4.06 ± 1.76 |
2.93 ± 1.39 |
Sublingual |
0.93–5.91 |
gland
(a)Wang et al. 2007.
(b)Nakamoto, Tatsumi, and Hammoud et al. 2005. SD = standard deviation.
POSITRON EMISSION TOMOGRAPHY/ COMPUTED TOMOGRAPHY (PET/CT)
Head and neck imaging has greatly benefited from the use of FDG PET imaging for the staging, restaging, and follow-up of neoplasms. The recent introduction of PET/CT has dramatically changed the imaging of diseases of the head and neck by directly combining anatomic and functional imaging.
The evaluation of the head and neck with FDG PET/CT has been significantly and positively affected with detection and demonstration of the extent of primary disease, lymphadenopathy, and scar versus recurrent or residual disease, pre-surgi- cal staging, pre-radiosurgery planning, and followup post-therapy.
The role of FDG PET or PET/CT and that of conventional CT and MRI on the diagnosis, staging, restaging, and follow-up post-therapy of salivary gland tumors have been studied (Bui, Ching, and Carlos et al. 2003; de Ru, Van Leeuwen, and Van Benthem et al. 2007; Keyes, Harkness, and Greven et al. 1994; Otsuka et al. 2005; Roh, Ryu, and Choi et al. 2007). Although both CT and MRI are relatively equal in anatomic localization of disease and the effect of the tumors on local invasion and cervical nodal metastases, FDG PET/CT significantly improved sensitivity and specificity for salivary malignancies including nodal metastases (de Ru, Van Leeuwen, and Van Benthem et al. 2007; Jeong, Chung, and Son et al. 2007; Otsuka et al. 2005; Roh, Ryu, and Choi et al. 2007; Uchida, Minoshima, and Kawata et al. 2005).
Early studies have demonstrated FDG PET’s relative inability to distinguish benign from malignant salivary neoplasms (Keyes, Harkness, and Greven et al. 1994). The variable uptake of FDG
Diagnostic Imaging of Salivary Gland Pathology |
37 |
by pleomorphic adenomas and the increased uptake and SUVs by Warthin’s tumor result in significant false positives (Jeong, Chung, and Son et al. 2007; Roh, Ryu, and Choi et al. 2007). In a similar manner, adenoid cystic carcinomas, which are relatively slower growing, may not accumulate significant concentrations of FDG and demonstrate low SUVs and therefore contribute to the false negatives (Jeong, Chung, and Son et al. 2007; Keyes, Harkness, and Greven et al. 1994). False negatives may also be caused by the relatively lower mean SUV of salivary tumors (SUV 3.8 ± 2.1) relative to squamous cell carcinoma (SUV 7.5
± 3.4)(Roh, Ryu, and Choi et al. 2007). The low SUV of salivary neoplasms may also be obscured by the normal uptake of FDG by salivary glands (Roh, Ryu, and Choi et al. 2007). In general, FDG PET has demonstrated that lower grade malignancies tend to have lower SUV and vice versa for higher grade malignancies (Jeong, Chung, and Son et al. 2007; Roh, Ryu, and Choi et al. 2007). FDG PET has been shown to be more sensitive and specific compared to conventional CT or MRI (Cermik, Mavi, and Acikgoz et al. 2007; Otsuka et al. 2005; Roh, Ryu, and Choi et al. 2007). Small tumor size can contribute to false negative results and inflammatory changes contribute to false positive results (Roh, Ryu, and Choi et al. 2007). The use of concurrent salivary scintigraphy with 99mTcpertechnetate imaging can improve the false positive rate by identifying Warthin’s tumors and oncocytomas, which tend to accumulate pertechnetate (and retain it after induced salivary gland washout) and have increased uptake of FDG (Uchida, Minoshima, and Kawata et al. 2005).
Diagnostic Imaging Anatomy
PAROTID GLAND
The average adult parotid gland measures 3.4 cm in AP, 3.7 cm in LR, and 5.8 cm in SI dimensions and is the largest salivary gland. The parotid gland is positioned high in the suprahyoid neck directly inferior to the external auditory canal (EAC) and wedged between the posterior border of the mandible and anterior border of the styloid process, sternocleidomastoid muscle, and posterior belly of the digastric muscle (Figures 2.24 through 2.30; also see figures 2.17 through 2.19). This position, as well as the seventh cranial nerve, which traverses the gland, divides the gland functionally

38 Diagnostic Imaging of Salivary Gland Pathology
Figure 2.24. Axial CT of the neck demonstrates the intermediate to low density of the parotid gland.
Figure 2.25. Reformatted coronal CT of the neck at the level of the parotid gland demonstrating its relationship to adjacent structures. Note the distinct soft tissue anatomy below the skull base.
Figure 2.26. Reformatted sagittal CT of the neck at the level of the parotid gland demonstrating its relationship to adjacent structures including the external auditory canal. Note the slightly denser soft tissue density in the parotid tail, the so-called “earring lesion” of the parotid gland. Cervical lymphadenopathy (arrow) was diagnosed at surgery.
(not anatomically) into superficial and deep “lobes.” Its inferior extent is to the level of the angle of the mandible, where its “tail” is interposed between the platysma superficially and the sternocleidomastoid muscle (SCM) deep to the tail of the parotid. The parotid gland is surrounded by the superficial layer of the deep cervical fascia. The parotid space is bordered medially by the parapharyngeal space (PPS), the carotid space (CS), and the posterior belly of the digastric muscle. The anterior border is made up of the angle and ramus of the mandible along with the masticator space (MS). The posterior border is made up of the styloid and mastoid processes and the SCM. The gland traverses the stylomandibular tunnel, which
Diagnostic Imaging of Salivary Gland Pathology |
39 |
Figure 2.27. Axial T1 MRI image at the level of the parotid gland demonstrating the slightly higher signal as compared to skeletal muscle but less than subcutaneous fat.
Figure 2.29. Sagittal fat suppressed T1 MRI image of the parotid gland demonstrating mild enhancement and lack of subcutaneous fat signal in the upper neck but incomplete fat suppression at the base of the neck.
Figure 2.28. Coronal STIR MRI image at the level of the parotid gland demonstrating the nulling of the subcutaneous fat signal on STIR images and low signal from the partially fatty parotid gland.
is formed by the posterior border of the mandibular ramus, the anterior border of the sternocleidomastoid muscle, the anterior border of the stylomandibular ligament, and the anterior border of the posterior belly of the digastric muscle and the skull base on its superior aspect (Beale and Madani 2006; Som and Curtin 1996). The external carotid artery (ECA) and retromandibular vein (RMV) traverse the gland in a craniocaudal direction, posterior to the posterior border of the mandibular ramus. The seventh cranial nerve (CN 7) traverses the gland in the slightly oblique anteroposterior direction from the stylomastoid foramen to the anterior border of the gland passing just lateral to the RMV. The seventh cranial nerve divides into five branches (temporal, zygomatic, buccal, mandibular, and cervical) within the substance of the gland. Prior to entering the substance of the parotid gland, the facial nerve gives off small branches, the posterior auricular, posterior digastric, and the stylohyoid nerves. The intraparotid facial nerve and duct can be demonstrated by MRI using surface coils and high-resolution acquisition (Takahashi et al. 2005). Because the parotid gland encapsulates later in development than other salivary glands, lymph nodes become incorporated

40 Diagnostic Imaging of Salivary Gland Pathology
a
b
Figure 2.30. Axial CT scan (a) and corresponding PET scan (b) at the level of the parotid gland. Note the asymmetric slightly higher uptake on the right corresponding to partially resected parotid gland on the left, confirmed by CT.
into the substance of the gland. The parotid duct emanates from the superficial anterior part of the gland and is positioned along the superficial surface of the masseter muscle. Along the anterior aspect of the masseter muscle the duct turns medially, posterior to the zygomaticus major and minor muscle, to penetrate the buccinator muscle and
terminate in the oral mucosa lateral to the maxillary second molar. Fifteen to 20% of the general population also has an accessory parotid gland that lies along the surface of the masseter muscle in the path of the parotid duct.
In the pediatric population, the parotid gland is isodense to skeletal muscle by CT and becomes progressively but variably fatty replaced with aging. Therefore the CT density will progressively decrease over time (Drumond 1995). By MRI the parotid gland is isointense to skeletal muscle on T1 and T2 weighted images, but with progressive fatty replacement demonstrates progressive increase in signal (brighter) similar to but remaining less than subcutaneous fat. Administration of iodinated contrast for CT results in slight enhancement (increase in density and therefore brightness). Administration of intravenous gadolinium (Gd) contrast results in an increase in signal (T1 shortening) and therefore brightness on MRI scans. By US the acoustic signature is isoechoic to muscle, but with fatty replacement becomes hyperechoic (more heterogenous grey). Therefore, masses tend to stand out as less echogenic foci. Normal uptake on FDG PET varies but is mild to moderate relative to muscle and decreases over age.
SUBMANDIBULAR GLAND (SMG)
The submandibular gland is located in the upper neck in the submandibular space (SMS) and the posterior oral cavity in the sublingual space (SLS). The SMG is more difficult to measure, but the average adult superficial SMG measures 3.5 cm in oblique AP, 1.4 cm in oblique LR, and 3.3 cm in SI dimensions. The gland “wraps” around the posterior border of the mylohyoid muscle and traverses the two spaces. The superficial portion is in the SMS adjacent to level one lymph nodes (level 1b). The deep portion of the submandibular gland is located in the SLS. The SMS is bordered inferiorly by the hyoid bone and platysma and superiorly by the mylohyoid muscle. It is bordered laterally by the mandible and it is surrounded by the superficial layer of deep cervical fascia. Its medial border is a combination of the mylohyoid sling and anterior belly of the digastric muscle (Beale and Madani 2006) (Figures 2.31 through 2.37).
The submandibular duct emanates from the anterior-superior aspect of the gland and turns anteriorly and lies along the superior surface of the mylohyoid muscle between the genioglossus muscle medially and the sublingual gland laterally. The

Figure 2.31. Axial CT at the level of the submandibular gland demonstrating density higher than skeletal muscle.
Figure 2.32. Reformatted coronal CT at the level of the submandibular gland demonstrating its relationship to the mylohyoid muscle and floor of the mouth.
Figure 2.33. Reformatted sagittal CT at the level of the submandibular gland demonstrating its relationship to the floor of the mouth. Note the slight notch at the hilum of the gland. Majority of the gland “hangs” below the mylohyoid muscle.
Figure 2.34. Axial T1 MRI of the submandibular gland demonstrating slight hyperintensity to muscle. Note the bright subcutaneous fat.
41

Figure 2.35. Coronal fat saturated T2 MRI of the submandibular gland. Note the slightly incomplete fat suppression and the engorged and edematous mucosa of the nasal cavity and turbinates.
Figure 2.36. Sagittal T1 fat saturated MRI of the submandibular gland demonstrating the well-defined appearance on a fat suppressed background. Note the slight notch at the hilum. Also note the entire internal jugular vein is visualized.
a b
Figure 2.37. Axial CT (a) and corresponding PET (b) of the submandibular gland demonstrating slight normal uptake. Note the strong asymmetry of uptake on the PET corresponds to the absent submandibular gland on the right confirmed by the CT.
42

Diagnostic Imaging of Salivary Gland Pathology |
43 |
ducts open into the anterior medial (paramidline) floor of the mouth at the sublingual papillae.
On CT scans the submandibular gland has a density that is isodense to slightly hyperdense relative to skeletal muscle. The gland does not become as fatty replaced as the parotid gland. The SMG demonstrates a signal characteristic similar to that of skeletal muscle on T1 and T2 weighted images and is less intense when compared to the parotid gland secondary to less fatty replacement. The FDG uptake is moderate but higher than that of the parotid gland. The SMG undergoes contrast enhancement by CT and MRI (Kaneda 1996).
SUBLINGUAL GLAND (SLG)
The sublingual gland is the smallest of the major salivary glands and is the least likely to be involved with pathology. The SLG measures approximately 3.5 cm in oblique AP, 1.0 cm in oblique LR, and 1.5 cm in SI dimensions. Anatomically, the SLGs are located in the floor of the mouth and lie on the superior surface of the mylohyoid muscle, bordered anteriorly and laterally by the mandible, and medially by the submandibular duct, genioglossus muscle, and geniohyoid muscle. The submandibular gland serves as its posterior border (Figures 2.38 through 2.40). The sublingual gland commu-
Figure 2.38. Axial CT of the neck at the level of the sublingual gland demonstrating mild normal enhancement along the lateral floor of the mouth.
a
b
Figure 2.39. Axial contrast enhanced T1 MRI of the sublingual gland demonstrating enhancement (a). Note the deep lobe of the submandibular glands seen at the posterior margin of the sublingual glands. Coronal T2 weighted image demonstrating the sublingual gland “cradled” between the mandible laterally, the genioglossus muscle medially, the geniohyoid muscle inferomedially, and the combined mylohyoid and digastric muscles inferiorly (b).

44 Diagnostic Imaging of Salivary Gland Pathology
Figure 2.40. Axial PET of the sublingual gland demonstrating the intense uptake seen in the sublingual glands bilaterally medial to the mandible (photopenic linear regions).
nicates with the oral cavity via multiple small ducts (ducts of Rivinus) that open into the floor of the mouth adjacent to the sublingual papilla. These small ducts may be fused and form a larger single duct (duct of Bartholin) and empty into the submandibular duct (Beale and Madani 2006).
The SLG can be seen by CT and MRI and is similar in appearance to the SMG, although smaller (Sumi et al. 1999a). FDG uptake is less well defined since it is small and closely approximated to adjacent skeletal muscle, but the uptake is moderate.
Occasionally accessory salivary tissue is found in the SMS along the anterior aspect (anterior to the normal submandibular gland). This is caused by herniation of SLG through defects in the mylohyoid muscle, called a mylohyoid boutonniere, which typically occurs between the anterior and posterior parts of the mylohyoid muscle. The accessory gland may be accompanied by sublingual branches of the facial artery and vein. Although the accessory tissue may mimic a tumor, this should be readily identified as normal since the accessory tissue has the same characteristics on CT and MRI as normal sublingual or submandibular gland (Hopp, Mortensen, and Kolbenstvedt
2004; White, Davidson, and Harnsberger et al. 2001).
MINOR SALIVARY GLANDS
The minor salivary glands are unevenly distributed throughout the upper aerodigestive tract and are submucosal in location. They are more concentrated in the oral mucosa, where they inhabit the mucosa of the hard and soft palate, buccal mucosa, and floor of the mouth, as well as the mucosa of the lips, gingiva, and tongue. They are also found in the pharynx (nasal and oral), sinonasal spaces, larynx, trachea, and bronchi. Functionally they are either mucinous (predominantly in the palatal mucosa) or mixed seromucinous glands. The serous minor salivary glands are found only on the tongue at the circumvallate papilla. The minor salivary glands do not have large defined ducts but do contain multiple small excretory ducts. MRI of minor salivary glands has been achieved with high-resolution surface coils of the upper and lower lips. Patients with Sjogren’s disease had a smaller gland area relative to normal, best demonstrated in the upper lip (Sumi et al. 2007).
Pathology of the Salivary Glands
Pathologic states of the salivary glands include tumors (epithelial and non-epithelial), infections and inflammation, autoimmune diseases, vascular lesion, and non-salivary tumors.
Of all salivary gland tumors, the vast majority (80%) are found in the parotid gland. The submandibular gland contains approximately 10%, with the remainder in the sublingual and minor salivary glands. Of all parotid gland tumors, 80% are benign and 20% malignant. About 50% of submandibular gland tumors are benign and the vast majority of sublingual gland tumors are malignant. About 50% of minor salivary gland tumors are benign. The smaller the gland, the more likely that a mass within it is malignant. The pleomorphic adenoma and papillary cystadenoma lymphomatosum (Warthin’s) account for the vast majority of benign salivary tumors, with the former being the more common at about 80% of benign and the latter less common at about 15% of benign masses. Most of the malignant salivary gland tumors are represented by mucoepidermoid and adenoid cystic carcinomas.
Malignancies of the parotid gland may result in metastatic involvement of intraparotid and adjacent level II and III jugular chain lymph nodes. The SMG drains primarily into adjacent level Ib lymph nodes and then into the jugular chain and deep cervical nodes. The SLG drains into both level IA and IB nodes and then subsequently into the jugular chain and deep cervical nodes.
VASCULAR LESIONS
Lymphangioma (Cystic Hygroma)
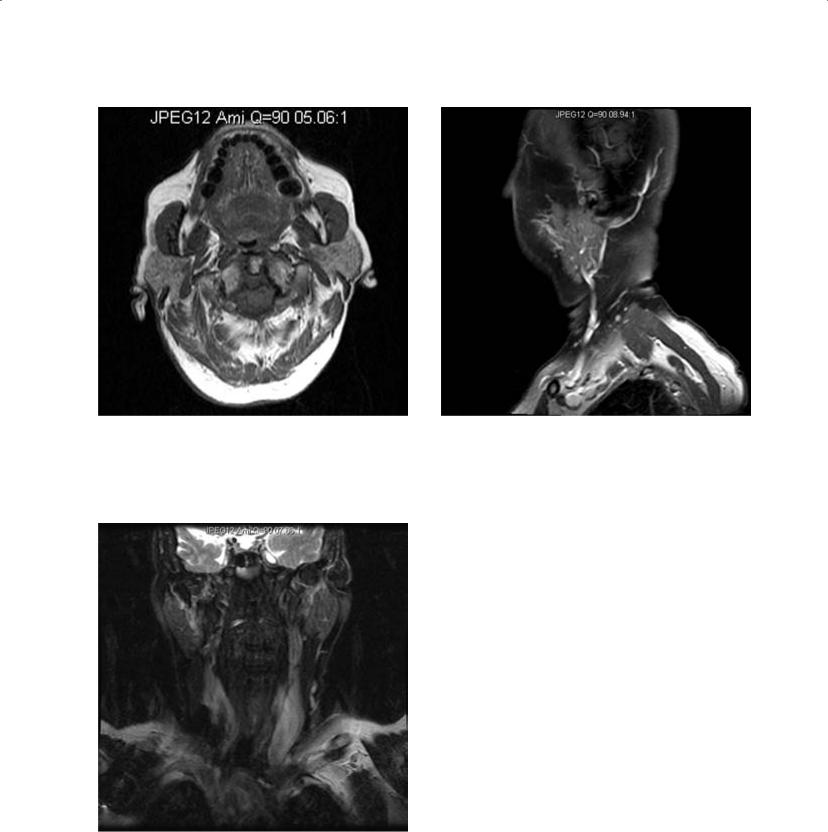
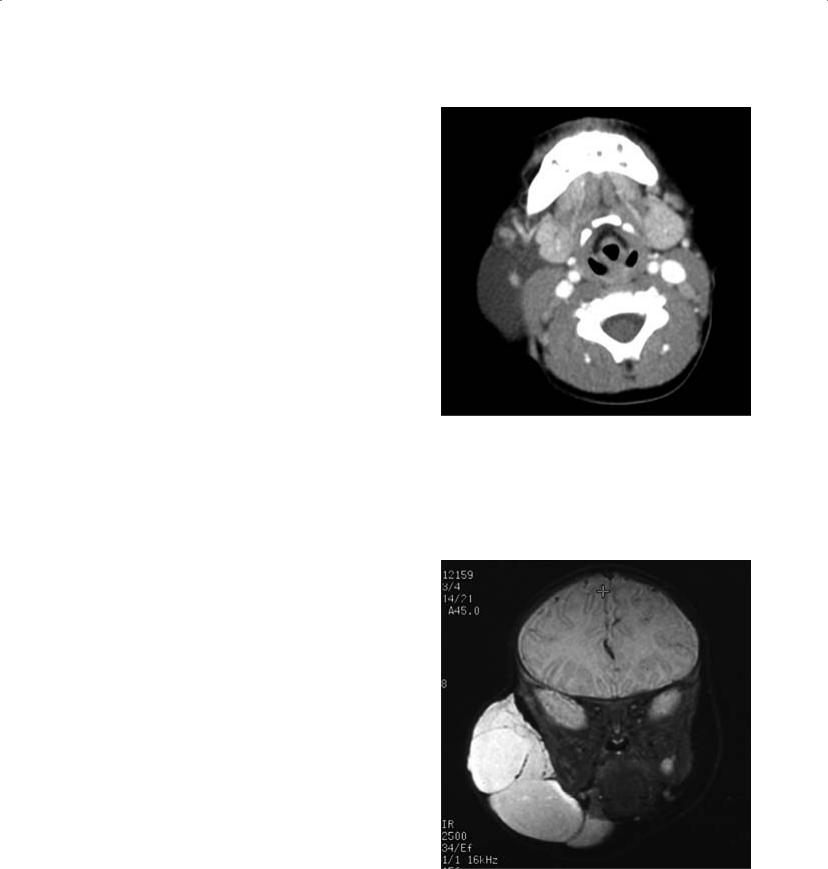
The cystic hygroma is included in this discussion because of its transpatial location and the fact that it may mimic other cystic masses. It is typically multilocular and has an epicenter in the posterior triangle, but it may be found in the submandibular space and less commonly in the sublingual space. The imaging characteristics are those of cysts and follow fluid density on CT and signal intensity on MRI, although they do typically demonstrate internal architecture from septation with varying thickness. CT typically demonstrates isodensity to simple fluid or slight hyperdensity if infected or if it contains products of hemorrhage (Koeller et al. 1999; Makariou, Pikis, and Harley 2003) (Figure 2.41). US demonstrates anechoic spaces consistent with simple fluid with septa of variable thickness. Like cystic lesions (and a few solid lesions), there is increased through-transmission. Infection and hemorrhage cause variable degrees of echogenicity and thicker septations (Koeller et al. 1999; Makariou, Pikis, and Harley 2003). MRI, however, can be variable on both T1 and T2 sequences based on the fluid characteristics. With simple fluid, T1 and T2 are isointense to simple fluid (CSF), but with infection or hemorrhage products, the increased protein concentration as well as cellular debris and iron from hemoglobin can result in varying degrees of T1 hyperintensity and variable hypoor hyperintensity on T2 (Figure 2.42). Any of these modalities may demonstrate fluidfluid or fluid-debris layers. Both CT and MRI will demonstrate enhancement in the setting of infection (Macdonald, Salzman, and Hansberger 2003). These lesions are more common in the pediatric age group, although small lesions may persist into adulthood. When found in the submandibular or sublingual space, they may be mistaken for a ranula (especially giant or plunging ranulae) and less likely hemangioma or thyroglossal duct cyst if midline (Kurabayashi, Ida, and Yasumoto et al.
Diagnostic Imaging of Salivary Gland Pathology |
45 |
Figure 2.41. Axial contrast enhanced CT of the neck at the level of the submandibular glands demonstrating a low-density structure on the right of approximately fluid density (compare to the CSF in the spinal canal), which is intermediate in density relative to the muscles and subcutaneous fat. A large lymphangioma associated with the right submandibular gland was diagnosed.
Figure 2.42. Coronal STIR MRI of the face of a different patient with a very large lymphangioma with large septations. Note the lymphangioma fluid is brighter than the CSF and there is fat suppression of the subcutaneous fat.