

Multidimensional Chromatography
.pdf110 |
Multidimensional Chromatography |
or by various combinations of columns possessing complementary separation characteristics. This technique provides the optimum efficiency and selectivity for separations of the component of interest, while simultaneously minimizing the analysis time by decreasing the time spent in separating those components of the sample that are of no analytical interest. Multidimensional chromatography (also known as cou- pled-column chromatography or column switching) represents a powerful tool and an alternative procedure to classical one-dimensional HPLC methods.
Multidimensional liquid chromatography can be performed either in an on-line or off-line mode. With off-line operation, the fractions eluted from the primary column are collected manually or by a fraction collector and then reinjected, either with or without concentration, into a second column. This approach has the advantage of being simple, does not need any switching valve, and the mobile phases used in each column need not be mutually compatible. However, these procedures are labourintensive and time-consuming and the recovery of sample is often low. On-line techniques have the advantage of automation by using pneumatic or electronically controlled valving, which switches the column effluent directly from the primary column into the secondary column. Automation improves reliability and sample throughput, and shortens the analysis time, as well as minimizing sample loss or change since the analysis is performed in a closed-loop system. Obviously, on-line techniques are preferred, although they are not always feasible from an operational point of view. The main limitation is that the mobile phase system used in the coupled columns must be compatible in both miscibility and solvent strength. This requirement arises since the eluent from the first column is the injection solvent for the second column; consequently, not all column types are mutually compatible. Furthermore, the use of two different separation principles may lead to an inversion of the elution order on the two subsequent columns. Hence, the separation achieved on the first column can be substantially reduced on the second column. A comparison of advantages and disadvantages of offand on-line multidimensional liquid chromatographic techniques is shown in Table 5.1.
Multidimensional LC separation has been defined as a technique which is mainly characterized by two distinct criteria, as follows (1). The first criterion for a multidimensional system is that sample components must be displaced by two or more separation techniques involving orthogonal separation mechanisms (2), while the second criterion is that components that are separated by any single separation dimension must not be recombined in any further separation dimension.
Coupled-column liquid chromatography (LC – LC coupling) refers to the conventional two-dimensional mode of chromatography in which fractions from one column are selectively transferred to one secondary column for a further separation. What characterizes LC – LC coupling when compared to conventional multistep chromatography is the requirement that the whole chromatographic process be carried out on-line. The transferred volume of the mobile phase from the first column to the second column can correspond to a group of peaks, a single peak or a fraction of a peak, so that different parts of the sample may follow different paths through the LC – LC configuration. A large number of factors play a role in the development of an LC – LC procedure; these include the separating power of the chromatographic

Coupled-Column Liquid Chromatography |
|
111 |
|
|
Table 5.1 Comparison of offand on-line multidimensional LC techniques |
||
|
|
||
|
Off-line multidimentional chromatography |
||
|
Advantages |
|
Disadvantages |
• Easy to carry out by collection of |
• |
Labour intensive |
|
|
column effluent |
|
|
• Can concentrate trace solutes from |
• |
More time consuming |
|
|
large volumes |
|
|
• Can work with two LC modes that |
• Sample loss or contamination |
||
|
use incompatible solvents |
|
during handling |
|
On-line multidimentional chromatography |
||
|
Advantages |
|
Disadvantages |
• |
Easy to automate |
• Incompatibility of different mobile |
|
|
|
|
phase system |
• No loss or contamination |
• Separation obtained on the first |
||
|
|
|
column can, at least partly, be |
|
|
|
reduced on the second column |
• Decreased total analysis time |
• Requires automated or semi-automated |
||
|
|
|
instrumentation |
• |
More reproducible |
|
|
|
|
|
|
columns, mobile phase composition, the nature and number of analytes, and the type of matrix and its related interferences. In order to achieve this, simple valving circuits can be used with conventional LC apparatus.
5.2THEORETICAL ASPECTS
In order to optimize separations on coupled-column liquid chromatographic systems under the conditions of solvent modulation, we need to consider the parameters which affect the resolution, as follows.
The basic measure of the efficacy of a single-column chromatographic system in separating two neighbouring peaks can be effected by the resolution (Rs), which is equal to the ratio between the two peak maxima, tr (distance between the peak centres) and the average base width of the two peaks, as follows (3):
RS |
tr |
|
2(tr,2 |
tr,1) |
|
tr |
(5.1) |
||||
w |
(w |
1 |
w |
) |
4 |
|
|||||
|
|
|
|
||||||||
|
|
|
|
2 |
|
|
|
t |
|
||
where tr,1 and tr,2 are the retention times, w1 and w2 are the peak widths measured by the baseline intercept and t is the mean standard deviation of a Gaussian peak.
For closely spaced peaks, the resolution may be expressed as the product of three factors (a,b,c), which are related to the adjustable variables of a chromatographic system as follows:
RS
|
1 |
1 |
|
|
|
(a) |
|
k 2 |
|
|
N |
|
1/2 |
|
|
|
|
||
k 2 |
16 |
|
|
||
|
|
||||
(b) (c)
(5.2)
112 Multidimensional Chromatography
where ( ) is the selectivity, which is a useful measure of relative peak separation related to the discriminatory power of the chromatographic system, (b) is the retention, which expresses the retentive power of the chromatographic system, and (c) is the efficiency, which measures the peak broading that occurs in the chromatographic column (together with extra-column contributions, which in a well-designed system are small). The three terms of equation (5.2) are essentially independent, so that we can optimize first one, and then the others. The separation can be improved by varying the selectivity of the system ( ) by increasing N, and also by increasing the retention factor by changing the solvent strength, until the term (k /(1 k )) reach a plateau. Resolution is seen to be proportional to the term (k /(1 k )) of equation (5.2), which corresponds to the fraction of the sample that is in the stationary phase. Small values of k mean that the sample is largely in the mobile phase, and under these conditions a poor separation of the sample is achieved. At high k values, the factor (k /(1 k )) : 1 and it may therefore be thought that k should be high. However, high k values lead to very long retention times, with the concomitant elution of excessively broad peaks which can be undetectable with available detectors. It can be shown that k should not be much greater than 5 if reasonable analysis times are to be obtained.
Therefore, the expression given in equation (5.2) suggests that when 1, in order to optimize a given separation and to achieve a short time of analysis and good sensitivity, the first factor to be optimized is k , and it may be shown that values between 1.5 and 5 represent a reasonable compromise. Separation efficiency, as measured by N, can be varied by changing the column length L or the solvent velocity u. N is usually chosen to provide the maximum efficiency compatible with a reasonable analysis time. The operation of extended column lengths without increasing the flow rate of the eluent necessarily increases the analysis time, and hence decreases the throughput of samples. On the other hand, doubling the length of the column will require a twofold increase in the flow rate of the eluent and consequently a fourfold increase in inlet pressure, in order to maintain a constant retention time. Moreover, as the term (c) of equation (5.2) shows, the resolution is not proportional to N but increases with the square root of plate number, and thus the corresponding increase in resolution with increasing plate number is not so great.
Up to this point, we have looked only at the separation of two-component mixtures. The optimization of separation becomes more complicated for samples that contain many components of widely different k values.
As described above, resolution can be improved by variations in plate number, selectivity or capacity factor. However, when considering the separation of a mixture which contains several components of different retention rates, the adjustment of the capacity factors has a limited influence on resolution. The retention times for the last eluted peaks can be excessive, and in some cases strongly retained sample components would not be eluted at all.
Improvement of column efficiency in terms of the number of theoretical plates realized by increasing column length often yields marginal increases in resolution, with a corresponding increase of analysis time to unacceptable levels. This
Coupled-Column Liquid Chromatography |
113 |
behaviour, termed the General Elution Problem (4) is common to all forms of liquid chromatographic systems in which a mixture of various components, having a large spread of k values, is eluted under isocratic conditions. A solution for solving this problem is to change the band migration rates during the course of separation by a gradient elution under precisely controlled conditions. A chromatographic separation can be considered complete when the column produces as many peaks as there are components in the analysed sample (5). In order to describe the effectiveness of most separation systems to resolve a multicomponent mixture, Giddings introduced the concept of peak capacity (6), which is defined as the maximum number of peaks,, that can be fitted into the available separation space with a given resolution which satisfies the analytical purpose. Peak capacity can be expressed by the following equation (6):
1 N1 2 r ln (1 k i) |
(5.3) |
where N is the number of theoretical plates, r is the number of standard deviations which equal the peak width (r 4) when the resolution (Rs) 1, and k i is the capacity factor of the last eluted peak in a series.
Theoretically, under gradient elution conditions, HPLC systems yield peak capacities which are calculated to be in the range 100 – 300. These values would be adequate to resolve components in a mixture where the number of analytes is smaller than the peak capacity of the system. However, peak capacity is an ideal number and expresses the maximum number of resolvable analytes which exceeds the real number by some factor determined by operational conditions, such as the allowable separation time (components in a complex mixture are usually not uniformly distributed and appear randomly, overlapping each other). In other words, often the information obtained from the chromatogram is not the true recognition of all individual analytes in complex multicomponents samples, but gives an indication of sample complexity based on the number of observed peaks (7). Davis and Giddings
(8) developed a statistical model of component overlap in multicomponent chromatograms by which it was estimated that one never expects to observe more than 37% of the theoretically possible peaks with uniform spacing. This percentage, corresponding to the number of visible peaks, P, in a chromatogram can be estimated by the following equation:
P m exp ( m ) |
(5.4) |
where m is the number of components in a multicomponent mixture and is the peak capacity.
By assuming that (selectivity of the chromatographic system) can be rewritten as follows:
m |
(5.5) |
114 |
Multidimensional Chromatography |
where this equation shows that can be considered to be a kind of ‘saturation’ factor, expressing the ratio of components m to the hypothetical maximum number of separable compounds , thus expressing the degree to which the separation space is saturated (8), and assuming that m , we can replace the latter in equation (5.4), thus obtaining the follow equation:
P exp( ) exp( ) |
(5.6) |
and consequently we can write the following:
P exp( ) |
(5.7) |
The dimensionless ratio P/ corresponds to the ratio between the number of visible peaks, under the proposed chromatographic conditions, with the chromatographic column having a peak capacity . Differentiation of equation 5.6 with respect to gives the maximum possible value of the ratio P/ and shows this to occur at 1; then, the maximum ratio P/ can be estimated by the following equation:
(P )max exp( 1) 0.3679 |
(5.8) |
which reveals that, as postulated above, the maximum number of visible peaks will be equivalent to 37% of the capacity of the system peaks. Furthermore, the number of single-component peaks which can be expected is given by the following:
S mP1 |
(5.9) |
where m, as above in equation 5.4, is the number of components in a multicomponents mixture and P1 is the probability that an analyte is eluted as a single-compo- nent peak, which can be expressed as follows (8):
P exp( ) exp( ) exp( 2 ) |
(5.10) |
Consequently, the corresponding number of single-component peaks is given by the following:
S m exp( 2 ) |
(5.11) |
As above, we can replace m by and thus equation 5.11 can be rewritten as follows:
S exp( 2 ) |
(5.12) |
which can alternatively be presented as:
S/ exp( 2 ) |
(5.13) |
Coupled-Column Liquid Chromatography |
115 |
Differentiation of equation (5.12), with respect to , as above, shows the maximum to occur at 1/2, and then the maximum S/ ratio can be estimated by the following equation:
(S/ )max 0.5 exp( 1) 0.1839 |
(5.14) |
which leads to the fact that only about 18% of the analytes will emerge as singlecomponent peaks.
The above theoretical analysis of the total number of resolvable components in a complex mixture has shown that in LC, relative to the maximum peak content or peak capacity for closely spaced peaks, a random chromatogram will never contain more than about 37% of its potential peaks and furthermore that only 18% of such components will emerge as single-component peaks having a minimum specified resolution with respect to the neighbouring peaks.
A practical method for enhancing the peak capacity, and thus the resolution of analytes in multicomponent complex mixtures, can be achieved by changing the mode of the separation during the chromatographic analysis, employing a column switching system in order to optimize a separation.
In LC – LC coupling (2D system), the peak capacity is the product of the peak capacities of its component one-dimensional (1D) processes (9). The power of the separation measured by the LC – LC peak capacity is given by the following:
LC – LC LC1 LC2 |
(5.15) |
By assuming that both LC modes have the same peak capacity, equation (5.15) becomes:
LC – LC 2 |
(5.16) |
More generally the peak capacity for a multidimensional system can be expressed by the following:
n |
|
1 2 3 n i |
(5.17) |
and assuming that each LC mode has the same peak capacity, equation 5.17 can conveniently be expressed as follows:
n |
(5.18) |
On the other hand, supposing that we have n identical columns connected in series, the peak capacity is given, in analogy to equation 5.3, by the following expression (10):
|
(nN)1/2 |
|
|
S 1 |
|
ln(1 k n) |
(5.19) |
|
|||
|
r |
|
|
116 |
Multidimensional Chromatography |
which by a combination of equations (5.19) and (5.3), can be approximated by the following:
S n1/2 |
(5.20) |
where it is evident that the benefits implied by equation (5.20) for columns of correlated selectivity are small when compared to the exponential effect described by equation (5.18), regarding two columns of different selectivities.
Thus, if two identical column with a peak capacity of 35 are coupled in series, the resultant peak capacity calculated from equation (5.20) will be 49.5, compared to a value of 1225 if the same columns are used in multidimensional mode. However, the exponential effect of equation (5.18) will be observed only if each column having a distinct selectivity will give elution sequences that are unrelated to those obtained by any of the other chromatographic mechanisms being used. If the columns are related (redundant selectivity), the system selectivity can be expressed by equation (5.20). For instance, in size exclusion chromatography, columns packed with porous particles having different exclusion limits are connected in series, thus allowing separation of sample components over a wide molecular-weight range.
5.3 LC – LC TECHNIQUES
As reported above, the coupling of individual separation techniques increases the total peak capacity of the chromatographic system, which is given by the product of the peak capacities of the individual dimensions (1). The full separation power of an LC – LC system can be better understood by considering a multicomponent mixture comprised of analytes having a wide range of distribution coefficients. In a singledimension system, when employing a column of high selectivity, less retained analytes will be eluted as well-resolved peaks. On the other hand, the more retained peaks may become excessively broad and detection may be difficult. In contrast, by selecting a column with lower selectivity, the retention time and width of the later peaks will become acceptable, but early peaks will be poorly resolved.
In LC – LC mode, two columns are linked together via a switching valve in such a manner that any component flowing through the first column can be directed to the detector, to waste or into the second column in which further resolution can occur before the sample passes into the detector cell. A typical LC – LC arrangement consists of two columns having the same packing material, but of different length, or two columns of similar length, but of different selectivity. In both systems there is a distinct difference in retention in the columns used. The first column is short or of lower selectivity and is employed to separate the most retained analytes of the multicomponent mixture. The less retained analytes which are eluted from the first column are switched to the second column and remain there, while components which are most retained are selectively eluted on the first column. When these
Coupled-Column Liquid Chromatography |
117 |
analytes have been separated, the first eluted peaks on the first column are then separated on the longer or more selective second column. When comparing the chromatogram obtained on eluting by the single-dimension system with the chromatographic profile achieved by LC – LC column switching, it is evident that the elution order of analytes will be reversed. Under the proposed conditions, the chromatographic profile shows first the most retained analytes and than the least retained components. Peaks are usually eluted in a smaller volume of the mobile phase with less dead space between each of them, and as sharper peaks they are easier to detect. Moreover, separation may be carried out isocratically, thus allowing detection with electrochemical (EC) and refractive index (RI) detectors, which are very sensitive to mobile phase changes and are best used under isocratic conditions.
An LC – LC coupling experiment system can be performed by employing a commercially available HPLC apparatus and involving various combinations of HPLC columns, eluents, additives, switching devices and detectors.
LC – LC coupling can be subdivided into both homomodal and heteromodal systems (11).
Homomodal LC – LC. In this type of development, the chromatographic improvement occurs by switching columns of analogous selectivity. Mainly the goal is to optimize an already satisfactory separation, that is, to concentrate a dilute sample (sample enrichment) or to shorten an analysis time.
Heteromodal LC – LC. Essentially, this type of development is achieved by varying the separation mechanism during the separation process; selectivity changes may be made by varying the nature of the stationary phase, which can posses complementary separation characteristics. The high power of heteromodal LC – LC is represented by equation (5.16) and mainly by equatiuon (5.18) for a multidimensional LC system. The term LC – LC, and more generally Multidimensional, is usually restricted to these LC systems, which involve separation modes which are as different as possible (orthogonal), and in which there is a distinct difference in retention mechanisms (2).
Trace enrichment and sample clean-up are probably the most important applications of LC – LC separation methods. The interest in these LC – LC techniques has increased rapidly in recent years, particularly in environmental analysis and clean-up and/or trace analysis in biological matrices which demands accurate determinations of compounds at very low concentration levels present in complex matrices (12 – 24). Both sample clean-up and trace enrichment are frequently employed in the same LC – LC scheme; of course, if the concentration of the analytes of interest are sufficient for detection then only the removal of interfering substances by sample clean-up is necessary for analysis.
Trace enrichment or preconcentration by LC – LC methods are based on the possibility that the analytes will be retained as a narrow zone on the top of the first column when a large volume of sample is pumped trough the column. Good reproducibility can be achieved when the column capacity is not exceeded and the column is not overloaded. Trace enrichment is usually performed when relatively non-polar
118 |
Multidimensional Chromatography |
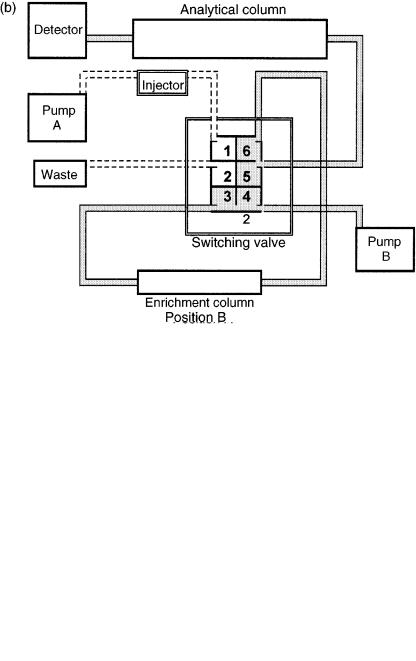
components from aqueous solutions are injected on to a reversed-phase column. A similar outcome is achieved by adsorption chromatographic methods employing suitable solvent polarities. Subsequent elution with a stronger eluent will remove the retained analyte on the first column and will start the separation procedure on the analytical column (secondary column). A schematic drawing of a typical enrichment system assembled by employing a standard chromatograph, an additional LC pump and a six-port valve is presented in Figure 5.1. When the six-port valve is in position A (Figure 5.1 (a)), large volumes of sample can be injected into the enrichment column and flushed by using the mobile phase from pump A. In position B (Figure 5.1 (b)), the enrichment column switches to the reverse direction so that pump B back-flushes the cleaned-up and concentrated analytes on to the analytical column. When the analytes have been transferred on to the analytical column, the valve can be switched back to position A so that the enrichment column can be conditioned and the next sample can be injected into it. To explain the basic operation conditions of an LC – LC approach, we can expound a recently published paper where trace enrichment and sample clean-up were carried out in a single step (25). A schematic representation of such a system detailing each component is shown in Figure 5.2. The LC – LC network was developed by employing a precolumn packed with Bondopack C18 37 – 53 m particles and an analytical column which consisted of a silica-based reversed-phase column (Suplex pKb 100, 5 m, 250 4.6 mm id from Supelco).
In the proposed LC – LC configuration, pump 1 (MP1) was used to deliver the mobile phase 1, which consisted of a 1 : 3 dilution in water of mobile phase 2, employed to flush the precolumn (PC), when the switching valve connects the columns as depicted in Figure 5.2 (a). The Sample (2 ml) is injected and eluted through the precolumn. The mobile phase 1 separates the interfering analytes present in large quantities in the complex matrix (a mouse embryo homogenate). Retinoids, compounds which are structurally related to vitamin A, which are present in embryonic tissue as the trace compounds (26), were retained and concentrated on the precolumn. During the concentration step, the excess injection volume and the eluted analytes were carried to waste. After rotating the switching valve into the transfer position which connects the analytical column (AC), the components retained on the precolumn were back-flushed and separated on the analytical column (Figure 5.2 (b)) by isocratic elution, employing mobile phase 2 (MP2), consisting of acetonitrile methanol 2% ammonium acetate glacial acetic acid (79 : 2 : 16 : 3, vol/vol). Mobile phase 2, which had an higher elution power than the primary mobile phase, was able to remove those retinoids which had been strongly retained on the precolumn. Under the proposed conditions, sample clean-up, enrichment, separation and quantification of picogram amounts of retinoids in embryonic tissue were achieved in a single step. Very recently, an on-line trace enrichment method was developed for the rapid, sensitive and reproducible determination of microcystins from water samples without purification (27). The analysed microcystin-LR (containing the L-amino acid residues leucine and arginine in positions 2 and 4, respectively), microcystin-RR (two L-arginine residues in positions 2 and 4), and microcystin-YR (L-tyrosine and L-methionine residues in positions 2 and 4, respectively), are
Coupled-Column Liquid Chromatography |
119 |
Figure 5.1 Schematic diagrams of a typical enrichment system: (a) forward-flush position;
(b) back-flush position.