

Word 2010
.pdfApplying Shape Styles
1.Click each shape and type in the shape.
2.Hold the Ctrl key down and click on each shape to select them.
Or in the Drawing Tool format tab, click the Selection Pane button in the arrange group. Hold the Ctrl key down and click on each shape.
3.In the Shape Styles group, apply a style to the shapes.
Formatting Shapes
1.Click the Format Shape dialog box launcher in the Shape Styles group.
Or right-click on the shape; and from the menu, select Format Shape.
The Format Shape dialog box opens. You can resize, change line and fill colors, and the layout of a drawing in the Format Shape dialog box.
Typing in the shapes |
Selecting shapes |
Format AutoShape dialog box
Applying a Shape Style
Pictures and Drawing |
91 |
Ordering Pictures and Drawings
Pictures or drawing objects might obscure each other.
1.Click the picture which you want to change its ordering.
2.Click the Send Backward command in the Arrange group.
3.The picture moves one step toward to the back.
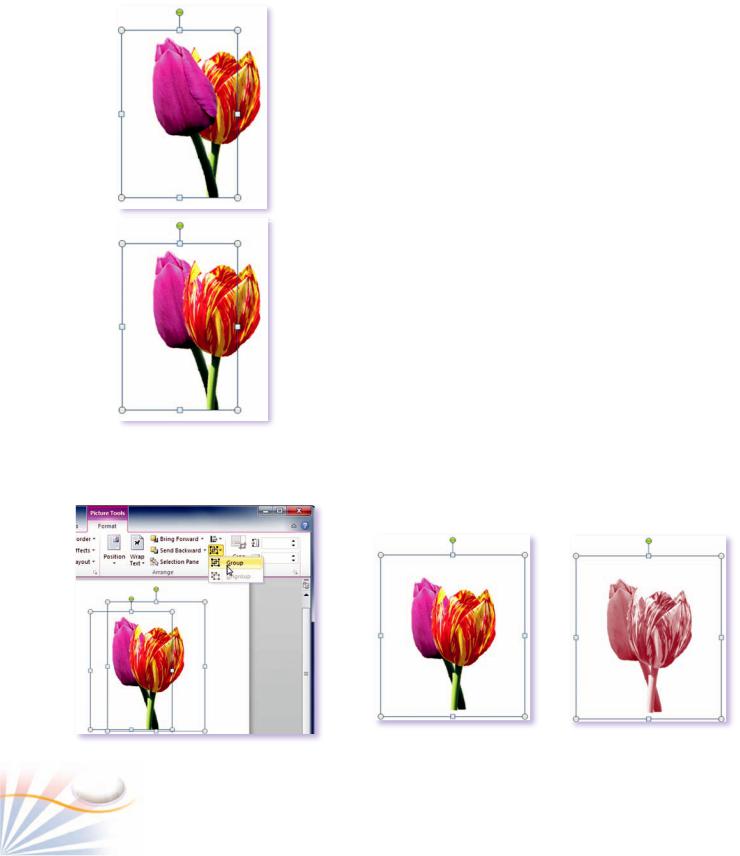
Grouping and Ungrouping Pictures and Drawings
You can group several pictures or shapes so that you can treat them as a single object.
To group and ungroup pictures;
1.Select all the pictures that you want to group.
2.Click the Group button in the Arrange group.
Or right-click on the selection; select Group and then click the Group command.
3.In the Picture Tools Format tab; change the color of the group.
You can ungroup objects so that you can modify each separately. Select the group of pictures or drawings.
1.Click the Group button in the Arrange group, and then select the Ungroup command.
Ordering shapes
|
|
|
|
|
|
|
|
|
|
|
|
Formatting shapes together |
|
Two shapes as a group |
|
Grouping shapes
92 |
Chapter 7 |
Projects
1.Draw the floor plan of your school. It should be a full page in size. Label all of the items that you create. Show the fire exits with large arrows. Print this page and place it on the bulletin board of your class.
2.Create two business cards that represent your ideas. The cards should include the name of the business, your photo, phone number etc…
3.Create an imaginary business flyer. Your flyer should have: The business logo of your company, something to get people's attention, the list of products and their names.
Fill In The Blank
1._________ task pane allows you to seacrh online for various images, sounds, and animations.
2.The ratio of light to dark in a picture is called
_______________ .
3._________ is an object such as a shape, a diagram, a line, that you create using drawing tools within Word.
True or False
1.You can type a text inside a drawing object.

 True
True 
 False
False
2.You cannot insert a ClipArt from the Internet into a document.

 True
True 
 False
False
3.In order to select several drawing objects hold down the CTRL key and click each drawing.

 True
True 
 False
False
Pictures and Drawing |
93 |

Multiple Choice Questions
1.How can you resize the width or height of a picture in a document? (Choose two answers)
a.Use the sizing handles that appear at the edges of the picture.
b.Change values in the height and width boxes in the Size group.
c.Drag the green handle at the top of the picture.
d.Right-click on the picture and choose the Size command.
2.What happens when a picture is inserted in a text document?
a.The Text is wrapped around the image.
b.The image is treated as text and stays in line with the text.
c.The image appears behind the text.
d.The image floats over the text.
3.Select the options which are used to change the layout of a picture. (Choose two answers)
a. Picture Position |
b. Picture Styles |
c. Text Wrapping |
d. Picture Effects |
4.How can you select several drawing objects in a document?
a.Hold down the Ctrl key as you select each drawing.
b.Hold down the left mouse button and drag a rectangle around the drawings.
c.Use Insert, Select all drawings.
d.Press Alt and then click on the drawings.
5.Choose the sentences which define the Brightness and Contrasts commands. (Choose two answers)
a.The ratio of light to dark in a picture is called brightness.
b.Brightness reduces a documents file.
c.Contrast is the difference between light and dark in a picture.
d.Contrast changes a picture to Black and White.
6.What does the Cropping command do?
a.It changes the size of a picture.
b.It is a color adjustment command.
c.It changes the amount of a picture displayed.
d.It positions a picture to a different location.
7.How can you minimize the size of a document with pictures for sharing on the Internet?
a.Resize each picture.
b.Crop the pictures.
c.Use the Compress Pictures command.
d.Recolor pictures to Grayscale.
8.What is a Drawing object?
a.It is an object that you create using the drawing tools within Word.
b.It is a graphic that is created outside of Word.
c.It contains all of your images in one place.
d.It provides a variety of different styles.
9.How can you resize, move, and format more than one drawing object together? (Choose two answers)
a.Select and group the drawing objects.
b.Select and order the objects.
c.Move the objects inside a drawing object.
d.Select and use the Shape Styles gallery.
10.Select the formatting which you can apply on a drawing object. (Choose three answers)
a.3-D effects.
b.Shadow effects.
c.Brightness and Contrast.
d.Shape Styles.
94 |
Chapter 7 |

The Illustrations Group
Selecting a chart style
Inserting a chart
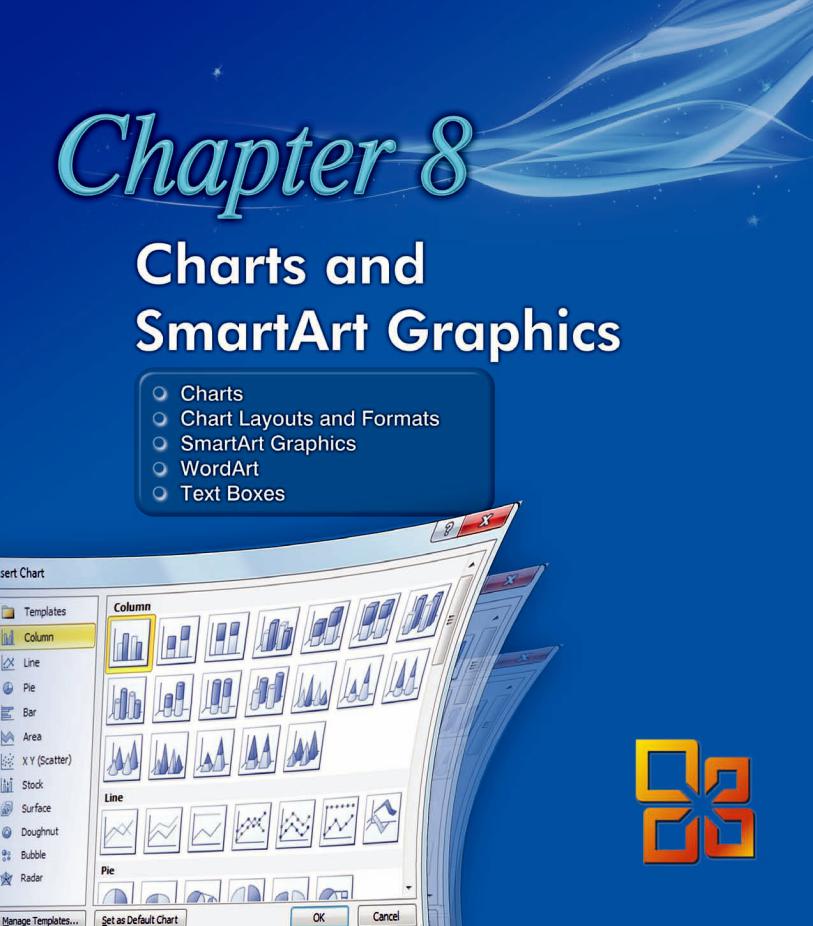
Charts
A chart or a Diagram can make a document more understandable and capture the interest of readers. Word provides a wide variety of chart options from Bar graphs to 3-D graphs.
Creating a Chart
A chart consists of two parts: a graphic chart and a datasheet.
Practice
In the following exercise, you will create a chart that shows personal computer sales in 4 different cities.
1.Place the insertion point where you want to insert the chart.
2.On the Insert tab, click the Chart button in the Illustrations group.
The Insert Chart dialog box displays different types of chart styles.
3.Select a chart style and click OK.
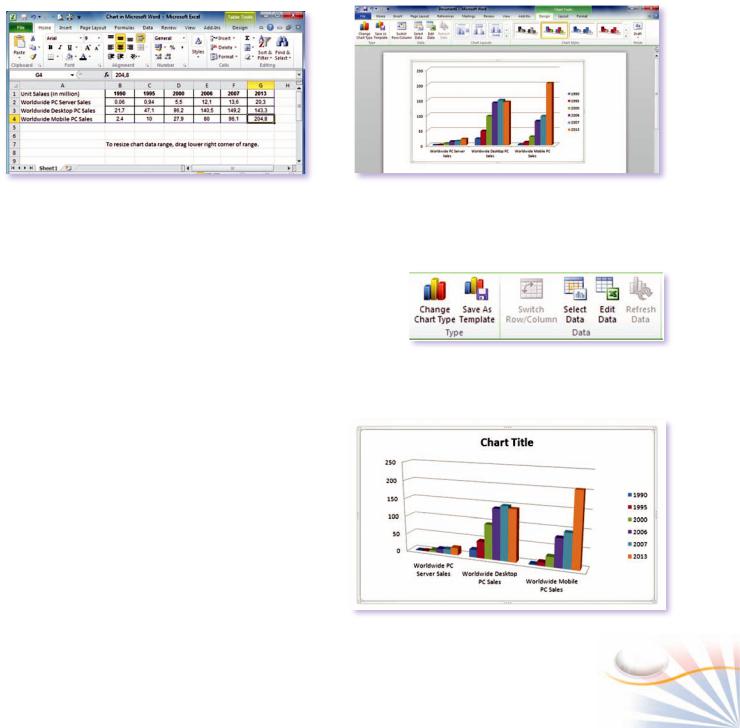
The graphic chart displays in Word; the datasheet is opened in Excel.
The Datasheet is made up of columns and rows and contains the sample data. In the Datasheet, rows represent a label or category; columns contain numerical values for each label. As the data change in the cells; the data in the chart is also updated.
In the datasheet, enter your own data by typing it in.
1.Click in the cells, and type in your data.
96 |
Chapter 8 |
2.Close the Excel program.
The data you enter is stored in an Excel worksheet that is incorporated into the Word file.
Word redraws the chart. The Ribbon displays the Chart Tools Design, Layout, and Format tabs. Use the Chart Tools tabs to edit the chart.
|
|
|
|
|
|
|
|
The data chart |
Typing data into the datasheet |
|
Editing Chart Data
If you want to update the data for a chart, you will need to reopen the datasheet.
1.Click on the chart. Click the Chart Tools Design tab.
2.In the Data group, click the Edit Data button.
The Datasheet opens in Excel on the right side of the screen.
3.Edit and update the chart data. Close Excel to return to the document.
Changing Chart Type
Word offers many different chart types for different presentations. If you want to change the type of chart, you do not need to create it from scratch.
1.Click on the chart. On Chart Tools Design tab and click Change Chart Type button in the Type group.
The Change Chart Type dialog box opens.
2.Select the new chart type and click OK.
The Data and the Type group
Changing chart type
Charts and Smart Art Graphics |
97 |

Formatting chart layout
Formatting chart elements
Formatting chart elements
Chart Layouts and Formats
The Chart Tools Layout tab displays tools for changing the layout of the chart elements, such as the chart title, the legend, and the data labels.
In a chart, all of the chart elements can be formatted. The Chart Tools Format tab enables you to change the formats of the chart elements, you can apply WordArt effect to the legend, or change the fill color of the data series.
Practice
In this exercise, you will format a data series in your chart.
1.Click on the chart and click the Chart Tools Format tab.
To customize a specific element, you first need to select it.
2.Click the arrow next to the Chart Elements box in the Current Selection group.
3.Select the chart element by clicking on it. Or in the chart, click the chart element.
4.Click "2013" data series.
5.In the Style shapes group, click the More button. Select a style on the menu.
6.Click the Chart Layout tab. In the Labels group, click the Legend button.
7.Select None on the menu.
Or select the Legend and press the Delete key on the keyboard.
The Legend is removed from the chart.
98 |
Chapter 8 |
SmartArt Graphics
The SmartArt feature enables you to insert preformatted diagrams. A SmartArt diagram is a special type of graphic with text that represents an item, such as the manufacturing steps of a product or to illustrate the hierarchical relationships.
Practice
Creating a SmartArt Graphic
In the following exercise, you will create a SmartArt for a Volleyball tournament.
1.Place the insertion point where you want to insert the SmartArt.
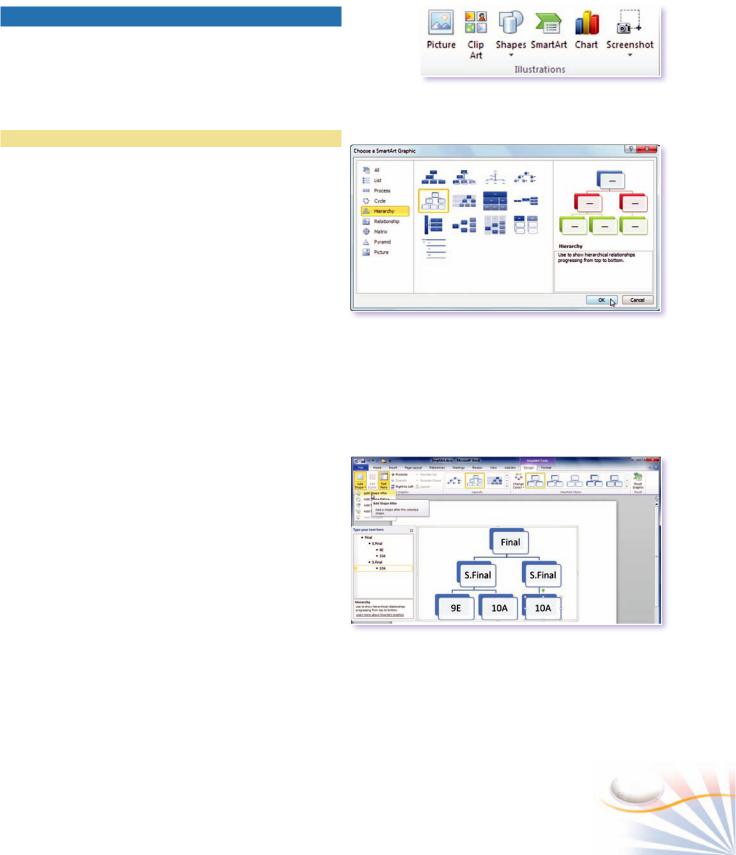
2.In the Insert tab, click the SmartArt button in the Illustrations group.
The Choose a SmartArt Graphic dialog box opens.
The left side of the dialog box displays the categories. The List pane displays the diagrams in a category. A preview of the currently selected SmartArt appears on the right side of the gallery.
1.Click the Hierarchy option.
2.Select the Labeled Hierarchy and click OK.
The Ribbon displays the SmartArt Tools Design tab and the Format tab. The Design tab enables you to edit the style of the diagram and the Format tab enables you to format with the specific components of the diagram.
To enter text for the SmartArt diagram;
1.Click in the Text Pane and start typing. Or type it directly in the diagram.
As you type in the Text Pane, text is displayed in the corresponding SmartArt component.
2.Click outside the diagram to return to your document.
The Illustrations group
The Choose a SmartArt Graphic dialog box
Entering text in a SmartArt
Charts and Smart Art Graphics |
99 |
SmartArt
Changing SmartArt style
Changing SmartArt style
Add and Delete SmartArt Shapes
You can add and delete shapes and edit its text by making changes in the text pane.
To insert new shapes into the diagram;
1.Click the shape that you want to add a new shape after, or below.
2.In the SmartArt Tools Design tab, click the Add Shape button in the Create Graphic button.
3.Select the Add Shape After command. The Shape is inserted into the diagram.
4.Type in the text in the shape.
To delete a shape; simply click on it and press the Delete key.
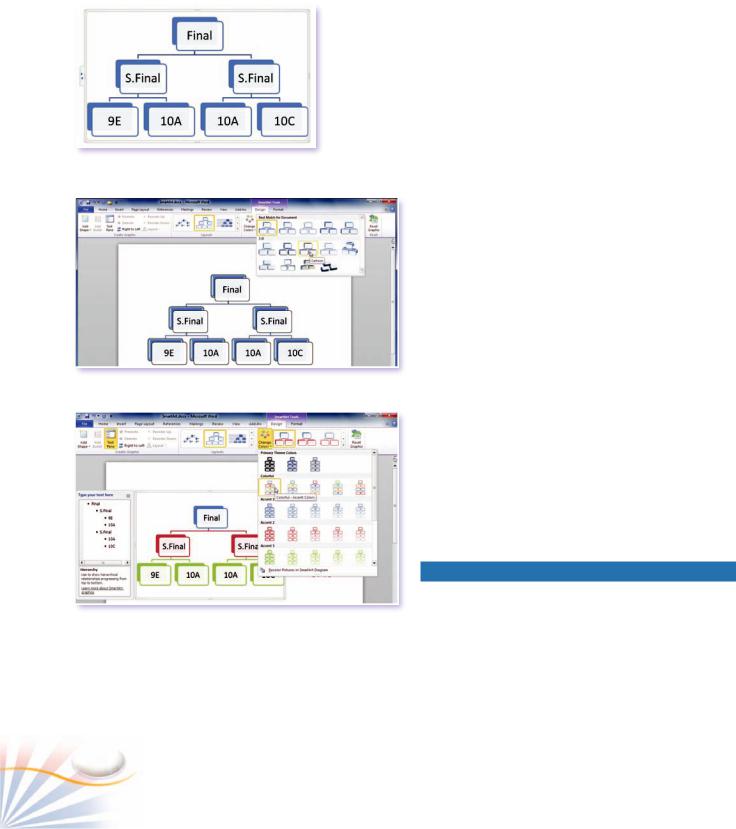
Formatting a Diagram
You can format components of the diagram such as change colors, add shading, and 3-D effects.
In the following exercise, you will change the diagram style and colors.
1.Click the diagram to select it.
2.Click the More button in the SmartArt Styles group.
3.Select a 3-D effect in the gallery.
4.Click the Change colors button in the SmartArt Style group.
5.Select a theme color in the gallery and save the document.
WordArt
WordArt enables you to create special text effects. WordArt is actually a graphic text, so you can bend, add shadows, stretch, or rotate it.
100 |
Chapter 8 |