

124 4 Surface processes in adsorption
Figure 4.9. Calculated energies as a function of rotation angle for the rare gases on graphite, after Novaco & McTague (1977), reproduced with permission. Note the small energies (0.5±2.5 K/atom) involved, which are nevertheless suYcient to stabilize the rotated phases.
center of the hexagon and on top of a carbon atom, which is some factor times (Ea 2E0), introduced in section 4.2. By following through the algebra in problem 4.2, one can evaluate this factor, and thereby show that (Ea 2E0)536 K is a reasonable value for the calculation presented in ®gure 4.1b. We can note in passing that the factor relating DV to (Ea 2E0) does depend on the assumption that only one Fourier coeYcient Vg is important in (4.14). The error involved in this assumption can be explored further via problem 4.2.
4.4.3Melting in two dimensions
There has also been much interest in the melting transition. The major question is whether melting proceeds in two stages, via a hexatic phase, in which long range positional order is lost, but some `bond orientational order' is preserved. Interest in this topic is primarily due to the importance of liquid crystals, where the hexatic phase in free-standing ®lms is well documented (Brock et al. 1989, Strandburg 1992).
Additional interest arises from regarding physisorbed monolayers as model 2D systems, in which properties speci®c to two dimensions can be demonstrated. Melting has been thought to be such a case, following an in¯uential series of papers describing the statistical mechanics of topological defects in ML systems. These papers
4.4 Physisorption |
125 |
|
|
(Kosterlitz & Thouless 1973, Halperin & Nelson 1978, Nelson & Halperin 1979, and Young 1979), which together became known as KTHNY, formed a springboard for subsequent work. The central idea was that dislocations that thread the ML are point defects, which are present in thermal equilibrium. At low temperature, such defects exist only in bound pairs, but they can unbind above a certain critical temperature.
In the context of the six-nearest neighbor hexagonal crystal structure of rare gas layers, isolated point dislocations destroy translational order exponentially, but orientational order decays more slowly as a power law. A high density of isolated, or free, dislocations was identi®ed with the hexatic phase. However, the cores of dislocations themselves can unbind to produce disclinations, where the local orientational order is alternately ®veand seven-fold; if we have many of these, we have a true 2D liquid. The questions arising were then whether the hexatic phase in general existed, and if so, what was the order of the phase transitions. The role of computer simulation in this argument was interesting. These studies essentially always gave ®rst order transitions, but theorists could always invoke `®nite size eVects' to claim that the sample size in the simulation was not large enough.
Experimental melting studies on Xe/graphite include thermodynamic studies (Gangwar et al. 1989, Jin et al. 1989) and many sets of diVraction data. Our own THEED studies of melting (Zerrouk et al. 1994) do indeed observe the hexatic phase in a narrow temperature region. But it seems that the thermodynamic experiments are most sensitive to the expansion involved in the hexatic±liquid transition, whereas diVraction is most sensitive to orientation changes across the solid±hexatic transition. Models are complicated by the fact the solid ML Xe melts from the aligned (IA) phase. This means that the orientational order provided by the substrate, via the term Vg in (4.14), must be a signi®cant term in the free energy balance. Detailed discussions of such systems have also emphasized the importance of the organization of dislocations into grain boundaries (Venables & Schabes-Retchkiman 1978, Chui 1983), and the role of anharmonicity (Joós & Duesbery 1985, Bruch et al. 1997). Both of these eVects tend to cut oV the second order transitions predicted by KTHNY, producing weakly ®rst order transitions. These arguments tend to back the claims of computer simulations (Abraham 1982), who claimed that disclination unbinding represents the highest T at which the 2D solid can be metastable, rather than the thermodynamic melting temperature; this type of argument can get quite heated!
One can appreciate that the details of all these phases and their transitions involve competing interactions, often quite subtle. Physisorbed layers are thus test-beds for exploring interatomic forces and dynamics at surfaces, and the rich variety of experimental observations produce constraints on feasible models; however, the search for truly 2D model systems with which to test the elegant theories is, from an experimental viewpoint, somewhat elusive.
4.4.4Construction and understanding of phase diagrams
The combination of all the information from diVerent types of experiment into a phase diagram is still very much a research project, but one which proceeds in ®ts and starts, depending on individual enthusiasm, patience and the availability of funds and

126 4 Surface processes in adsorption
(a) |
1 |
|
|
|
|
|
|
|
|
|
|
3D sublimation |
|
||
|
0 |
|
|
|
|
|
|
|
-1 |
|
|
|
|
Bilayer |
|
|
|
|
|
|
sublimation |
||
|
|
C-phase |
|
|
|||
|
|
|
|
|
|
||
|
-2 |
Triple |
|
|
|
|
|
|
|
|
|
|
|
||
(p/Torr) |
-3 |
point |
|
|
|
|
|
|
|
|
|
|
|
||
|
|
|
1.0 |
|
|
|
|
Log |
|
|
Kr ML |
|
|
|
|
-4 |
|
|
|
|
|
||
|
|
|
sublimation |
|
|
|
|
|
-5 |
|
|
|
|
1.10 |
|
|
|
Cell model |
|
|
1.12 |
||
|
|
|
|
|
|||
|
|
|
calculation |
|
|
|
|
|
-6 |
|
|
|
|
|
|
|
|
Kr/graphite: |
|
|
|
|
|
|
-7 |
monolayer cell model |
|
|
|
||
|
isosteres n = 1.0 to 1.12, |
|
|
||||
|
|
|
|
||||
|
|
n = 0.02 ML |
|
|
|
|
|
|
-8 |
|
|
|
|
|
|
|
|
10 |
12 |
14 |
16 |
18 |
20 |
|
|
|
|
1000/T (K-1) |
|
|
|
(b) |
1 |
|
|
|
|
|
|
|
0 |
|
|
Xe/graphite: |
|
|
|
|
|
|
monolayer cell model |
|
|||
|
|
|
|
|
|||
|
|
|
|
isosteres n = 0.89, 0.9 to 1.0, |
|||
|
-1 |
|
|
n = 0.02 ML |
|
|
|
|
|
|
|
|
|
|
|
|
-2 |
|
|
|
3D sublimation |
|
|
|
|
|
|
|
|
||
(p/Torr) |
-3 |
|
|
|
Bilayer |
|
|
|
|
|
|
sublimation |
|
||
|
|
|
|
|
|
|
|
Log |
-4 |
|
|
|
|
|
|
|
|
|
|
1.0 |
|
|
|
|
|
Triple |
|
|
Cell model |
||
|
|
|
|
|
|||
|
-5 |
point |
|
|
|
calculation |
|
|
|
|
0.90 |
|
|
|
|
|
-6 |
|
0.89 |
|
|
C-phase |
|
|
|
|
|
|
|
||
|
-7 |
Xe ML |
|
|
|
|
|
|
sublimation |
|
|
|
|
||
|
|
|
|
|
|
||
|
-8 |
|
|
|
|
|
|
|
|
10 |
12 |
14 |
16 |
18 |
20 |
|
|
|
|
1000/T (K-1) |
|
|
|
Figure 4.10. Outline phase diagrams of (a) Kr/graphite and (b) Xe/graphite in a multiparameter potential model using Einstein vibrations for the vertical motion and the cell model for lateral motion. The isosteres plotted have a coverage parameter n, where n51 corresponds to the C-phase (one atom to every third graphite hexagon). Experimental points from the literature (after Schabes-Retchkiman & Venables, 1981, reproduced with permission).
time. For example, the current Ne/graphite (log(p), 1/T) phase diagram dates from Calisti et al. (1982). Phase diagrams (T, u) for Ar, Kr, and Xe/graphite are shown by Zangwill (1988, chapter 11), and many examples of both types of diagram are given in Bruch et al. (1997, chapter 6). Note how it is impossible to portray all the information on these 2D cuts of the 3D (T, log p, u) data. With rotation, as shown for Ne/graphite in ®gure 4.8(c), we have really four-dimensional information, and this has only been mapped in the barest outline. Quantum cell models of Ne/graphite have been developed by Bruch and by others in order to understand these results, as referenced in Bruch et al. (1997).
For the heavier gases, the cell model works remarkably well, and this simple model has been carried through for Kr and Xe/graphite (Schabes-Retchkiman & Venables, 1981) as shown in ®gure 4.10; parts of this diagram have been elaborated in later papers. These diagrams show the expansion of the layers with increasing T at constant p, and the compression of the layers with increasing p at constant T. The lines are isosteres, lines of constant coverage, or density as determined by the lattice spacing, where n51 corresponds to the C-phase. As can be seen they are slightly steeper than the phase transition lines. These diagrams are, however, by no means complete; there are now a
4.4 Physisorption |
127 |
|
|
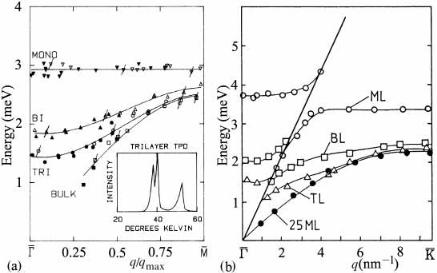
Fig. 4.11. Vibrational energies of phonons as determined by helium atom scattering for: (a) Kr/Ag(111), with insert showing the thermal desorption spectrum of the trilayer, and (b) Xe/Pt(111), after Gibson & Sibener (1985) and Kern & Comsa (1988), both reproduced with permission. See text for discussion.
lot more data in the literature, which are awaiting the time and energy to analyze and present them as a coherent story.
A particularly satisfying set of helium atom scattering (HAS) experiments has been performed on rare gases adsorbed on close packed metal surfaces, Kr/Ag(111) (Gibson & Sibener, 1985) and Xe/Pt(111) (Kern et al. 1986, Kern & Comsa 1988, 1989). By analyzing the detected beam to determine both energy and momentum, HAS can determine surface phonon energies in a similar manner that neutron scattering yields phonon energies in bulk crystals. These results, for both Kr/Ag(111) monoand multilayers shown in ®gure 4.11(a), indicate that the Einstein model is a good model for vertical vibrations within the ®rst ML, with a constant energy E5 hn52.9 6 0.1 meV, or n50.70 6 0.03 THz. The corresponding value for Xe/Pt(111) at the zone center, G, is 0.92 6 0.04 THz, and more interestingly around 0.80 THz at the zone boundary, K, where the eVect of the substrate Rayleigh wave is less; both the Kr and Xe values are similar to the bulk values given previously in Table 1.1. The insert in ®gure 4.11a shows the thermal desorption spectrum (TDS) of trilayer Kr/Ag(111); this relatively simple technique is very powerful, here distinguishing the sublimation energy of all three layers.
Progressively, as the layer thickness is increased, the vibrational energy spectrum goes over to that of the bulk crystal. In physisorption, adsorbate modes are typically lower in energy than substrate modes, except near G. However, in the case of Xe/Pt(111) the coupling between the substrate modes and the adlayer modes is seen for both monolayer and bilayer modes in ®gure 4.11(b). This coupling is stronger when the masses (and binding energies) of the adsorbate and substrate atoms are similar. We