

- •Welcome to Seagate Crystal Reports
- •Welcome
- •Two kinds of Hands-On tutorials
- •Command, button, key, and control conventions
- •Using Seagate Crystal Reports documentation
- •Seagate Crystal Reports online Help features
- •If you need more help...
- •Installation Requirements
- •Installing Seagate Crystal Reports
- •Installing on a network workstation
- •Upgrading from a previous version
- •Quick Start
- •Subreports expand report usefulness
- •Query Designer adds ad-hoc querying capabilities
- •Parameter fields mean multi-purpose reports
- •Text objects give you text with intelligence
- •Preprinted-form reports easier than ever
- •More powerful formulas extend your capabilities
- •Web solution serves up variety of online reports
- •HTML exporting simplifies Web activities
- •New database support improves data access
- •Running totals made easy
- •Smart Navigation
- •Learning Seagate Crystal Reports
- •User’s Guide
- •Online Help
- •Books Online
- •Sample Reports
- •Glossary
- •Sample Data - CRAZE.MDB
- •Suggested learning paths
- •The application window
- •Menu bar
- •Standard toolbar
- •Supplementary toolbar
- •Format bar
- •Status bar
- •Shortcut menus
- •Cursors
- •Design Tab
- •Preview Tab
- •Other fundamentals
- •HANDS-ON (Report Design Environment)
- •How to add, delete, and move guidelines
- •How to move and position objects using guidelines
- •How to turn the grid on/off
- •How to zoom your report in and out
- •How to undo/redo activities
- •How to drill down on summarized data
- •HANDS-ON (Sections and Areas)
- •How to add, delete, move, and merge sections
- •How to split and resize sections
- •Basic report design
- •How to design a prototype
- •Concepts in reporting
- •Beyond basic reports
- •HANDS-ON (Report Creation and Design)
- •How to select data and begin creating a report
- •How to add and link multiple tables
- •How to insert database fields
- •How to insert special fields
- •How to insert a page n of N field
- •How to insert text objects
- •How to use a database field in a text object
- •How to insert a picture
- •How to select, move, and resize objects
- •How to hide parts of the report
- •HANDS-ON (Finishing Your Report)
- •How to insert page headers and footers
- •How to add a title page to your report
- •How to add summary information to your report
- •Printing considerations
- •Design solutions for printing/distributing
- •Report creation checklist for distributed reports
- •Updating printer drivers
- •Report distribution
- •HANDS-ON (Distributing Your Report)
- •How to export reports
- •How to fax a report
- •How to request reports from a web browser
- •How to specify parameter field values
- •How to log on to a database
- •How to view plain HTML reports
- •Overview
- •Getting started
- •Record Selection
- •Grouping and sorting
- •Completing the report
- •Introduction
- •Working with Arbor Essbase data
- •HANDS-ON (Reporting on OLAP data)
- •How to create a cross-tab with Essbase data
- •Using multiple sections in reports
- •HANDS-ON (Multiple Section Reports)
- •How to work with text objects
- •How to create a form letter using a text object
- •How to format objects conditionally
- •How to print conditional messages in form letters
- •How to alternate background colors for rows
- •How to eliminate blank lines
- •How to add blank lines conditionally
- •Formatting concepts
- •Absolute formatting
- •Types of formatting properties
- •Conditional formatting
- •HANDS-ON (Absolute Formatting)
- •How to add color, shading, and borders
- •How to add/edit lines and boxes
- •How to change margins
- •How to add/delete white space between rows
- •How to set page orientation and paper size
- •HANDS-ON (Conditional Formatting)
- •How to flag values that meet certain conditions
- •Record selection
- •Group selection
- •Record selection formula templates
- •HANDS-ON (Record and Group Selection)
- •How to create a record or group selection formula
- •How to use record/group selection templates
- •How to select the top or bottom N groups
- •Sorting, Grouping, and Totalling Overview
- •Creating custom groups
- •HANDS-ON (Sorting, Grouping, and Totalling)
- •How to do a single field sort
- •How to do a multiple field sort
- •How to group data
- •How to sort records within groups
- •How to summarize grouped data
- •How to subtotal grouped data
- •How to sort based on summarized group values
- •How to create multiple levels of subtotals
- •How to group data in intervals
- •How to calculate a percentage of the grand total
- •How to create group headers
- •What are formulas?
- •Other formula conventions
- •Formula syntax
- •How formulas are evaluated - Order of precedence
- •HANDS-ON (Formulas 101)
- •How to insert a formula in your report
- •How to delete formulas from your report
- •How to copy formulas from online Help
- •How to copy formulas from one report to another
- •How to create if-then-else formulas
- •How to format text with formulas
- •How to use variables in formulas
- •How to declare a variable
- •How to assign a value to a variable
- •How to conditionally assign values to variables
- •How to use an array in a formula
- •How to use a range in a formula
- •How to use semicolons in formulas
- •How to fine tune group selection formulas
- •How to fine tune record selection formulas
- •How to debug a formula
- •Introduction
- •HANDS-ON (Advanced Totalling)
- •How to maintain running totals in a list
- •How to subtotal running totals within groups
- •How to subtotal without grouping
- •How to subtotal true A to B, A to C reports
- •Parameter field objects overview
- •Multiple parameter fields
- •Parameter field considerations
- •HANDS-ON (Parameter Field Objects)
- •How to create a parameter field
- •How to use a parameter field in a formula
- •How to respond to parameter field prompts
- •How to use wildcards with parameter fields
- •How to set a report title using parameter fields
- •How to set sort order using parameter fields
- •Graphing Overview
- •Choosing a graph or chart type
- •Where to place your graph
- •Data you can graph on
- •Before you create your graph
- •HANDS-ON (Graphing)
- •How to graph on a summary or subtotal field
- •How to graph on a details field
- •How to graph on a formula field
- •How to graph on cross-tab summaries
- •How to edit graphs using PGEditor
- •How to use the underlay feature with graphs
- •OLE Objects Overview
- •Inserting OLE objects in your reports
- •Linked vs. Embedded Objects
- •The dynamic OLE menu commands
- •OLE and the Picture command
- •General OLE considerations
- •HANDS-ON (OLE Objects)
- •How OLE objects are represented in your report
- •How to use OLE - General Overview Tutorial
- •How to insert a graphic/picture as an OLE object
- •What are subreports?
- •Unlinked vs. linked subreports
- •How subreport linking works
- •HANDS-ON (Subreports)
- •How to insert a subreport
- •How to preview your subreport
- •How to combine unrelated reports using subreports
- •How to use subreports with unlinkable data
- •Cross-tab overview
- •Cross-tab components
- •HANDS-ON (Cross-Tab Objects)
- •How to create a cross-tab object
- •How to format a cross-tab
- •How to print cross-tabs that span multiple pages
- •The Crystal Query Designer
- •HANDS-ON (Queries)
- •How to create a new query
- •How to add tables to a query
- •How to link tables and specify a join type
- •How to add fields to a query
- •How to identify unique values in a query
- •How to summarize data with aggregate functions
- •How to sort records according to field values
- •How to specify records to be included in a query
- •How to select groups to be included in a query
- •How to create an SQL expression
- •How to create a query from another Crystal Query
- •How to select a query for a report
- •How to use a parameter field in a query
- •Dictionaries Overview
- •HANDS-ON (Dictionaries)
- •How to create a new dictionary
- •How to add a data file
- •How to open an SQL or ODBC data source
- •How to link multiple tables
- •How to select tables and fields for users
- •How to add/create formulas
- •How to move fields/field headings within the list
- •How to update the location of a database table
- •How to add a new field heading
- •How to add Help text
- •How to add a graphic
- •How to create sample data for users to browse
- •How to edit an existing dictionary
- •How to convert a 3.x or 4.x dictionary file
- •How to select a dictionary for a report
- •Databases Overview
- •For additional information
- •HANDS-ON (Working With Databases)
- •How to open Access queries through DAO
- •How to open Access queries through ODBC
- •How to open Access parameter queries
- •How to set up an ODBC data source
- •How to check settings for an ODBC data source
- •How to log on to an ODBC data source
- •How to add an ODBC database table to a report
- •How to log on to MS SQL Server via ODBC
- •How to log off an ODBC data source
- •How to set up an A to B, A to C link
- •How to edit an SQL query
- •How to use an ACT! database
- •How to open the NT Event Log
- •Introduction
- •Four types of data
- •Direct access database files
- •ODBC data sources
- •Crystal Query Designer files
- •Crystal Dictionary files
- •Multi-pass reporting
- •Product support
- •Web support
- •E-mail support
- •Fax support
- •Telephone support
- •Extended technical support policy
- •Product registration
- •Product return policy
- •Product replacement policy
- •Glossary

Multi-pass reporting
What is a “pass”?
Pre-pass #1
Pass #1
A pass is a process that Seagate Crystal Reports uses each time the data is “read” and manipulated. Therefore, if a report reads and manipulates the data twice, it is considered to be a two-pass report. This feature is one that is very powerful in the data access and reporting industry because it allows for complex reporting and formula manipulation. Therefore, percent of subtotal calculations are possible due to the two-pass reporting capabilities of Seagate Crystal Reports. Some reports can be onepass, yet in most cases two-passes will be issued. The following section offers a brief overview of the two-pass reporting concept. Following the written description is a visual representation of this process.
When previewing a report, the first elements to be evaluated are “flat” formulas. Flat formulas are those that do not contain database fields. For example, 100* 30 would be a flat formula. Flat formulas are evaluated at the beginning of the print preview process and are never evaluated again. This process is known as “BeforeReadingRecords”. If you were to place a flat formula field (i.e., 100*30) in the Details section, the result would be 3000 for each record displayed.
Once the “BeforeReadingRecords” process has taken place, Seagate Crystal Reports will begin reading the database records. During the record reading process the following will occur:
1.Record Retrieval.
2.Evaluate “recurring” formulas. These formulas are those that contain database fields but do not contain references to subtotals or summary information that would require data manipulation in the second pass. This evaluation time is known as “WhileReadingRecords”.
3.Apply the record selection criteria. If the selection criteria is based on a database field that is indexed (i.e., {company.LASTNAME} = “SMITH”), then Seagate Crystal Reports rejects records not equal to SMITH immediately after evaluating the recurring formulas. The reason for this is that
630 |
Seagate Crystal Reports User’s Guide |
Top/bottom N
and group sorting
Pass #2
the selection criteria may include recurring formulas. (i.e., {table.FIELD} = {@Formula}).
4.Totalling. A typical report usually contains groups, sorts, and subtotals and Seagate Crystal Reports tries to process as many of these in the first pass as possible. As the records are processed they are divided into groups based on the group field specified in the report. Each of these groups is sent to an internal “totaler”. This counting mechanism stores a subtotal of each group, in memory, which is then used later in the report process.
5.Store the saved records. After the totalling process is complete, all of the records and totals are stored into a “saved records” object. This object stores data in memory and on disk in the form of temporary files. Saved records are used during the report's second pass for two-pass calculations, group sorting, etc. Therefore, the second pass of the report does not actually read the database again, instead it uses the saved records object.
Steps 1 to 5 are an iterative process that will repeat for each record being read.
Top/Bottom N is a process that allows a user to select either the Top or Bottom N groups. N is the number you specify. Before you can use the Top N feature, your data must be subtotaled or summarized. The group sorting allows you to specify the order in which your “groups” are printed. This sort order is based on the subtotaled or summarized field, not the grouping field.
This process, an intermediate step between passes, actually occurs in between the first and second pass of the report process and does not actually require the records to be read. Instead it only looks at the grouping information stored in the saved records object and orders the groups as specified.
After completing the TopN/Group sort process, Seagate Crystal Reports enters into a second pass of the data. This means that the program will look at the saved records object for the current information and continue with the following elements of Pass #2.
Report Processing Model |
631 |
1.Read records that are contained in the saved records object. These records are read one at a time along with their respective subtotals.
2.Once the subtotal or summary information is available, the group selection formula can be applied. The group selection formula allows the user to select groups based on the subtotaled or summary field, not the grouping field. For example, you may only want the groups that have a subtotal greater than X.
HINT: The Group Selection Formula Editor can be used for record selection formulas, however it is not recommended. If, for example, you chose to use a typical selection such as:
{company.LASTNAME} = “SMITH”
in the Group Selection Formula Editor, the records that are displayed on your report may be correct, however, the subtotals, summaries and grand totals will most likely be incorrect. All of the subtotal/grand total information is calculated in Pass #1 and therefore, if you decide to filter out records in Pass #2 the subtotals will not be modified accordingly.
3.Evaluation of print time formulas. This process is known as “WhilePrintingRecords”. This would include formulas that have been explicitly defined as “WhilePrintingRecords” in the formula itself as well as formulas that refer to subtotals or summary fields. Examples of print-time formulas are:
●% of subtotals
●running totals or running averages
●formulas explicitly marked “WhilePrintingRecords”
4.MetaPage Generation. These pages are generated to display your report to screen. MetaPages are similar to a standard Windows Meta File. Essentially each page is a “recording” of the individual report pages. Therefore, all of the lines, boxes, fields, etc., are stored in the MetaPages. This method of storing report pages is much more efficient than storing the pages as bitmaps. For example, the following diagram is a flow-chart of the multi-pass report process:
632 |
Seagate Crystal Reports User’s Guide |
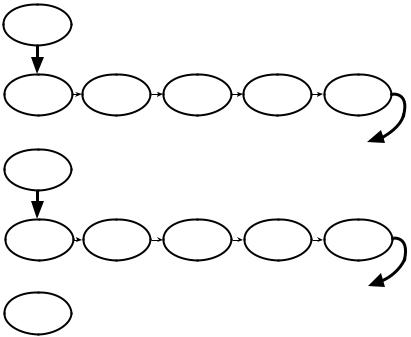
BeforeReadingRecords
pre-pass |
Flat Formulas |
|
|
|
|
|
|
|
|
WhileReadingRecords |
|
||
pass #1 |
Database Records |
Recurring |
Record Selection |
Totaling |
Saved Records |
|
Formulas |
||||||
|
|
Formula |
|
|
||
pre-pass |
Group |
|
|
|
|
Sorting/TopN |
|
|
|
|
|
|
|
|
WhilePrintingRecords |
|
|
pass #2 |
Saved Records |
Totals |
Group Selection |
Print-Time |
MetaPages |
|
|
|
Formula |
Formulas |
|
Final Pass
Total Page
Count
Report Processing Model |
633 |
634 |
Seagate Crystal Reports User’s Guide |

B
Product Support
What you will find in this chapter...
Product support, Page 636
Web support, Page 636
E-mail support, Page 636
Fax support, Page 637
Telephone support, Page 638
Extended technical support policy, Page 639 Product registration, Page 639
Product return policy, Page 641 Product replacement policy, Page 641
Product Support |
635 |