

- •Welcome to Seagate Crystal Reports
- •Welcome
- •Two kinds of Hands-On tutorials
- •Command, button, key, and control conventions
- •Using Seagate Crystal Reports documentation
- •Seagate Crystal Reports online Help features
- •If you need more help...
- •Installation Requirements
- •Installing Seagate Crystal Reports
- •Installing on a network workstation
- •Upgrading from a previous version
- •Quick Start
- •Subreports expand report usefulness
- •Query Designer adds ad-hoc querying capabilities
- •Parameter fields mean multi-purpose reports
- •Text objects give you text with intelligence
- •Preprinted-form reports easier than ever
- •More powerful formulas extend your capabilities
- •Web solution serves up variety of online reports
- •HTML exporting simplifies Web activities
- •New database support improves data access
- •Running totals made easy
- •Smart Navigation
- •Learning Seagate Crystal Reports
- •User’s Guide
- •Online Help
- •Books Online
- •Sample Reports
- •Glossary
- •Sample Data - CRAZE.MDB
- •Suggested learning paths
- •The application window
- •Menu bar
- •Standard toolbar
- •Supplementary toolbar
- •Format bar
- •Status bar
- •Shortcut menus
- •Cursors
- •Design Tab
- •Preview Tab
- •Other fundamentals
- •HANDS-ON (Report Design Environment)
- •How to add, delete, and move guidelines
- •How to move and position objects using guidelines
- •How to turn the grid on/off
- •How to zoom your report in and out
- •How to undo/redo activities
- •How to drill down on summarized data
- •HANDS-ON (Sections and Areas)
- •How to add, delete, move, and merge sections
- •How to split and resize sections
- •Basic report design
- •How to design a prototype
- •Concepts in reporting
- •Beyond basic reports
- •HANDS-ON (Report Creation and Design)
- •How to select data and begin creating a report
- •How to add and link multiple tables
- •How to insert database fields
- •How to insert special fields
- •How to insert a page n of N field
- •How to insert text objects
- •How to use a database field in a text object
- •How to insert a picture
- •How to select, move, and resize objects
- •How to hide parts of the report
- •HANDS-ON (Finishing Your Report)
- •How to insert page headers and footers
- •How to add a title page to your report
- •How to add summary information to your report
- •Printing considerations
- •Design solutions for printing/distributing
- •Report creation checklist for distributed reports
- •Updating printer drivers
- •Report distribution
- •HANDS-ON (Distributing Your Report)
- •How to export reports
- •How to fax a report
- •How to request reports from a web browser
- •How to specify parameter field values
- •How to log on to a database
- •How to view plain HTML reports
- •Overview
- •Getting started
- •Record Selection
- •Grouping and sorting
- •Completing the report
- •Introduction
- •Working with Arbor Essbase data
- •HANDS-ON (Reporting on OLAP data)
- •How to create a cross-tab with Essbase data
- •Using multiple sections in reports
- •HANDS-ON (Multiple Section Reports)
- •How to work with text objects
- •How to create a form letter using a text object
- •How to format objects conditionally
- •How to print conditional messages in form letters
- •How to alternate background colors for rows
- •How to eliminate blank lines
- •How to add blank lines conditionally
- •Formatting concepts
- •Absolute formatting
- •Types of formatting properties
- •Conditional formatting
- •HANDS-ON (Absolute Formatting)
- •How to add color, shading, and borders
- •How to add/edit lines and boxes
- •How to change margins
- •How to add/delete white space between rows
- •How to set page orientation and paper size
- •HANDS-ON (Conditional Formatting)
- •How to flag values that meet certain conditions
- •Record selection
- •Group selection
- •Record selection formula templates
- •HANDS-ON (Record and Group Selection)
- •How to create a record or group selection formula
- •How to use record/group selection templates
- •How to select the top or bottom N groups
- •Sorting, Grouping, and Totalling Overview
- •Creating custom groups
- •HANDS-ON (Sorting, Grouping, and Totalling)
- •How to do a single field sort
- •How to do a multiple field sort
- •How to group data
- •How to sort records within groups
- •How to summarize grouped data
- •How to subtotal grouped data
- •How to sort based on summarized group values
- •How to create multiple levels of subtotals
- •How to group data in intervals
- •How to calculate a percentage of the grand total
- •How to create group headers
- •What are formulas?
- •Other formula conventions
- •Formula syntax
- •How formulas are evaluated - Order of precedence
- •HANDS-ON (Formulas 101)
- •How to insert a formula in your report
- •How to delete formulas from your report
- •How to copy formulas from online Help
- •How to copy formulas from one report to another
- •How to create if-then-else formulas
- •How to format text with formulas
- •How to use variables in formulas
- •How to declare a variable
- •How to assign a value to a variable
- •How to conditionally assign values to variables
- •How to use an array in a formula
- •How to use a range in a formula
- •How to use semicolons in formulas
- •How to fine tune group selection formulas
- •How to fine tune record selection formulas
- •How to debug a formula
- •Introduction
- •HANDS-ON (Advanced Totalling)
- •How to maintain running totals in a list
- •How to subtotal running totals within groups
- •How to subtotal without grouping
- •How to subtotal true A to B, A to C reports
- •Parameter field objects overview
- •Multiple parameter fields
- •Parameter field considerations
- •HANDS-ON (Parameter Field Objects)
- •How to create a parameter field
- •How to use a parameter field in a formula
- •How to respond to parameter field prompts
- •How to use wildcards with parameter fields
- •How to set a report title using parameter fields
- •How to set sort order using parameter fields
- •Graphing Overview
- •Choosing a graph or chart type
- •Where to place your graph
- •Data you can graph on
- •Before you create your graph
- •HANDS-ON (Graphing)
- •How to graph on a summary or subtotal field
- •How to graph on a details field
- •How to graph on a formula field
- •How to graph on cross-tab summaries
- •How to edit graphs using PGEditor
- •How to use the underlay feature with graphs
- •OLE Objects Overview
- •Inserting OLE objects in your reports
- •Linked vs. Embedded Objects
- •The dynamic OLE menu commands
- •OLE and the Picture command
- •General OLE considerations
- •HANDS-ON (OLE Objects)
- •How OLE objects are represented in your report
- •How to use OLE - General Overview Tutorial
- •How to insert a graphic/picture as an OLE object
- •What are subreports?
- •Unlinked vs. linked subreports
- •How subreport linking works
- •HANDS-ON (Subreports)
- •How to insert a subreport
- •How to preview your subreport
- •How to combine unrelated reports using subreports
- •How to use subreports with unlinkable data
- •Cross-tab overview
- •Cross-tab components
- •HANDS-ON (Cross-Tab Objects)
- •How to create a cross-tab object
- •How to format a cross-tab
- •How to print cross-tabs that span multiple pages
- •The Crystal Query Designer
- •HANDS-ON (Queries)
- •How to create a new query
- •How to add tables to a query
- •How to link tables and specify a join type
- •How to add fields to a query
- •How to identify unique values in a query
- •How to summarize data with aggregate functions
- •How to sort records according to field values
- •How to specify records to be included in a query
- •How to select groups to be included in a query
- •How to create an SQL expression
- •How to create a query from another Crystal Query
- •How to select a query for a report
- •How to use a parameter field in a query
- •Dictionaries Overview
- •HANDS-ON (Dictionaries)
- •How to create a new dictionary
- •How to add a data file
- •How to open an SQL or ODBC data source
- •How to link multiple tables
- •How to select tables and fields for users
- •How to add/create formulas
- •How to move fields/field headings within the list
- •How to update the location of a database table
- •How to add a new field heading
- •How to add Help text
- •How to add a graphic
- •How to create sample data for users to browse
- •How to edit an existing dictionary
- •How to convert a 3.x or 4.x dictionary file
- •How to select a dictionary for a report
- •Databases Overview
- •For additional information
- •HANDS-ON (Working With Databases)
- •How to open Access queries through DAO
- •How to open Access queries through ODBC
- •How to open Access parameter queries
- •How to set up an ODBC data source
- •How to check settings for an ODBC data source
- •How to log on to an ODBC data source
- •How to add an ODBC database table to a report
- •How to log on to MS SQL Server via ODBC
- •How to log off an ODBC data source
- •How to set up an A to B, A to C link
- •How to edit an SQL query
- •How to use an ACT! database
- •How to open the NT Event Log
- •Introduction
- •Four types of data
- •Direct access database files
- •ODBC data sources
- •Crystal Query Designer files
- •Crystal Dictionary files
- •Multi-pass reporting
- •Product support
- •Web support
- •E-mail support
- •Fax support
- •Telephone support
- •Extended technical support policy
- •Product registration
- •Product return policy
- •Product replacement policy
- •Glossary
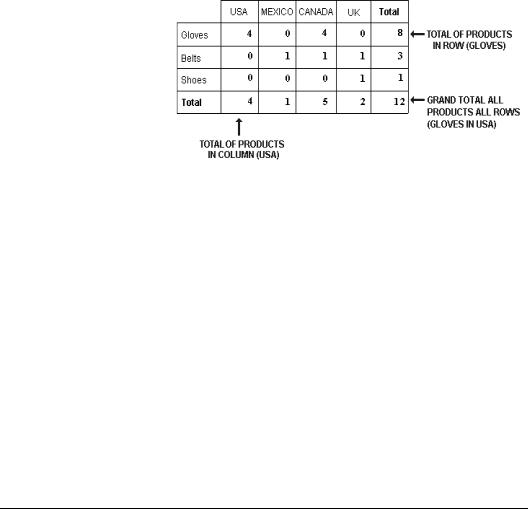
●At the end of each row is a total for that row. In the example above, this total represents the number of a single product sold in all countries. At the end of the “Gloves” row is the value 8, the total number of gloves sold in all countries.
●At the bottom of each column is a total for that column. In the example above, this total represents the number of all products sold in a single country. At the bottom of the “USA” column is the value 4, the total number of products (gloves, belts and shoes) sold in the USA.
●At the intersection of the Totals column (totals for the products) and the Totals row (totals for the countries) is a grand total. In the example above, the value at the intersection is 12, the total number of all products sold in all countries.
HANDS-ON (Cross-Tab Objects)
How to create a cross-tab object
In this tutorial you will create a simple cross-tab using CRAZE.MDB (located in the \CRW directory or the directory in which the program resides).
The Craze database contains several tables; for this example use the following tables:
452 |
Seagate Crystal Reports User’s Guide |

Selecting regions
Selecting products
●Customer
●Product
NOTE: Make certain that the Customer table is linked to the Product table via the Orders and Orders Detail tables for this example. Search for Visual Linking Topics Index in Seagate Crystal
Reports online Help.
The Customer and Product tables contain records for a variety of products and sales regions. To keep the report a manageable size, you will create a cross-tab that shows just a subset of those products and regions. You will restrict the report to: Craze Mtn, Craze Rhino, and Craze Titan locks sold in California, Florida, Illinois, and Oregon. To do this, you will limit the number of regions and products using record selection tools.
The Select Expert makes it easy to specify the records you want included in your report. Simply highlight the field you want to base your selection on and then select the desired records. See
Record and Group Selection, Page 249.
Highlight the Region field of the Customer Table and, using the Select Expert, select the following records:
●CA
●FL
●IL
●OR
Highlight the Product Name field of the Products Table and, using the Select Expert, select the following records:
●Craze Mtn Lock
●Craze Rhino Lock
●Craze Titan Lock
Now you are ready to create your cross-tab.
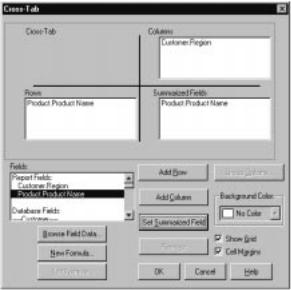
!Click the INSERT CROSS-TAB button on the supplementary toolbar. The Cross-Tab dialog box appears. Using this dialog box you will add the rows, columns, and summary fields that will make up your cross-tab.
Cross-Tab Objects |
453 |
Adding rows
Adding columns
Adding
summarized fields
"In the Fields list box, highlight the {product.PRODUCT NAME} field found listed under the Report Fields heading and click the Add Row button. The highlighted field will be added to the Rows list box.
#In the Fields list box, highlight the {customer.REGION} field found listed under the Report Fields heading and click the Add Column button. The highlighted field will be added to the Columns list box.
$In the Fields list box, highlight the {product.PRODUCT NAME} field, click the Set Summarized Field button. The field will be added to the Summarized Fields list.
NOTE: You can also drag the desired fields from the Database Fields section of the Fields list box to the Rows, Columns, and
Summarized Fields list boxes using the drag-and-drop feature.
Your dialog box should look similar to the following:
%Click OK. A placement frame will appear. Position the crosstab in the Report Header section of your report.
454 |
Seagate Crystal Reports User’s Guide |
NOTE: Placing your cross-tab in different sections of your report will produce different results. For example, cross-tabs placed in the Report Header will contain data for the entire report and will print only once at the beginning of the report while cross-tabs placed in a Group Header will contain data for that group only and will print every time the group changes. See Design Tab Areas,
Page 67, and Area printing characteristics, Page 69.
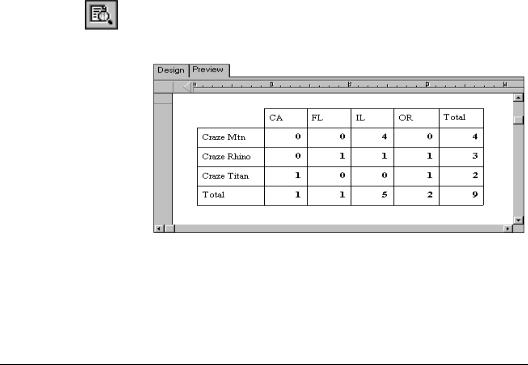
&Click the PRINT PREVIEW button on the standard toolbar to preview your cross-tab. It should look similar to the following:
NOTE: You can independently format rows and columns of your cross-tab with background colors, shading, borders, and fonts to emphasize important data and create professional-looking reports. See How to format a cross-tab, Page 463.
How to create a cross-tab with multiple rows/columns
You will often want to create reports that contain multiple levels of information. For example, you may have a report that contains the sales data for a single product sold to all customers in the USA. You may then want to break your report down further into a region by region analysis for an easy comparison of sales between regions within the USA. Seagate Crystal Reports enables you to create cross-tabs with multiple rows and/or columns to accommodate multiple levels of information such as these.
Cross-Tab Objects |
455 |

Selecting countries
Selecting regions
In this tutorial you will create a cross-tab with multiple rows using CRAZE.MDB (located in the \CRW directory or the directory in which the program resides).
The Craze database contains several tables; for this example you will use the following tables:
●Customer
●Orders
●Orders Detail
NOTE: The Customer table must be linked to the Orders and Orders Detail tables for this example. For more information on linking tables, search for Visual Linking Topics Index in Seagate
Crystal Reports online Help.
The Customer, Orders, and Orders Detail tables contain records for a variety of products, countries, and sales regions. To keep the report a manageable size, you will create a cross-tab that shows a subset of the products, regions, and countries included in the sample data. You will restrict the report to: Craze Adult, Triumph Pro, and Triumph Vertigo helmets sold in the USA in California and Oregon only. To do this, you will limit the number of products, regions, and countries using record selection tools.
The Select Expert makes it easy to specify the records you want included in your report. Simply highlight the field you want to base your selection on and then select the desired records. For more information on record selection, see Record and Group Selection, Page 249.
Highlight the Country field of the Customer Table and, using the Select Expert, select the following record:
● USA
Highlight the Region field of the Customer Table and, using the Select Expert, select the following records:
●CA
●OR
456 |
Seagate Crystal Reports User’s Guide |

Selecting products
Adding multiple rows
Adding the column
Adding the
summarized field
!Highlight the Product Name field of the Products Table and, using the Select Expert, select the following records:
●Craze Adult Helmet
●Triumph Pro Helmet
●Triumph Vertigo Helmet
Now you are ready to create your cross-tab.
"Click the INSERT CROSS-TAB button on the supplementary toolbar. The Cross-Tab dialog box appears. Using this dialog box you will add the rows, columns, and summary fields that will make up your cross-tab.
#In the Fields list box, highlight the {customer.COUNTRY} and click the Add Row button. The highlighted field will be added to the Rows list box.
$Repeat Step 5 adding the {customer.REGION} to the Rows list box as well.
NOTE: The order in which you add rows, columns, and summary fields affects their placement in the cross-tab. The first row or column added will remain outermost in the cross-tab. Consecutive rows will be added inside (to the right of the first row and below the first column). Consecutive summary fields will be added below the first summary field. For more information on multiple summary fields, see How to create a cross-tab with multiple summary
fields, Page 459.
%In the Fields list box again, highlight {product.PRODUCT NAME} and click the Add Column button. The highlighted field will be added to the Columns list box.
NOTE: To create a cross-tab with multiple columns, simply add the desired columns to the Columns list box by following the
instructions for adding multiple rows.
&In the Fields list box again, highlight {orders detail.QUANTITY} and click the Set Summarized Field button. The highlighted field will be added to the Summarized Fields list box.
Cross-Tab Objects |
457 |
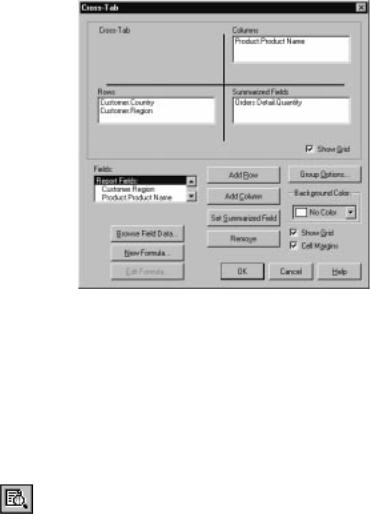
Your dialog box should look similar to the following:
'Click OK. A placement frame will appear. Position the crosstab in the Report Header section of your report.
NOTE: Placing your cross-tab in different sections of your report will produce different results. For example, cross-tabs placed in the Report Header will contain data for the entire report and will print only once at the beginning of the report while cross-tabs placed in a Group Header will contain data for that group only and will print every time the group changes. For more information see Design Tab Areas, Page 67, and Area printing characteristics,
Page 69.
Click the PRINT PREVIEW button on the standard toolbar to preview your cross-tab. It should look similar to the following:
458 |
Seagate Crystal Reports User’s Guide |

NOTE: You can independently format rows and columns of your cross-tab with background colors, shading, borders, and fonts to emphasize important data and create professional-looking reports. For more information on formatting your cross-tab, see
How to format a cross-tab, Page 463.
How to create a cross-tab with multiple summary fields
You will often find it useful to include multiple summaries in your reports. For example, you may have a report that shows the total number of orders for each of your California and Oregon customers. You may then want to show what the average dollar amount of each customer's order is in order to compare the purchasing habits of your customers. Seagate Crystal Reports enables you to create cross-tabs with multiple summary fields to accommodate situations such as these.
In this tutorial you will create a cross-tab with multiple summary fields using CRAZE.MDB (located in the \CRW directory or the directory in which the program resides).
The Craze database contains several tables; for this example you will use the following tables:
●Customer
●Orders
Cross-Tab Objects |
459 |
Selecting regions
Selecting customer
Adding rows
NOTE: The Customer table must be linked to the Orders table for this tutorial. For more information on linking tables, search for Visual Linking Topics Index in Seagate Crystal Reports online Help.
The Customer and Orders tables contain records for a variety of customers, regions, and orders. To keep the report a manageable size, you will create a cross-tab that shows a subset of the customers and regions included in the sample data. You will restrict the report to: Sporting Wheels Inc., The Cyclists Incorporated, and XYZ Company customers in California and Oregon only. To do this, you will limit the number of customers and regions using record selection tools.
The Select Expert makes it easy to specify the records you want included in your report. Simply highlight the field you want to base your selection on and then select the desired records. For more information on record selection, see Record and Group Selection, Page 249.
Highlight the Region field of the Customer Table and, using the Select Expert, select the following records:
●CA
●OR
Highlight the Customer Name field of the Customer Table and, using the Select Expert, select the following records:
●Sporting Wheels Inc.
●Xtreme Cycle
Now you are ready to create your cross-tab.
!Click the INSERT CROSS-TAB button on the supplementary toolbar. The Cross-Tab dialog box appears. Using this dialog box you will add the rows, columns, and summary fields that will make up your cross-tab.
"In the Fields list box, highlight {customer.REGION} and click the Add Row button. The highlighted field will be added to the Rows list box.
460 |
Seagate Crystal Reports User’s Guide |
Adding columns
Adding
multiple summary fields
#In the Fields list box again, highlight the {customer.CUSTOMER NAME} field and click the Add Column button. The highlighted field will be added to the Columns list box.
$In the Fields list box again, highlight {customer.CUSTOMER NAME} and click the Set Summarized Field button. The highlighted field will be added to the Summarized Fields list box.
%Repeat Step 6 and add the {orders.ORDER AMOUNT} to the
Summarized Fields list box as well.
NOTE: The order in which you add rows, columns, and summary fields affects their placement in the cross-tab. The first row or column added will remain outermost in the cross-tab. Consecutive rows will be add inside (to the right of the first row and below the first column). Consecutive summary fields will be added below the first summary field.
Your dialog box should look similar to the following:
&Click OK. A placement frame will appear. Position the crosstab in the Report Header section of your report.
Cross-Tab Objects |
461 |
Changing the
summary operation (aggregate function)
NOTE: Placing your cross-tab in different sections of your report will produce different results. For example, cross-tabs placed in the Report Header will contain data for the entire report and will print only once at the beginning of the report while cross-tabs placed in a Group Header will contain data for that group only and will print every time the group changes. For more information, see Design Tab Areas, Page 67, and Area printing
characteristics, Page 69.
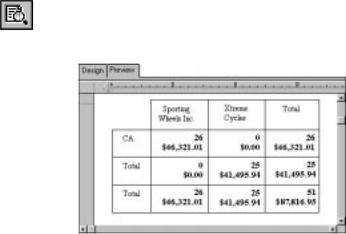
'Click the PRINT PREVIEW button on the standard toolbar to preview your cross-tab. It should look similar to the following:
The first summary operation in your cross-tab is the count of orders for each of the three customers. The second summary operation is the sum of all the orders made by each company. For this example, instead of a sum of all orders, you want to calculate the average order amount for each customer. To do this you will need to change the summary operation for the {orders.ORDER AMOUNT} field.
NOTE: If the first summary operation is not a count, follow the directions below to change the summary operation to count.
Right-click the summary field that you want to change {orders.ORDER AMOUNT} and choose the CHANGE SUMMARY OPERATION command from the shortcut menu. The Change Summary Operation dialog box appears.
Select the desired function from the Summary Operation dropdown box and click OK when finished. For this example, select average. The summary operation will be changed as specified.
462 |
Seagate Crystal Reports User’s Guide |