

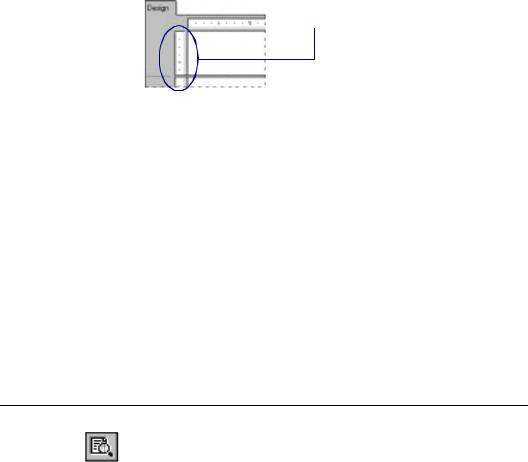
Section ruler.
Other Design Tab capabilities
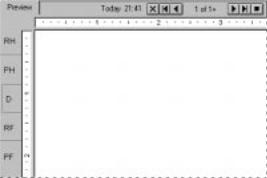
Preview Tab
Whenever you add a new section, the program creates a ruler for that section. See How to add, delete, move, and merge sections, Page 89.
There are several other capabilities built into the Design Tab.
●You can resize a section by dragging its boundary. See How to split and resize sections, Page 92.
●You can split a section (create two sections from one) by clicking its left boundary. See How to split and resize sections, Page 92.
●You can add horizontal and vertical guidelines by clicking the rulers. See How to add, delete, and move guidelines, Page 82.
●You can zoom in and out on your report at any magnification from 25% to 400% of the original size. See
How to zoom your report in and out, Page 86.
When you want to preview your report before printing, click the PRINT PREVIEW button on the standard toolbar.
The program gathers the data, makes the necessary calculations, and displays the report in the Preview Tab on electronic “paper.” With the data in place, you can review the spacing and formatting of your report and see the actual results of all your summaries, formula calculations, and record and group selections.
In true WYSIWYG (What You See Is What You Get) fashion, you can work directly on this live data, fine tuning it until the report has the exact look you want.
The program works with data in the following manner:
72 |
Seagate Crystal Reports User’s Guide |
●The first time the Preview Tab is used, it retrieves data from your underlying data source(s) and saves it with the report (unless you have set up the program not to save data).
●From that point on, the program uses the saved data whenever you preview the report unless you specifically refresh it or add a field that requires the program to retrieve new data.
Seagate Crystal Reports provides two views for previewing your report:
1.Standard view, and
2.Group Tree view.
Standard view
In standard view, the report is displayed a page at a time. Using the navigation buttons in the Preview Tab, you can move to the beginning or end of the report, or you can move backwards and forward through the report a page at a time. For shorter reports or reports in which you're primarily interested in seeing the “bottom line” totals, standard view provides all of the functionality that you need.
THE DATA AGE INDICATOR
The Data Age indicator indicates the date the data was last refreshed or initially retrieved, whichever is the most recent. If the data was initially retrieved or refreshed today, it indicates the time it happened. Search for Save Data with Report command in Seagate Crystal Reports online Help.
Getting to Know Seagate Crystal Reports |
73 |
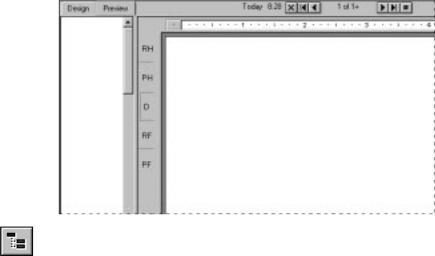
Group Tree view
Similarities/
differences from Design Tab
You can toggle the Group Tree view on/off using the TOGGLE GROUP TREE button on the format bar.
The Group Tree view presents a split screen.
●The right pane of the screen displays the report.
●The left pane displays a high level outline of the report, showing the hierarchy of groups and subgroups in a familiar tree format.
When you click the tree node for the group that interests you, the program jumps immediately to the part of the report that contains the information for that group. For longer reports or reports in which you wish to jump back and forth between different groups, the Smart Navigation features of the Group Tree view make your work extremely efficient.
You have the same formatting capabilities in the Preview Tab as you do in the Design Tab. Menus (both menu bar and shortcut menus), the standard and supplementary toolbars, rulers, and the format bar remain active, giving you essentially the same functionality you have when working with a report in the Design Tab. However, when you are making many changes, it is quicker to make the changes in the Design Tab.
●The Design Tab and Preview Tab are tied together internally. Any changes you make in one are reflected in the other.
74 |
Seagate Crystal Reports User’s Guide |
●The Preview Tab has a single vertical ruler at the left of the tab instead of the individual section rulers like the Design Tab. The functionality of the ruler is the same.
●The Preview Tab identifies report sections in the shaded area to the left of the data. With a quick look you can tell which report section the data is printing from. While section names appeared only once in the Design Tab, they print each time a section prints in the Preview Tab.
●The Record counter (see DATA RETRIEVAL INFORMATION, Page 61), the Data Age indicator (see THE DATA AGE INDICATOR, Page 73), and the Page Forward/ Page Back controls (see Preview Tab, Page 72), are all active in the Preview Tab.
●The Preview Tab highlights every value when you select a field whereas only the field frame is highlighted in the Design Tab.
A DIFFERENT FEEL
Working in the Preview Tab has a different feel than working in the Design Tab.
Each field in a database contains dozens, hundreds, or even thousands of values, depending on the number of records in the database. When you place a field in the Design Tab, a single field frame represents all those values. When you highlight the field, sizing handles appear on the frame and the frame changes color.
In the Preview Tab, however, you are working with the actual data. Instead of a field frame representing many field values, the values themselves appear.
●When you highlight a field or formula field value, you are actually selecting every value in the field.
¾The program places a sizing frame around the specific value you select.
¾It highlights every other value from the field.
●Likewise, when you select a summary value, you are actually selecting all of the related summary values.
Getting to Know Seagate Crystal Reports |
75 |