

- •Welcome to Seagate Crystal Reports
- •Welcome
- •Two kinds of Hands-On tutorials
- •Command, button, key, and control conventions
- •Using Seagate Crystal Reports documentation
- •Seagate Crystal Reports online Help features
- •If you need more help...
- •Installation Requirements
- •Installing Seagate Crystal Reports
- •Installing on a network workstation
- •Upgrading from a previous version
- •Quick Start
- •Subreports expand report usefulness
- •Query Designer adds ad-hoc querying capabilities
- •Parameter fields mean multi-purpose reports
- •Text objects give you text with intelligence
- •Preprinted-form reports easier than ever
- •More powerful formulas extend your capabilities
- •Web solution serves up variety of online reports
- •HTML exporting simplifies Web activities
- •New database support improves data access
- •Running totals made easy
- •Smart Navigation
- •Learning Seagate Crystal Reports
- •User’s Guide
- •Online Help
- •Books Online
- •Sample Reports
- •Glossary
- •Sample Data - CRAZE.MDB
- •Suggested learning paths
- •The application window
- •Menu bar
- •Standard toolbar
- •Supplementary toolbar
- •Format bar
- •Status bar
- •Shortcut menus
- •Cursors
- •Design Tab
- •Preview Tab
- •Other fundamentals
- •HANDS-ON (Report Design Environment)
- •How to add, delete, and move guidelines
- •How to move and position objects using guidelines
- •How to turn the grid on/off
- •How to zoom your report in and out
- •How to undo/redo activities
- •How to drill down on summarized data
- •HANDS-ON (Sections and Areas)
- •How to add, delete, move, and merge sections
- •How to split and resize sections
- •Basic report design
- •How to design a prototype
- •Concepts in reporting
- •Beyond basic reports
- •HANDS-ON (Report Creation and Design)
- •How to select data and begin creating a report
- •How to add and link multiple tables
- •How to insert database fields
- •How to insert special fields
- •How to insert a page n of N field
- •How to insert text objects
- •How to use a database field in a text object
- •How to insert a picture
- •How to select, move, and resize objects
- •How to hide parts of the report
- •HANDS-ON (Finishing Your Report)
- •How to insert page headers and footers
- •How to add a title page to your report
- •How to add summary information to your report
- •Printing considerations
- •Design solutions for printing/distributing
- •Report creation checklist for distributed reports
- •Updating printer drivers
- •Report distribution
- •HANDS-ON (Distributing Your Report)
- •How to export reports
- •How to fax a report
- •How to request reports from a web browser
- •How to specify parameter field values
- •How to log on to a database
- •How to view plain HTML reports
- •Overview
- •Getting started
- •Record Selection
- •Grouping and sorting
- •Completing the report
- •Introduction
- •Working with Arbor Essbase data
- •HANDS-ON (Reporting on OLAP data)
- •How to create a cross-tab with Essbase data
- •Using multiple sections in reports
- •HANDS-ON (Multiple Section Reports)
- •How to work with text objects
- •How to create a form letter using a text object
- •How to format objects conditionally
- •How to print conditional messages in form letters
- •How to alternate background colors for rows
- •How to eliminate blank lines
- •How to add blank lines conditionally
- •Formatting concepts
- •Absolute formatting
- •Types of formatting properties
- •Conditional formatting
- •HANDS-ON (Absolute Formatting)
- •How to add color, shading, and borders
- •How to add/edit lines and boxes
- •How to change margins
- •How to add/delete white space between rows
- •How to set page orientation and paper size
- •HANDS-ON (Conditional Formatting)
- •How to flag values that meet certain conditions
- •Record selection
- •Group selection
- •Record selection formula templates
- •HANDS-ON (Record and Group Selection)
- •How to create a record or group selection formula
- •How to use record/group selection templates
- •How to select the top or bottom N groups
- •Sorting, Grouping, and Totalling Overview
- •Creating custom groups
- •HANDS-ON (Sorting, Grouping, and Totalling)
- •How to do a single field sort
- •How to do a multiple field sort
- •How to group data
- •How to sort records within groups
- •How to summarize grouped data
- •How to subtotal grouped data
- •How to sort based on summarized group values
- •How to create multiple levels of subtotals
- •How to group data in intervals
- •How to calculate a percentage of the grand total
- •How to create group headers
- •What are formulas?
- •Other formula conventions
- •Formula syntax
- •How formulas are evaluated - Order of precedence
- •HANDS-ON (Formulas 101)
- •How to insert a formula in your report
- •How to delete formulas from your report
- •How to copy formulas from online Help
- •How to copy formulas from one report to another
- •How to create if-then-else formulas
- •How to format text with formulas
- •How to use variables in formulas
- •How to declare a variable
- •How to assign a value to a variable
- •How to conditionally assign values to variables
- •How to use an array in a formula
- •How to use a range in a formula
- •How to use semicolons in formulas
- •How to fine tune group selection formulas
- •How to fine tune record selection formulas
- •How to debug a formula
- •Introduction
- •HANDS-ON (Advanced Totalling)
- •How to maintain running totals in a list
- •How to subtotal running totals within groups
- •How to subtotal without grouping
- •How to subtotal true A to B, A to C reports
- •Parameter field objects overview
- •Multiple parameter fields
- •Parameter field considerations
- •HANDS-ON (Parameter Field Objects)
- •How to create a parameter field
- •How to use a parameter field in a formula
- •How to respond to parameter field prompts
- •How to use wildcards with parameter fields
- •How to set a report title using parameter fields
- •How to set sort order using parameter fields
- •Graphing Overview
- •Choosing a graph or chart type
- •Where to place your graph
- •Data you can graph on
- •Before you create your graph
- •HANDS-ON (Graphing)
- •How to graph on a summary or subtotal field
- •How to graph on a details field
- •How to graph on a formula field
- •How to graph on cross-tab summaries
- •How to edit graphs using PGEditor
- •How to use the underlay feature with graphs
- •OLE Objects Overview
- •Inserting OLE objects in your reports
- •Linked vs. Embedded Objects
- •The dynamic OLE menu commands
- •OLE and the Picture command
- •General OLE considerations
- •HANDS-ON (OLE Objects)
- •How OLE objects are represented in your report
- •How to use OLE - General Overview Tutorial
- •How to insert a graphic/picture as an OLE object
- •What are subreports?
- •Unlinked vs. linked subreports
- •How subreport linking works
- •HANDS-ON (Subreports)
- •How to insert a subreport
- •How to preview your subreport
- •How to combine unrelated reports using subreports
- •How to use subreports with unlinkable data
- •Cross-tab overview
- •Cross-tab components
- •HANDS-ON (Cross-Tab Objects)
- •How to create a cross-tab object
- •How to format a cross-tab
- •How to print cross-tabs that span multiple pages
- •The Crystal Query Designer
- •HANDS-ON (Queries)
- •How to create a new query
- •How to add tables to a query
- •How to link tables and specify a join type
- •How to add fields to a query
- •How to identify unique values in a query
- •How to summarize data with aggregate functions
- •How to sort records according to field values
- •How to specify records to be included in a query
- •How to select groups to be included in a query
- •How to create an SQL expression
- •How to create a query from another Crystal Query
- •How to select a query for a report
- •How to use a parameter field in a query
- •Dictionaries Overview
- •HANDS-ON (Dictionaries)
- •How to create a new dictionary
- •How to add a data file
- •How to open an SQL or ODBC data source
- •How to link multiple tables
- •How to select tables and fields for users
- •How to add/create formulas
- •How to move fields/field headings within the list
- •How to update the location of a database table
- •How to add a new field heading
- •How to add Help text
- •How to add a graphic
- •How to create sample data for users to browse
- •How to edit an existing dictionary
- •How to convert a 3.x or 4.x dictionary file
- •How to select a dictionary for a report
- •Databases Overview
- •For additional information
- •HANDS-ON (Working With Databases)
- •How to open Access queries through DAO
- •How to open Access queries through ODBC
- •How to open Access parameter queries
- •How to set up an ODBC data source
- •How to check settings for an ODBC data source
- •How to log on to an ODBC data source
- •How to add an ODBC database table to a report
- •How to log on to MS SQL Server via ODBC
- •How to log off an ODBC data source
- •How to set up an A to B, A to C link
- •How to edit an SQL query
- •How to use an ACT! database
- •How to open the NT Event Log
- •Introduction
- •Four types of data
- •Direct access database files
- •ODBC data sources
- •Crystal Query Designer files
- •Crystal Dictionary files
- •Multi-pass reporting
- •Product support
- •Web support
- •E-mail support
- •Fax support
- •Telephone support
- •Extended technical support policy
- •Product registration
- •Product return policy
- •Product replacement policy
- •Glossary
Then, link a field in the main report to that parameter field using the Subreport Linking Expert.
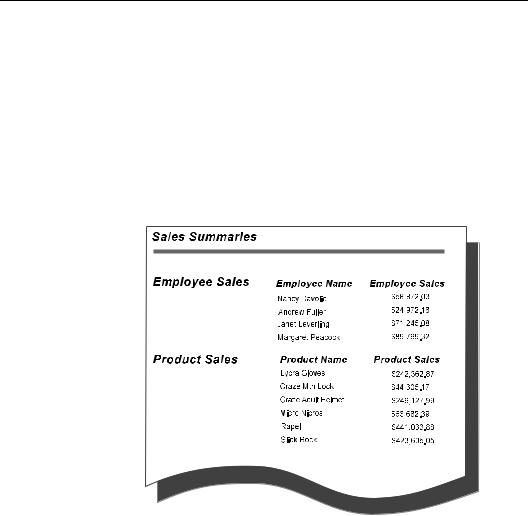
How to combine unrelated reports using subreports
There may be times when you want to combine unrelated reports into a single report. For example, you may want to create a single report that presents:
●sales by sales representative, and
●sales by item.
While both reports deal with sales data, there is no real linear relationship between the reports.
NOTE: This example report has been designed to illustrate concepts only, not the actual look of your finished report.
You can combine unrelated reports into a single report like this using subreports. While the reports could be based on the same data set, they do not have to be. They could each be based on entirely different data sets.
Subreports |
439 |
Each of these reports is freestanding; the data in any of the reports is not linked in any way to the data in any of the other reports. This is the easiest of the subreport options to work with.
TWO UNRELATED REPORTS
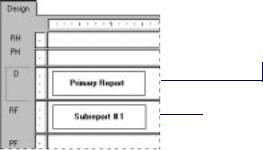
If you want your report to consist entirely of two unrelated reports:
Create the report you want to print first as the primary report. Import an existing report for use as a subreport or create one.
3 Place the report you want to print first in the Details section.
4 Place the subreport into the Report Footer and it will print immediately after the primary report.
THREE OR MORE UNRELATED REPORTS
If you want your report to consist of three or more unrelated reports:
Create the report you want to print first as the primary report.
Import or create each of the other reports you want to use as subreports.
!Using the Section Expert, insert enough Report Footer sections to match the number of subreports that you are using. For example, if you want to use three subreports, insert two new Report Footer sections so you have a total of three Report Footer sections.
"Place the subreport you want to print immediately after the primary report in Report Footer A, the subreport you want to print next in Report Footer B, and so forth. The primary report will print and the subreports will print in the order you placed them on your report.
440 |
Seagate Crystal Reports User’s Guide |
NOTE: You can also place the subreports side-by-side in the same Report Footer section. They will print next to each other at the end of the report.
5 Place the report you want to print first in the Details section.
6 Place the subreports into the Report Footer sections and they will print sequentially after the primary report.
Related Topics
Area printing characteristics, Page 69
How to add, delete, move, and merge sections, Page 89
How to use subreports with unlinkable data
You can link tables in a report as long as the following criteria are met:
●the link fields are both database fields,
●the link fields contain similar data,
●the link fields are the same length, and
●the link field in the link to (lookup) table is indexed (PC databases only).
Linking tables is rarely a problem.
There are some circumstances, however, where you can not coordinate data in different tables because your situation does not fit the linking criteria.
Subreports |
441 |
Linking
to/from a formula field
For example:
●if you want to link to or from a formula field, or
●if you want to link two unindexed tables,
you can not do it in a single report. You have to use subreports.
There are situations where you may need to link to or from a formula (calculated) field. For example, an employee ID could be an 11 character value that consists of a two character department code followed by the employee’s nine character Social Security number (for example, HR555347487). Using the formula language, it is easy to extract the Social Security number from this field:
{employee.EMPLOYEE ID} [-9 to -1]
OR
{employee.EMPLOYEE ID} [3 to 12]
For the value HR555347487, either formula would return the value 555347487.
While the return value is a valid Social Security number, the fact that it comes from a formula prevents you from using the field to link to a Social Security number field in another table. You can report on and coordinate the values in the two tables, however, using a subreport. Search Subscript in Seagate Crystal Reports online Help.
LINKING TO A FORMULA FIELD
Create the primary report using a table that includes the Social Security Number field (for this example, {file.SSN}).
Create (or import) a subreport using the formula that extracts the Social Security Number from the Employee ID field (for this example, {@EXTRACT}). See How to insert a subreport, Page 434.
!Insert the subreport where you want it to appear in the primary report.
"Link the subreport to the primary report by linking the Social Security Number field in the primary report ({file.SSN}) with
442 |
Seagate Crystal Reports User’s Guide |
Linking
unindexed tables
the formula that extracts the number in the subreport ({@EXTRACT}). See How to link a subreport to the data in the primary report, Page 436.
LINKING FROM A FORMULA FIELD
Create the primary report using the formula that extracts the Social Security Number from the Employee ID field (for this example, {@EXTRACT}).
Create (or import) a subreport using a table that includes the Social Security Number field (for this example, {file.SSN}). See
How to insert a subreport, Page 434.
!Insert the subreport where you want it to appear in the primary report.
"Link the subreport to the primary report by linking the formula that extracts the Social Security Number in the primary report ({@EXTRACT}) with the Social Security Number field in the subreport ({file.SSN}). See How to link a subreport to the data in the primary report, Page 436.
When using PC databases (not SQL or ODBC), the link field in the lookup database needs to be indexed to create a valid link. When two tables contain related data yet neither is indexed on the field you want to use as a link field, or if the primary table is indexed but the lookup table is not, you can not link the tables in a single report. You must use subreports if you want to coordinate the data in both tables.
NOTE: It is important to note that linking unindexed tables or linking from an indexed primary table to an unindexed lookup table makes for inefficient reporting. If your data set is large, expect this kind of report to take a considerable time to run. Use this technique only if you do not have any other options.
Create your primary report.
Create (or import) the subreport and insert it into the primary report. See How to insert a subreport, Page 434.
!Link the subreport to the primary report using the unindexed fields (or the indexed field in the primary table and the unindexed field in the lookup table). See How to link a subreport to the data in the primary report, Page 436.
Subreports |
443 |
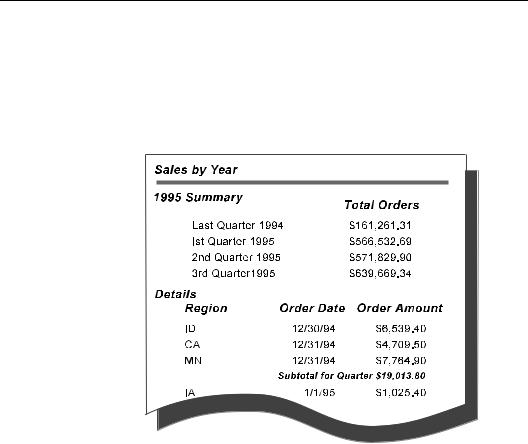
How to show different views of the same data in one report
You can use subreports to provide a different view of the same data as the primary report. For example, assume you want to show summary values at the top of your report and details at the bottom, like this:
NOTE: This example report has been designed to illustrate concepts only, not the actual look of your finished report.
You can do this in different ways. The two easiest ways are:
1.Create the summary report as the primary report and the details report as the subreport. If you do this, you can place the details subreport in the Report Footer section.
2.Create the summary report as the subreport and the details report as the primary report. If you do this, you can place the summary report in the Report Header section.
Coordinate the data in the two reports by linking the report using the appropriate link fields.
444 |
Seagate Crystal Reports User’s Guide |

20 Cross-Tab Objects
What you will find in this chapter...
Cross-tab overview, Page 446
Cross-tab components, Page 451
HANDS-ON (Cross-Tab Objects), Page 452
Cross-Tab Objects |
445 |