- •Welcome to Seagate Crystal Reports
- •Welcome
- •Two kinds of Hands-On tutorials
- •Command, button, key, and control conventions
- •Using Seagate Crystal Reports documentation
- •Seagate Crystal Reports online Help features
- •If you need more help...
- •Installation Requirements
- •Installing Seagate Crystal Reports
- •Installing on a network workstation
- •Upgrading from a previous version
- •Quick Start
- •Subreports expand report usefulness
- •Query Designer adds ad-hoc querying capabilities
- •Parameter fields mean multi-purpose reports
- •Text objects give you text with intelligence
- •Preprinted-form reports easier than ever
- •More powerful formulas extend your capabilities
- •Web solution serves up variety of online reports
- •HTML exporting simplifies Web activities
- •New database support improves data access
- •Running totals made easy
- •Smart Navigation
- •Learning Seagate Crystal Reports
- •User’s Guide
- •Online Help
- •Books Online
- •Sample Reports
- •Glossary
- •Sample Data - CRAZE.MDB
- •Suggested learning paths
- •The application window
- •Menu bar
- •Standard toolbar
- •Supplementary toolbar
- •Format bar
- •Status bar
- •Shortcut menus
- •Cursors
- •Design Tab
- •Preview Tab
- •Other fundamentals
- •HANDS-ON (Report Design Environment)
- •How to add, delete, and move guidelines
- •How to move and position objects using guidelines
- •How to turn the grid on/off
- •How to zoom your report in and out
- •How to undo/redo activities
- •How to drill down on summarized data
- •HANDS-ON (Sections and Areas)
- •How to add, delete, move, and merge sections
- •How to split and resize sections
- •Basic report design
- •How to design a prototype
- •Concepts in reporting
- •Beyond basic reports
- •HANDS-ON (Report Creation and Design)
- •How to select data and begin creating a report
- •How to add and link multiple tables
- •How to insert database fields
- •How to insert special fields
- •How to insert a page n of N field
- •How to insert text objects
- •How to use a database field in a text object
- •How to insert a picture
- •How to select, move, and resize objects
- •How to hide parts of the report
- •HANDS-ON (Finishing Your Report)
- •How to insert page headers and footers
- •How to add a title page to your report
- •How to add summary information to your report
- •Printing considerations
- •Design solutions for printing/distributing
- •Report creation checklist for distributed reports
- •Updating printer drivers
- •Report distribution
- •HANDS-ON (Distributing Your Report)
- •How to export reports
- •How to fax a report
- •How to request reports from a web browser
- •How to specify parameter field values
- •How to log on to a database
- •How to view plain HTML reports
- •Overview
- •Getting started
- •Record Selection
- •Grouping and sorting
- •Completing the report
- •Introduction
- •Working with Arbor Essbase data
- •HANDS-ON (Reporting on OLAP data)
- •How to create a cross-tab with Essbase data
- •Using multiple sections in reports
- •HANDS-ON (Multiple Section Reports)
- •How to work with text objects
- •How to create a form letter using a text object
- •How to format objects conditionally
- •How to print conditional messages in form letters
- •How to alternate background colors for rows
- •How to eliminate blank lines
- •How to add blank lines conditionally
- •Formatting concepts
- •Absolute formatting
- •Types of formatting properties
- •Conditional formatting
- •HANDS-ON (Absolute Formatting)
- •How to add color, shading, and borders
- •How to add/edit lines and boxes
- •How to change margins
- •How to add/delete white space between rows
- •How to set page orientation and paper size
- •HANDS-ON (Conditional Formatting)
- •How to flag values that meet certain conditions
- •Record selection
- •Group selection
- •Record selection formula templates
- •HANDS-ON (Record and Group Selection)
- •How to create a record or group selection formula
- •How to use record/group selection templates
- •How to select the top or bottom N groups
- •Sorting, Grouping, and Totalling Overview
- •Creating custom groups
- •HANDS-ON (Sorting, Grouping, and Totalling)
- •How to do a single field sort
- •How to do a multiple field sort
- •How to group data
- •How to sort records within groups
- •How to summarize grouped data
- •How to subtotal grouped data
- •How to sort based on summarized group values
- •How to create multiple levels of subtotals
- •How to group data in intervals
- •How to calculate a percentage of the grand total
- •How to create group headers
- •What are formulas?
- •Other formula conventions
- •Formula syntax
- •How formulas are evaluated - Order of precedence
- •HANDS-ON (Formulas 101)
- •How to insert a formula in your report
- •How to delete formulas from your report
- •How to copy formulas from online Help
- •How to copy formulas from one report to another
- •How to create if-then-else formulas
- •How to format text with formulas
- •How to use variables in formulas
- •How to declare a variable
- •How to assign a value to a variable
- •How to conditionally assign values to variables
- •How to use an array in a formula
- •How to use a range in a formula
- •How to use semicolons in formulas
- •How to fine tune group selection formulas
- •How to fine tune record selection formulas
- •How to debug a formula
- •Introduction
- •HANDS-ON (Advanced Totalling)
- •How to maintain running totals in a list
- •How to subtotal running totals within groups
- •How to subtotal without grouping
- •How to subtotal true A to B, A to C reports
- •Parameter field objects overview
- •Multiple parameter fields
- •Parameter field considerations
- •HANDS-ON (Parameter Field Objects)
- •How to create a parameter field
- •How to use a parameter field in a formula
- •How to respond to parameter field prompts
- •How to use wildcards with parameter fields
- •How to set a report title using parameter fields
- •How to set sort order using parameter fields
- •Graphing Overview
- •Choosing a graph or chart type
- •Where to place your graph
- •Data you can graph on
- •Before you create your graph
- •HANDS-ON (Graphing)
- •How to graph on a summary or subtotal field
- •How to graph on a details field
- •How to graph on a formula field
- •How to graph on cross-tab summaries
- •How to edit graphs using PGEditor
- •How to use the underlay feature with graphs
- •OLE Objects Overview
- •Inserting OLE objects in your reports
- •Linked vs. Embedded Objects
- •The dynamic OLE menu commands
- •OLE and the Picture command
- •General OLE considerations
- •HANDS-ON (OLE Objects)
- •How OLE objects are represented in your report
- •How to use OLE - General Overview Tutorial
- •How to insert a graphic/picture as an OLE object
- •What are subreports?
- •Unlinked vs. linked subreports
- •How subreport linking works
- •HANDS-ON (Subreports)
- •How to insert a subreport
- •How to preview your subreport
- •How to combine unrelated reports using subreports
- •How to use subreports with unlinkable data
- •Cross-tab overview
- •Cross-tab components
- •HANDS-ON (Cross-Tab Objects)
- •How to create a cross-tab object
- •How to format a cross-tab
- •How to print cross-tabs that span multiple pages
- •The Crystal Query Designer
- •HANDS-ON (Queries)
- •How to create a new query
- •How to add tables to a query
- •How to link tables and specify a join type
- •How to add fields to a query
- •How to identify unique values in a query
- •How to summarize data with aggregate functions
- •How to sort records according to field values
- •How to specify records to be included in a query
- •How to select groups to be included in a query
- •How to create an SQL expression
- •How to create a query from another Crystal Query
- •How to select a query for a report
- •How to use a parameter field in a query
- •Dictionaries Overview
- •HANDS-ON (Dictionaries)
- •How to create a new dictionary
- •How to add a data file
- •How to open an SQL or ODBC data source
- •How to link multiple tables
- •How to select tables and fields for users
- •How to add/create formulas
- •How to move fields/field headings within the list
- •How to update the location of a database table
- •How to add a new field heading
- •How to add Help text
- •How to add a graphic
- •How to create sample data for users to browse
- •How to edit an existing dictionary
- •How to convert a 3.x or 4.x dictionary file
- •How to select a dictionary for a report
- •Databases Overview
- •For additional information
- •HANDS-ON (Working With Databases)
- •How to open Access queries through DAO
- •How to open Access queries through ODBC
- •How to open Access parameter queries
- •How to set up an ODBC data source
- •How to check settings for an ODBC data source
- •How to log on to an ODBC data source
- •How to add an ODBC database table to a report
- •How to log on to MS SQL Server via ODBC
- •How to log off an ODBC data source
- •How to set up an A to B, A to C link
- •How to edit an SQL query
- •How to use an ACT! database
- •How to open the NT Event Log
- •Introduction
- •Four types of data
- •Direct access database files
- •ODBC data sources
- •Crystal Query Designer files
- •Crystal Dictionary files
- •Multi-pass reporting
- •Product support
- •Web support
- •E-mail support
- •Fax support
- •Telephone support
- •Extended technical support policy
- •Product registration
- •Product return policy
- •Product replacement policy
- •Glossary
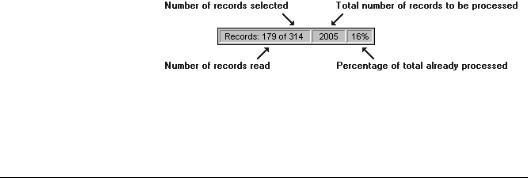
●If your report does not have a selection formula, records selected will always be equal to records read.
3.The third number displays the total number of records that will be processed.
●If your report is based on a single table, the figure that is displayed should remain constant.
●If your report is based on linked tables, and if any one-to- many situations exist, the figure will typically increase as the program identifies all of the linked records.
4.The final number is the percentage of the total records that have been processed.
Once the report has finished processing, the program displays only the number of records selected and the percentage processed.
Shortcut menus
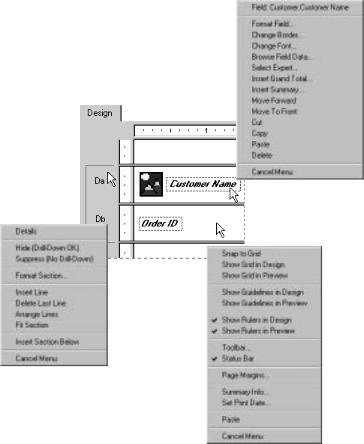
When you are working in either the Design or Preview Tab, you can speed up your work considerably using shortcut menus. When you right-click a report element (a picture, section, field, etc.), the program displays a shortcut menu next to the element. Unlike the program’s standard menus that group commands by function (editing, inserting, etc.), shortcut menus are elementspecific; they contain only those commands that are available for use with the selected element.
The shortcut menus are valuable because they:
●display the name and source (alias) of the element at the top of the menu so you can identify the elements on your report with a single click.
62 |
Seagate Crystal Reports User’s Guide |
●make it easier to learn the program because they eliminate the need to remember where to find a command.
●make working with the program more efficient because you are dealing with only a compact list of commands which make it easier to pick the right one.
●spotlight the things you can do with an element making the program more intuitive to use.
Right-click a field and you
get a menu like this...
Right-click the gray area of the Details section and you get a menu like this...
Right-click the Design Tab itself an get a menu like this...
|
|
|
Getting to Know Seagate Crystal Reports |
63 |
Cursors
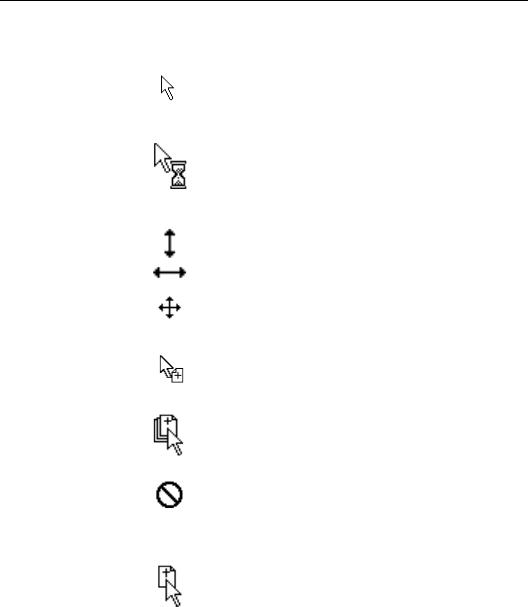
Seagate Crystal Reports uses a number of different cursors at different points in its operation:
The Arrow cursor is the primary cursor. It is used for making menu choices, selecting options from dialog boxes, working with scroll bars, clicking buttons and objects, and so on.
The Hourglass or Background Processing cursor is the cursor that appears whenever the program is processing a command. Whenever the hourglass is visible, you can not choose any commands or proceed further with your report.
The Double-Arrow resizing cursor. It changes to one of a number of different double-arrow cursors whenever it is over a resizing handle on a bit-mapped graphic, a graphic box, a graphic line, or a field.
The Move cursor is available whenever you are moving a single object to another location in your report.
The single-unit Drag and Drop cursor is available whenever you are dragging a single item over an area where it can be dropped.
The multi-unit Drag and Drop cursor is available whenever you are dragging multiple items over an area where they can be dropped. It is also used to copy multiple items at one time.
The Stop cursor. It appears whenever the item you are dragging is over an area in which it can not be dropped. For example, the cursor appears when you drag a cross-tab object into a section where it can not be placed.
The Copy cursor is available whenever you are copying a single item.
64 |
Seagate Crystal Reports User’s Guide |
The Section Sizing cursor. The Arrow cursor changes to the section sizing cursor whenever it is positioned over the boundary of any of the report sections. Using this cursor you can drag a section boundary line to expand or reduce the size of a section.
The Section Splitting cursor. It appears when you position the pointer over the left boundary of a report section. When you click, a horizontal line appears that you position where you want to split the section.
The Link cursor. It appears when you are manually creating links in the Visual Linking Expert. Search for
Visual Linking Topics Index in Seagate Crystal Reports online Help
The Drill Down cursor appears when the pointer is positioned over a summary value or a graph in the Preview Tab. When you double-click a summary value or graph element with the Drill Down cursor, the program displays the details behind the summary.
The Pencil cursor is a drawing cursor. It appears whenever you insert boxes and lines. The point of the pencil marks the spot where the drawing begins and is used to define the size and shape of the object drawn.
The Help cursor is available by clicking the Help button on the Standard Toolbar. Use the Help cursor to access the online Help system. Simply click the report element, dialog box, etc., with the cursor to bring up context sensitive Help for that item.
The Tiny Hand cursor is available in the online Help system. The Arrow cursor changes to the Tiny Hand cursor whenever it is positioned over text or a graphic that jumps to another topic in online Help.
The 2-Dimensional panning cursor. It appears as an Intellimouse feature for scrolling through your report in any direction in the Preview Tab.
The Scroll cursor. It appears as an Intellimouse feature for scrolling up/down in your report in the Preview Tab.
Getting to Know Seagate Crystal Reports |
65 |