

- •Welcome to Seagate Crystal Reports
- •Welcome
- •Two kinds of Hands-On tutorials
- •Command, button, key, and control conventions
- •Using Seagate Crystal Reports documentation
- •Seagate Crystal Reports online Help features
- •If you need more help...
- •Installation Requirements
- •Installing Seagate Crystal Reports
- •Installing on a network workstation
- •Upgrading from a previous version
- •Quick Start
- •Subreports expand report usefulness
- •Query Designer adds ad-hoc querying capabilities
- •Parameter fields mean multi-purpose reports
- •Text objects give you text with intelligence
- •Preprinted-form reports easier than ever
- •More powerful formulas extend your capabilities
- •Web solution serves up variety of online reports
- •HTML exporting simplifies Web activities
- •New database support improves data access
- •Running totals made easy
- •Smart Navigation
- •Learning Seagate Crystal Reports
- •User’s Guide
- •Online Help
- •Books Online
- •Sample Reports
- •Glossary
- •Sample Data - CRAZE.MDB
- •Suggested learning paths
- •The application window
- •Menu bar
- •Standard toolbar
- •Supplementary toolbar
- •Format bar
- •Status bar
- •Shortcut menus
- •Cursors
- •Design Tab
- •Preview Tab
- •Other fundamentals
- •HANDS-ON (Report Design Environment)
- •How to add, delete, and move guidelines
- •How to move and position objects using guidelines
- •How to turn the grid on/off
- •How to zoom your report in and out
- •How to undo/redo activities
- •How to drill down on summarized data
- •HANDS-ON (Sections and Areas)
- •How to add, delete, move, and merge sections
- •How to split and resize sections
- •Basic report design
- •How to design a prototype
- •Concepts in reporting
- •Beyond basic reports
- •HANDS-ON (Report Creation and Design)
- •How to select data and begin creating a report
- •How to add and link multiple tables
- •How to insert database fields
- •How to insert special fields
- •How to insert a page n of N field
- •How to insert text objects
- •How to use a database field in a text object
- •How to insert a picture
- •How to select, move, and resize objects
- •How to hide parts of the report
- •HANDS-ON (Finishing Your Report)
- •How to insert page headers and footers
- •How to add a title page to your report
- •How to add summary information to your report
- •Printing considerations
- •Design solutions for printing/distributing
- •Report creation checklist for distributed reports
- •Updating printer drivers
- •Report distribution
- •HANDS-ON (Distributing Your Report)
- •How to export reports
- •How to fax a report
- •How to request reports from a web browser
- •How to specify parameter field values
- •How to log on to a database
- •How to view plain HTML reports
- •Overview
- •Getting started
- •Record Selection
- •Grouping and sorting
- •Completing the report
- •Introduction
- •Working with Arbor Essbase data
- •HANDS-ON (Reporting on OLAP data)
- •How to create a cross-tab with Essbase data
- •Using multiple sections in reports
- •HANDS-ON (Multiple Section Reports)
- •How to work with text objects
- •How to create a form letter using a text object
- •How to format objects conditionally
- •How to print conditional messages in form letters
- •How to alternate background colors for rows
- •How to eliminate blank lines
- •How to add blank lines conditionally
- •Formatting concepts
- •Absolute formatting
- •Types of formatting properties
- •Conditional formatting
- •HANDS-ON (Absolute Formatting)
- •How to add color, shading, and borders
- •How to add/edit lines and boxes
- •How to change margins
- •How to add/delete white space between rows
- •How to set page orientation and paper size
- •HANDS-ON (Conditional Formatting)
- •How to flag values that meet certain conditions
- •Record selection
- •Group selection
- •Record selection formula templates
- •HANDS-ON (Record and Group Selection)
- •How to create a record or group selection formula
- •How to use record/group selection templates
- •How to select the top or bottom N groups
- •Sorting, Grouping, and Totalling Overview
- •Creating custom groups
- •HANDS-ON (Sorting, Grouping, and Totalling)
- •How to do a single field sort
- •How to do a multiple field sort
- •How to group data
- •How to sort records within groups
- •How to summarize grouped data
- •How to subtotal grouped data
- •How to sort based on summarized group values
- •How to create multiple levels of subtotals
- •How to group data in intervals
- •How to calculate a percentage of the grand total
- •How to create group headers
- •What are formulas?
- •Other formula conventions
- •Formula syntax
- •How formulas are evaluated - Order of precedence
- •HANDS-ON (Formulas 101)
- •How to insert a formula in your report
- •How to delete formulas from your report
- •How to copy formulas from online Help
- •How to copy formulas from one report to another
- •How to create if-then-else formulas
- •How to format text with formulas
- •How to use variables in formulas
- •How to declare a variable
- •How to assign a value to a variable
- •How to conditionally assign values to variables
- •How to use an array in a formula
- •How to use a range in a formula
- •How to use semicolons in formulas
- •How to fine tune group selection formulas
- •How to fine tune record selection formulas
- •How to debug a formula
- •Introduction
- •HANDS-ON (Advanced Totalling)
- •How to maintain running totals in a list
- •How to subtotal running totals within groups
- •How to subtotal without grouping
- •How to subtotal true A to B, A to C reports
- •Parameter field objects overview
- •Multiple parameter fields
- •Parameter field considerations
- •HANDS-ON (Parameter Field Objects)
- •How to create a parameter field
- •How to use a parameter field in a formula
- •How to respond to parameter field prompts
- •How to use wildcards with parameter fields
- •How to set a report title using parameter fields
- •How to set sort order using parameter fields
- •Graphing Overview
- •Choosing a graph or chart type
- •Where to place your graph
- •Data you can graph on
- •Before you create your graph
- •HANDS-ON (Graphing)
- •How to graph on a summary or subtotal field
- •How to graph on a details field
- •How to graph on a formula field
- •How to graph on cross-tab summaries
- •How to edit graphs using PGEditor
- •How to use the underlay feature with graphs
- •OLE Objects Overview
- •Inserting OLE objects in your reports
- •Linked vs. Embedded Objects
- •The dynamic OLE menu commands
- •OLE and the Picture command
- •General OLE considerations
- •HANDS-ON (OLE Objects)
- •How OLE objects are represented in your report
- •How to use OLE - General Overview Tutorial
- •How to insert a graphic/picture as an OLE object
- •What are subreports?
- •Unlinked vs. linked subreports
- •How subreport linking works
- •HANDS-ON (Subreports)
- •How to insert a subreport
- •How to preview your subreport
- •How to combine unrelated reports using subreports
- •How to use subreports with unlinkable data
- •Cross-tab overview
- •Cross-tab components
- •HANDS-ON (Cross-Tab Objects)
- •How to create a cross-tab object
- •How to format a cross-tab
- •How to print cross-tabs that span multiple pages
- •The Crystal Query Designer
- •HANDS-ON (Queries)
- •How to create a new query
- •How to add tables to a query
- •How to link tables and specify a join type
- •How to add fields to a query
- •How to identify unique values in a query
- •How to summarize data with aggregate functions
- •How to sort records according to field values
- •How to specify records to be included in a query
- •How to select groups to be included in a query
- •How to create an SQL expression
- •How to create a query from another Crystal Query
- •How to select a query for a report
- •How to use a parameter field in a query
- •Dictionaries Overview
- •HANDS-ON (Dictionaries)
- •How to create a new dictionary
- •How to add a data file
- •How to open an SQL or ODBC data source
- •How to link multiple tables
- •How to select tables and fields for users
- •How to add/create formulas
- •How to move fields/field headings within the list
- •How to update the location of a database table
- •How to add a new field heading
- •How to add Help text
- •How to add a graphic
- •How to create sample data for users to browse
- •How to edit an existing dictionary
- •How to convert a 3.x or 4.x dictionary file
- •How to select a dictionary for a report
- •Databases Overview
- •For additional information
- •HANDS-ON (Working With Databases)
- •How to open Access queries through DAO
- •How to open Access queries through ODBC
- •How to open Access parameter queries
- •How to set up an ODBC data source
- •How to check settings for an ODBC data source
- •How to log on to an ODBC data source
- •How to add an ODBC database table to a report
- •How to log on to MS SQL Server via ODBC
- •How to log off an ODBC data source
- •How to set up an A to B, A to C link
- •How to edit an SQL query
- •How to use an ACT! database
- •How to open the NT Event Log
- •Introduction
- •Four types of data
- •Direct access database files
- •ODBC data sources
- •Crystal Query Designer files
- •Crystal Dictionary files
- •Multi-pass reporting
- •Product support
- •Web support
- •E-mail support
- •Fax support
- •Telephone support
- •Extended technical support policy
- •Product registration
- •Product return policy
- •Product replacement policy
- •Glossary
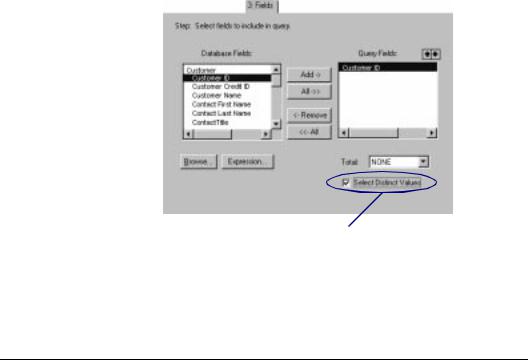
2 Click the Select Distinct Values option to active it.
Related Topics
DISTINCT, Page 551
How to summarize data with aggregate functions
Generates GROUP BY clause
The GROUP BY clause retrieves a set of summary data.
Aggregate functions
Use aggregate functions to obtain summary information on all records or on groups of records. Aggregate functions are most useful when you do not need the detail information and only want to examine totals.
For example, you might need to know the total number of orders made and the average amount of each order. For this kind of query, you apply the COUNT function to the Order ID field, and the AVG (average) function to the Amount field. The query calculates the summary information and provides the results you need.
Click the Fields Tab of the Create Query Expert.
478 |
Seagate Crystal Reports User’s Guide |
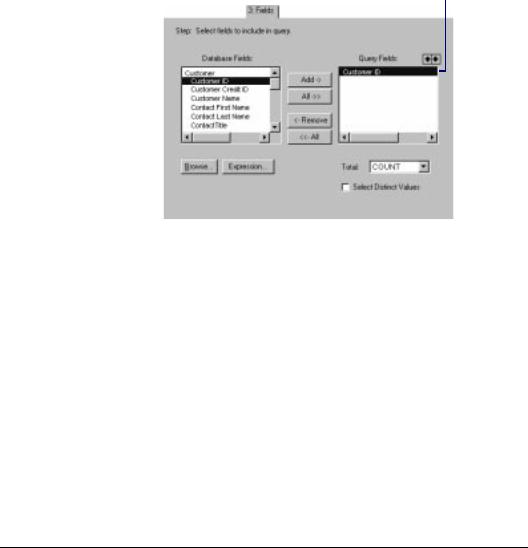
2 Highlight the field you want to summarize from this list.
!In the Total drop-down box, choose an aggregate function to apply to the highlighted field.
●COUNT( ) counts the number of values within a group.
●SUM( ) adds together the values within a group for a total.
●AVG( ) finds the average value of all values within a group.
●MIN( ) finds the minimum value within a group.
●MAX( ) finds the maximum value within a group.
"The query summarizes the field that the aggregate function is applied to. Any other fields that appear in the Query Fields list box are used to sort the data.
Related Topics
GROUP BY, Page 553
How to sort records according to field values
Generates ORDER BY clause
The ORDER BY clause indicates that the database records retrieved be sorted according to the values in a specific field.
Queries |
479 |
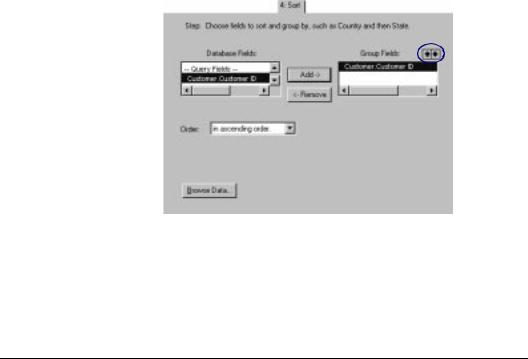
Query data can be grouped either by sorting data, so that records with like data appear grouped in the sorted list, or by summarizing data with aggregate functions, so that summary data appears in your query for each group of records. For information on using aggregate functions in your query, see How to summarize data with aggregate functions, Page 478. This section shows you how to group data by sorting.
Click the Sort Tab in the Create Query Expert.
2 Highlight the field you |
3 Click the |
Use up/down arrows to |
|||||
want sorted from this list. |
Add |
button. |
move fields up/down the list. |
||||
|
|
|
|
|
|
The field will |
|
|
|
|
|
|
|
be added to |
|
|
|
|
|
|
|
the Group |
|
|
|
|
|
|
|
Fields list. |
|
|
|
|
|
|
|
|
|
|
|
|
|
|
|
|
|
|
|
|
|
|
|
|
|
|
|
|
|
|
|
|
|
|
|
|
|
|
|
|
|
|
|
|
|
|
|
|
|
4 Select the order in which you want the data sorted.
Related Topics
ORDER BY, Page 552
How to specify records to be included in a query
Generates WHERE clause
The WHERE clause can specify record selection criteria.
Click the Select Tab of the Create Query Expert.
480 |
Seagate Crystal Reports User’s Guide |
2 Highlight the field |
3 Click the Add button. |
The field will be added to |
|||||
which contains the data |
|
|
the Select Fields list. |
||||
you want to base selection |
|
|
|
|
|
||
criteria on from this list. |
|
|
|
|
|
||
|
|
|
|
|
|
|
|
|
|
|
|
|
|
|
|
|
|
|
|
|
|
|
|
Use these controls to specify the selection criteria to be applied to the field highlighted in the Select Fields dialog box.
These choices work much like the Select Expert in Seagate
Crystal Reports. Search for Select Expert in Crystal Query
Designer online Help.
"Repeat Steps 2 and 3 for every field that appears in the Select Fields list box.
Related Topics
WHERE, Page 552
How to select groups to be included in a query
Generates GROUP BY and HAVING clauses
The HAVING clause creates selection criteria for the summary information produced by the GROUP BY clause.
Click the Fields Tab of the Create Query Expert.
Queries |
481 |
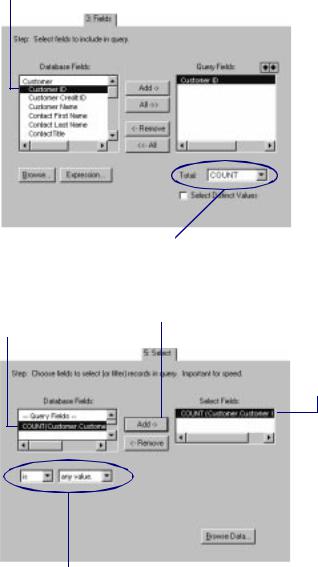
2 Highlight the field you want to summarize in this list.
3 Select the aggregate function from this drop-down list that you want to apply to the highlighted field.
" |
Click the Select Tab. |
|
5 |
Select the aggregate |
6 Click the Add button... |
function from this list box. |
|
|
The field will be added to the Select Fields list.
7 Use the selection criteria controls to specify which group summary values based on the aggregate function should appear in the result.
482 |
Seagate Crystal Reports User’s Guide |