- •Welcome to Seagate Crystal Reports
- •Welcome
- •Two kinds of Hands-On tutorials
- •Command, button, key, and control conventions
- •Using Seagate Crystal Reports documentation
- •Seagate Crystal Reports online Help features
- •If you need more help...
- •Installation Requirements
- •Installing Seagate Crystal Reports
- •Installing on a network workstation
- •Upgrading from a previous version
- •Quick Start
- •Subreports expand report usefulness
- •Query Designer adds ad-hoc querying capabilities
- •Parameter fields mean multi-purpose reports
- •Text objects give you text with intelligence
- •Preprinted-form reports easier than ever
- •More powerful formulas extend your capabilities
- •Web solution serves up variety of online reports
- •HTML exporting simplifies Web activities
- •New database support improves data access
- •Running totals made easy
- •Smart Navigation
- •Learning Seagate Crystal Reports
- •User’s Guide
- •Online Help
- •Books Online
- •Sample Reports
- •Glossary
- •Sample Data - CRAZE.MDB
- •Suggested learning paths
- •The application window
- •Menu bar
- •Standard toolbar
- •Supplementary toolbar
- •Format bar
- •Status bar
- •Shortcut menus
- •Cursors
- •Design Tab
- •Preview Tab
- •Other fundamentals
- •HANDS-ON (Report Design Environment)
- •How to add, delete, and move guidelines
- •How to move and position objects using guidelines
- •How to turn the grid on/off
- •How to zoom your report in and out
- •How to undo/redo activities
- •How to drill down on summarized data
- •HANDS-ON (Sections and Areas)
- •How to add, delete, move, and merge sections
- •How to split and resize sections
- •Basic report design
- •How to design a prototype
- •Concepts in reporting
- •Beyond basic reports
- •HANDS-ON (Report Creation and Design)
- •How to select data and begin creating a report
- •How to add and link multiple tables
- •How to insert database fields
- •How to insert special fields
- •How to insert a page n of N field
- •How to insert text objects
- •How to use a database field in a text object
- •How to insert a picture
- •How to select, move, and resize objects
- •How to hide parts of the report
- •HANDS-ON (Finishing Your Report)
- •How to insert page headers and footers
- •How to add a title page to your report
- •How to add summary information to your report
- •Printing considerations
- •Design solutions for printing/distributing
- •Report creation checklist for distributed reports
- •Updating printer drivers
- •Report distribution
- •HANDS-ON (Distributing Your Report)
- •How to export reports
- •How to fax a report
- •How to request reports from a web browser
- •How to specify parameter field values
- •How to log on to a database
- •How to view plain HTML reports
- •Overview
- •Getting started
- •Record Selection
- •Grouping and sorting
- •Completing the report
- •Introduction
- •Working with Arbor Essbase data
- •HANDS-ON (Reporting on OLAP data)
- •How to create a cross-tab with Essbase data
- •Using multiple sections in reports
- •HANDS-ON (Multiple Section Reports)
- •How to work with text objects
- •How to create a form letter using a text object
- •How to format objects conditionally
- •How to print conditional messages in form letters
- •How to alternate background colors for rows
- •How to eliminate blank lines
- •How to add blank lines conditionally
- •Formatting concepts
- •Absolute formatting
- •Types of formatting properties
- •Conditional formatting
- •HANDS-ON (Absolute Formatting)
- •How to add color, shading, and borders
- •How to add/edit lines and boxes
- •How to change margins
- •How to add/delete white space between rows
- •How to set page orientation and paper size
- •HANDS-ON (Conditional Formatting)
- •How to flag values that meet certain conditions
- •Record selection
- •Group selection
- •Record selection formula templates
- •HANDS-ON (Record and Group Selection)
- •How to create a record or group selection formula
- •How to use record/group selection templates
- •How to select the top or bottom N groups
- •Sorting, Grouping, and Totalling Overview
- •Creating custom groups
- •HANDS-ON (Sorting, Grouping, and Totalling)
- •How to do a single field sort
- •How to do a multiple field sort
- •How to group data
- •How to sort records within groups
- •How to summarize grouped data
- •How to subtotal grouped data
- •How to sort based on summarized group values
- •How to create multiple levels of subtotals
- •How to group data in intervals
- •How to calculate a percentage of the grand total
- •How to create group headers
- •What are formulas?
- •Other formula conventions
- •Formula syntax
- •How formulas are evaluated - Order of precedence
- •HANDS-ON (Formulas 101)
- •How to insert a formula in your report
- •How to delete formulas from your report
- •How to copy formulas from online Help
- •How to copy formulas from one report to another
- •How to create if-then-else formulas
- •How to format text with formulas
- •How to use variables in formulas
- •How to declare a variable
- •How to assign a value to a variable
- •How to conditionally assign values to variables
- •How to use an array in a formula
- •How to use a range in a formula
- •How to use semicolons in formulas
- •How to fine tune group selection formulas
- •How to fine tune record selection formulas
- •How to debug a formula
- •Introduction
- •HANDS-ON (Advanced Totalling)
- •How to maintain running totals in a list
- •How to subtotal running totals within groups
- •How to subtotal without grouping
- •How to subtotal true A to B, A to C reports
- •Parameter field objects overview
- •Multiple parameter fields
- •Parameter field considerations
- •HANDS-ON (Parameter Field Objects)
- •How to create a parameter field
- •How to use a parameter field in a formula
- •How to respond to parameter field prompts
- •How to use wildcards with parameter fields
- •How to set a report title using parameter fields
- •How to set sort order using parameter fields
- •Graphing Overview
- •Choosing a graph or chart type
- •Where to place your graph
- •Data you can graph on
- •Before you create your graph
- •HANDS-ON (Graphing)
- •How to graph on a summary or subtotal field
- •How to graph on a details field
- •How to graph on a formula field
- •How to graph on cross-tab summaries
- •How to edit graphs using PGEditor
- •How to use the underlay feature with graphs
- •OLE Objects Overview
- •Inserting OLE objects in your reports
- •Linked vs. Embedded Objects
- •The dynamic OLE menu commands
- •OLE and the Picture command
- •General OLE considerations
- •HANDS-ON (OLE Objects)
- •How OLE objects are represented in your report
- •How to use OLE - General Overview Tutorial
- •How to insert a graphic/picture as an OLE object
- •What are subreports?
- •Unlinked vs. linked subreports
- •How subreport linking works
- •HANDS-ON (Subreports)
- •How to insert a subreport
- •How to preview your subreport
- •How to combine unrelated reports using subreports
- •How to use subreports with unlinkable data
- •Cross-tab overview
- •Cross-tab components
- •HANDS-ON (Cross-Tab Objects)
- •How to create a cross-tab object
- •How to format a cross-tab
- •How to print cross-tabs that span multiple pages
- •The Crystal Query Designer
- •HANDS-ON (Queries)
- •How to create a new query
- •How to add tables to a query
- •How to link tables and specify a join type
- •How to add fields to a query
- •How to identify unique values in a query
- •How to summarize data with aggregate functions
- •How to sort records according to field values
- •How to specify records to be included in a query
- •How to select groups to be included in a query
- •How to create an SQL expression
- •How to create a query from another Crystal Query
- •How to select a query for a report
- •How to use a parameter field in a query
- •Dictionaries Overview
- •HANDS-ON (Dictionaries)
- •How to create a new dictionary
- •How to add a data file
- •How to open an SQL or ODBC data source
- •How to link multiple tables
- •How to select tables and fields for users
- •How to add/create formulas
- •How to move fields/field headings within the list
- •How to update the location of a database table
- •How to add a new field heading
- •How to add Help text
- •How to add a graphic
- •How to create sample data for users to browse
- •How to edit an existing dictionary
- •How to convert a 3.x or 4.x dictionary file
- •How to select a dictionary for a report
- •Databases Overview
- •For additional information
- •HANDS-ON (Working With Databases)
- •How to open Access queries through DAO
- •How to open Access queries through ODBC
- •How to open Access parameter queries
- •How to set up an ODBC data source
- •How to check settings for an ODBC data source
- •How to log on to an ODBC data source
- •How to add an ODBC database table to a report
- •How to log on to MS SQL Server via ODBC
- •How to log off an ODBC data source
- •How to set up an A to B, A to C link
- •How to edit an SQL query
- •How to use an ACT! database
- •How to open the NT Event Log
- •Introduction
- •Four types of data
- •Direct access database files
- •ODBC data sources
- •Crystal Query Designer files
- •Crystal Dictionary files
- •Multi-pass reporting
- •Product support
- •Web support
- •E-mail support
- •Fax support
- •Telephone support
- •Extended technical support policy
- •Product registration
- •Product return policy
- •Product replacement policy
- •Glossary
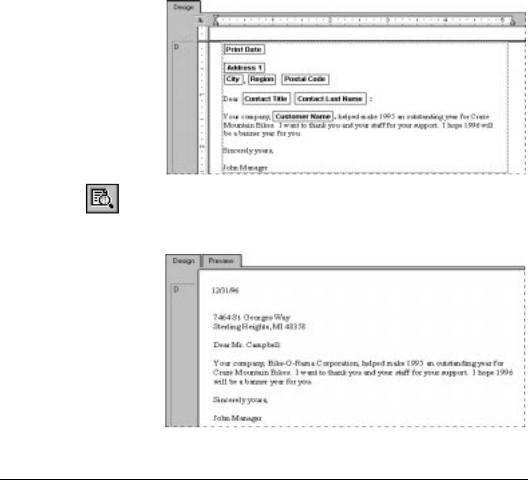
&Click the PRINT PREVIEW button on the standard toolbar to preview the form letter.
It should look similar to the following:
How to format objects conditionally
You may want to create a report that uses different formats based on field values. For example, you may want to print an international report that prints currency values for each country in the format that is common in that country. You can do that using multiple sections.
Create your report. See Tutorial - Customer List, Page 165, and Reporting 101, Page 95.
224 |
Seagate Crystal Reports User’s Guide |
Create one Details section for each country that requires a unique format. See How to add, delete, move, and merge sections, Page 89.
!Make certain that each of the Details sections contains the same data. For example, every field that you place in the Details A section, you must also place in the Details B section, Details C section, etc.
"In the Details A section, click the currency field to select it, then click the OBJECT PROPERTIES button on the supplementary toolbar. The Format Editor appears.
#Set the currency values you want to use for the first country. See Formatting, Page 231.
$ Click OK to return to your report.
%Click the SECTION EXPERT button on the standard toolbar. The Section Expert appears.
&Select the Details A section in the Sections list box. Toggle the
Suppress (No Drill Down) option on.
'Click the Conditional Formula button to the right of the Suppress option and create a formula that specifies the conditions under which the section should be suppressed.
For example, if the Details A section contains currency values for the UK, you would create a formula that specified that the country value is not equal to UK. In other words, suppress the section when the country value is not UK. This would make the section print only when the record contained a UK value.
Repeat Steps 4 through 9 for each additional section.
Now when you print your report, the date and currency data for each country will appear in the format that is expected for that country. See Conditional formatting, Page 235.
How to print conditional messages in form letters
Many times you may want to print conditional messages in form letters. For example, you may want to encourage customers with available credit to buy more and those who are over their credit
Multiple Section Reports |
225 |
limit to bring their accounts down below the limit once again. You can create both of these letters in a single report.
Insert a second Details section in your report using the Section Expert. See How to add, delete, move, and merge sections, Page 89.
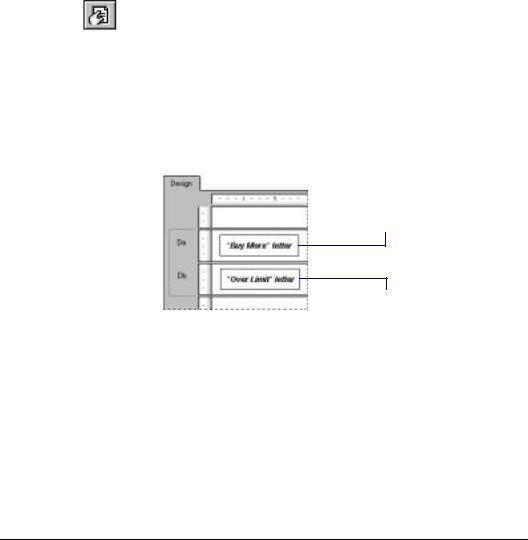
Create two form letters. Place a letter that encourages customers to buy more in the Details A section of your report; place a letter that encourages customers to bring their balance down in the Details B section of your report. See How to create a form letter using a text object, Page 218.
!Using the Section Expert, format the Details sections so that each is suppressed under certain conditions. For example:
Format this section to be suppressed when the balance is less than the credit limit.
Format this section to be suppressed when the balance is more than the credit limit.
Now, when a record indicates available credit, the buy more letter will print. When the account is over limit the over limit letter will print. And when the customer is right at the credit limit, nothing will print at all.
Related Topics
How to format objects conditionally, Page 224
Conditional formatting, Page 235
How to alternate background colors for rows
Another typical use of multiple sections is to vary the background color in alternating lines for the Details section of your report to improve readability (a greenbar-paper effect).
226 |
Seagate Crystal Reports User’s Guide |
Using the Section Expert, insert a second Details section. You should now have Details A and Details B sections. See How to add, delete, move, and merge sections, Page 89.
While in the Section Expert, highlight Details A in the Sections list box, click the Color Tab, and set the background color to White. See Formatting, Page 231.
!Click the Common Tab, click the Conditional Formula button to the right of the Suppress (No Drill Down) option, and type the following formula in the Formula Editor when it appears:
Remainder (RecordNumber,2)<>0
«This formula divides the Record number by 2 and if the remainder is something other than zero (which will happen for every odd numbered record), it tells the program to suppress the section.»
" Now select Details B and set the background color to Green.
#Using the technique from Step 3, set the Suppress option conditionally for this section using the following formula:
Remainder(RecordNumber,2) = 0
«This formula divides the Record number by 2 and if the remainder is equal to zero, it tells the program to suppress the section.»
$Create your report and make certain that the information and layout of each of the Details sections is identical. In other words, whatever you put in Details A, put it in Details B as well.
Now when you run the report, the program will print every even numbered line with a white background and every odd numbered line with a green background.
How to eliminate blank lines
It is very common to have two address lines in a customer table, one (Address 1) for street address and one (Address 2) that can be used for suite number or mail stop. Address 1 usually contains a value but Address 2 is often blank. If you create a customer list
Multiple Section Reports |
227 |