- •Welcome to Seagate Crystal Reports
- •Welcome
- •Two kinds of Hands-On tutorials
- •Command, button, key, and control conventions
- •Using Seagate Crystal Reports documentation
- •Seagate Crystal Reports online Help features
- •If you need more help...
- •Installation Requirements
- •Installing Seagate Crystal Reports
- •Installing on a network workstation
- •Upgrading from a previous version
- •Quick Start
- •Subreports expand report usefulness
- •Query Designer adds ad-hoc querying capabilities
- •Parameter fields mean multi-purpose reports
- •Text objects give you text with intelligence
- •Preprinted-form reports easier than ever
- •More powerful formulas extend your capabilities
- •Web solution serves up variety of online reports
- •HTML exporting simplifies Web activities
- •New database support improves data access
- •Running totals made easy
- •Smart Navigation
- •Learning Seagate Crystal Reports
- •User’s Guide
- •Online Help
- •Books Online
- •Sample Reports
- •Glossary
- •Sample Data - CRAZE.MDB
- •Suggested learning paths
- •The application window
- •Menu bar
- •Standard toolbar
- •Supplementary toolbar
- •Format bar
- •Status bar
- •Shortcut menus
- •Cursors
- •Design Tab
- •Preview Tab
- •Other fundamentals
- •HANDS-ON (Report Design Environment)
- •How to add, delete, and move guidelines
- •How to move and position objects using guidelines
- •How to turn the grid on/off
- •How to zoom your report in and out
- •How to undo/redo activities
- •How to drill down on summarized data
- •HANDS-ON (Sections and Areas)
- •How to add, delete, move, and merge sections
- •How to split and resize sections
- •Basic report design
- •How to design a prototype
- •Concepts in reporting
- •Beyond basic reports
- •HANDS-ON (Report Creation and Design)
- •How to select data and begin creating a report
- •How to add and link multiple tables
- •How to insert database fields
- •How to insert special fields
- •How to insert a page n of N field
- •How to insert text objects
- •How to use a database field in a text object
- •How to insert a picture
- •How to select, move, and resize objects
- •How to hide parts of the report
- •HANDS-ON (Finishing Your Report)
- •How to insert page headers and footers
- •How to add a title page to your report
- •How to add summary information to your report
- •Printing considerations
- •Design solutions for printing/distributing
- •Report creation checklist for distributed reports
- •Updating printer drivers
- •Report distribution
- •HANDS-ON (Distributing Your Report)
- •How to export reports
- •How to fax a report
- •How to request reports from a web browser
- •How to specify parameter field values
- •How to log on to a database
- •How to view plain HTML reports
- •Overview
- •Getting started
- •Record Selection
- •Grouping and sorting
- •Completing the report
- •Introduction
- •Working with Arbor Essbase data
- •HANDS-ON (Reporting on OLAP data)
- •How to create a cross-tab with Essbase data
- •Using multiple sections in reports
- •HANDS-ON (Multiple Section Reports)
- •How to work with text objects
- •How to create a form letter using a text object
- •How to format objects conditionally
- •How to print conditional messages in form letters
- •How to alternate background colors for rows
- •How to eliminate blank lines
- •How to add blank lines conditionally
- •Formatting concepts
- •Absolute formatting
- •Types of formatting properties
- •Conditional formatting
- •HANDS-ON (Absolute Formatting)
- •How to add color, shading, and borders
- •How to add/edit lines and boxes
- •How to change margins
- •How to add/delete white space between rows
- •How to set page orientation and paper size
- •HANDS-ON (Conditional Formatting)
- •How to flag values that meet certain conditions
- •Record selection
- •Group selection
- •Record selection formula templates
- •HANDS-ON (Record and Group Selection)
- •How to create a record or group selection formula
- •How to use record/group selection templates
- •How to select the top or bottom N groups
- •Sorting, Grouping, and Totalling Overview
- •Creating custom groups
- •HANDS-ON (Sorting, Grouping, and Totalling)
- •How to do a single field sort
- •How to do a multiple field sort
- •How to group data
- •How to sort records within groups
- •How to summarize grouped data
- •How to subtotal grouped data
- •How to sort based on summarized group values
- •How to create multiple levels of subtotals
- •How to group data in intervals
- •How to calculate a percentage of the grand total
- •How to create group headers
- •What are formulas?
- •Other formula conventions
- •Formula syntax
- •How formulas are evaluated - Order of precedence
- •HANDS-ON (Formulas 101)
- •How to insert a formula in your report
- •How to delete formulas from your report
- •How to copy formulas from online Help
- •How to copy formulas from one report to another
- •How to create if-then-else formulas
- •How to format text with formulas
- •How to use variables in formulas
- •How to declare a variable
- •How to assign a value to a variable
- •How to conditionally assign values to variables
- •How to use an array in a formula
- •How to use a range in a formula
- •How to use semicolons in formulas
- •How to fine tune group selection formulas
- •How to fine tune record selection formulas
- •How to debug a formula
- •Introduction
- •HANDS-ON (Advanced Totalling)
- •How to maintain running totals in a list
- •How to subtotal running totals within groups
- •How to subtotal without grouping
- •How to subtotal true A to B, A to C reports
- •Parameter field objects overview
- •Multiple parameter fields
- •Parameter field considerations
- •HANDS-ON (Parameter Field Objects)
- •How to create a parameter field
- •How to use a parameter field in a formula
- •How to respond to parameter field prompts
- •How to use wildcards with parameter fields
- •How to set a report title using parameter fields
- •How to set sort order using parameter fields
- •Graphing Overview
- •Choosing a graph or chart type
- •Where to place your graph
- •Data you can graph on
- •Before you create your graph
- •HANDS-ON (Graphing)
- •How to graph on a summary or subtotal field
- •How to graph on a details field
- •How to graph on a formula field
- •How to graph on cross-tab summaries
- •How to edit graphs using PGEditor
- •How to use the underlay feature with graphs
- •OLE Objects Overview
- •Inserting OLE objects in your reports
- •Linked vs. Embedded Objects
- •The dynamic OLE menu commands
- •OLE and the Picture command
- •General OLE considerations
- •HANDS-ON (OLE Objects)
- •How OLE objects are represented in your report
- •How to use OLE - General Overview Tutorial
- •How to insert a graphic/picture as an OLE object
- •What are subreports?
- •Unlinked vs. linked subreports
- •How subreport linking works
- •HANDS-ON (Subreports)
- •How to insert a subreport
- •How to preview your subreport
- •How to combine unrelated reports using subreports
- •How to use subreports with unlinkable data
- •Cross-tab overview
- •Cross-tab components
- •HANDS-ON (Cross-Tab Objects)
- •How to create a cross-tab object
- •How to format a cross-tab
- •How to print cross-tabs that span multiple pages
- •The Crystal Query Designer
- •HANDS-ON (Queries)
- •How to create a new query
- •How to add tables to a query
- •How to link tables and specify a join type
- •How to add fields to a query
- •How to identify unique values in a query
- •How to summarize data with aggregate functions
- •How to sort records according to field values
- •How to specify records to be included in a query
- •How to select groups to be included in a query
- •How to create an SQL expression
- •How to create a query from another Crystal Query
- •How to select a query for a report
- •How to use a parameter field in a query
- •Dictionaries Overview
- •HANDS-ON (Dictionaries)
- •How to create a new dictionary
- •How to add a data file
- •How to open an SQL or ODBC data source
- •How to link multiple tables
- •How to select tables and fields for users
- •How to add/create formulas
- •How to move fields/field headings within the list
- •How to update the location of a database table
- •How to add a new field heading
- •How to add Help text
- •How to add a graphic
- •How to create sample data for users to browse
- •How to edit an existing dictionary
- •How to convert a 3.x or 4.x dictionary file
- •How to select a dictionary for a report
- •Databases Overview
- •For additional information
- •HANDS-ON (Working With Databases)
- •How to open Access queries through DAO
- •How to open Access queries through ODBC
- •How to open Access parameter queries
- •How to set up an ODBC data source
- •How to check settings for an ODBC data source
- •How to log on to an ODBC data source
- •How to add an ODBC database table to a report
- •How to log on to MS SQL Server via ODBC
- •How to log off an ODBC data source
- •How to set up an A to B, A to C link
- •How to edit an SQL query
- •How to use an ACT! database
- •How to open the NT Event Log
- •Introduction
- •Four types of data
- •Direct access database files
- •ODBC data sources
- •Crystal Query Designer files
- •Crystal Dictionary files
- •Multi-pass reporting
- •Product support
- •Web support
- •E-mail support
- •Fax support
- •Telephone support
- •Extended technical support policy
- •Product registration
- •Product return policy
- •Product replacement policy
- •Glossary
The Pan cursor. It appears as an Intellimouse feature for panning right/left in your report in the Preview Tab.
The North panning cursor. It appears as an Intellimouse feature for panning North (up) in your document.
The South panning cursor. It appears as an Intellimouse feature for panning South (down) in your document.
The East panning cursor. It appears as an Intellimouse feature for panning East (to the right) in your document.
The West panning cursor. It appears as an Intellimouse feature for panning West (to the left) in your document.
The Northeast panning cursor. It appears as an Intellimouse feature for panning Northeast (up and to the right) in your document.
The Northwest panning cursor. It appears as an Intellimouse feature for panning Northwest (up and to the left) in your document.
The Southeast panning cursor. It appears as an Intellimouse feature for panning Southeast (down and to the right) in your document.
The Southwest panning cursor. It appears as an Intellimouse feature for panning Southwest (down and to the left) in your document.
Design Tab
When you are working with Seagate Crystal Reports, you will probably find yourself using the Design Tab more than any other part of the program.
66 |
Seagate Crystal Reports User’s Guide |
Design Tab
Areas
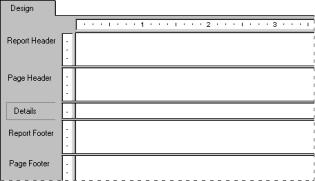
The Design Tab is the place you do most of your initial work when creating a report. It designates and labels the various sections of your report. You can place objects in these sections where you want them to appear, specify your sorting, grouping, and totalling needs, do your initial formatting, and so forth. See Area printing characteristics, Page 69.
The Design Tab provides the most efficient environment for designing your report because you work in the tab with data representations, not data itself. When you place a field on the report, the program uses a frame to identify the field on the tab; it does not retrieve the data. Thus, you can add and delete fields and other objects, move them around, set up complex formulas, and more, without tying up the computer or network resources it takes to gather the data.
The report you create in the Design Tab is a kind of virtual report; it has the structure and the instructions for creating the final report, but it is not the report itself. To turn the Design Tab report into a final report or into a report that you can fine tune, you “just add data.” You do this whenever you preview the report, print it, or output it in any other way. The actual data will now appear in the report.
When you first begin creating a report, Seagate Crystal Reports automatically creates five areas in the Design Tab.
●Report Header
This section is generally used for the report title and other information you want to appear at the beginning of your report. It can also be used for graphs and cross-tabs that include data for the entire report.
Getting to Know Seagate Crystal Reports |
67 |
●Page Header
This section is generally used for information that you want to appear at the top of each page. This can include such things as chapter names, the name of the document, and other similar information. You can also use this section to display field titles above the fields on your report.
●Details
This section is used for the body of the report. The bulk of your report data will generally appear in this section. This section will be printed once per record.
●Report Footer
This section is used for information you want to appear only once at the end of the report, such as grand totals, and for graphs and cross-tabs that include data for the entire report.
●Page Footer
This section usually contains the page number and any other information you want to appear on the bottom of each page.
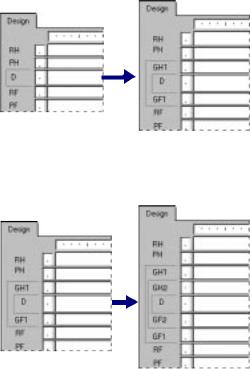
If you add a group, a summary, or a subtotal to your report, the program creates two additional sections:
●Group Header
This section typically holds the group name field, and it can be used to display graphs or cross-tabs that include data specific to the group. It is printed once at the beginning of a group.
●Group Footer
This section generally holds the summary value, if any, and can be used to display graphs or cross-tabs. It is printed once at the end of a group.
When you add a group, a summary, or a subtotal, the Group Header area appears directly above the Details area and the Group Footer area appears directly below the Details area.
68 |
Seagate Crystal Reports User’s Guide |
Area printing characteristics
If you set up additional groups, the program creates new group areas between the Details area and the existing Group Header and Group Footer area(s).
Like the original areas, each of these newly added areas can contain one or more sections. By default they each contain a single section.
Each report area has its own printing characteristics. It is important to understand these characteristics because they affect when and how often different report objects get printed.
WHEN AREAS PRINT
Areas print in the order they appear on the Design Tab (top to bottom). If there is more than one section in an area, the sections print in the order they appear within the area. Thus, if you have three Report Header sections, all three of those sections will print, in order, before the section(s) in the Page Header area begin to print.
Getting to Know Seagate Crystal Reports |
69 |
HOW OFTEN OBJECTS PRINT
Your decision on where to place objects on the Design Tab is made easier if you understand how often each of the areas prints. Once you understand this, most of your reporting decisions are straightforward. This information becomes most useful, however, when you are trying to decide where to place graphs, cross-tabs, and formulas to get specific results.
Objects print in the following ways:
●Objects placed in the Report Header area print once, at the beginning of the report.
¾Graphs and cross-tabs placed in this area contain data for the entire report.
¾Formulas placed in this area are evaluated once, at the beginning of the report.
●Objects placed in the Page Header area print at the beginning of each new page.
¾You can not place graphs or cross-tabs in this section.
¾Formulas placed in this area are evaluated once per page, at the beginning of each new page.
●Objects placed in the Group Header area print at the beginning of each new group.
¾Graphs and cross-tabs placed in this area contain data just for the group.
¾Formulas placed in this area are evaluated once for each group, at the beginning of the group.
●Objects placed in the Details area print with each new record.
¾You can not place graphs or cross-tabs in this area.
¾Formulas placed in this area are evaluated once for each record.
●Objects placed in the Group Footer area print at the end of each group.
¾Graphs and cross-tabs placed in this area contain data just for the group.
70 |
Seagate Crystal Reports User’s Guide |
Identifying and
working with areas and sections
¾Formulas placed in this area are evaluated once for each group, at the end of the group.
●Objects placed in the Report Footer area print once at the end of the report.
¾Graphs and cross-tabs placed in this area contain data for the entire report.
¾Formulas placed in this area are evaluated once, at the end of the report.
●Objects placed in the Page Footer area print at the bottom of each page.
¾You can not place graphs or cross-tabs in this area.
¾Formulas placed in this area are evaluated once per page, at the beginning of each new page.
By default, each area contains only a single section. The name for that section appears directly to the left of the section. If you have multiple sections in an area, the sections are designated as a, b, c, and so forth.
NOTE: Initials, such as RH, PH, D, PF, RF, and so on, are used to identify each section if you have toggled the Show Short Section Names in Design check box on in the File Options dialog box.
Search for File Options dialog box in Seagate Crystal Reports online Help.
NOTE: If you right-click the shaded area containing a section name, a shortcut menu appears with section-specific options. If you right-click the shaded area to the left of the section names, a shortcut menu appears with area-specific options.
The program displays a section ruler immediately to the left of each section. The section ruler is used to add, remove, and move guidelines and to provide a visual reference when you are placing objects. See How to add, delete, and move guidelines, Page 82.
Getting to Know Seagate Crystal Reports |
71 |