


22 |
C.L. Luengo Hendriks et al. |
Fig. 2.10 (a) Initial snake and (b) final snake in active contour method to accurately delineate nuclei
convolution) approach is a recent improvement to the traditional snake [25]. For this example image, the results are rather similar when using the traditional gradient, because the initial snake position is close to its optimal. Also note the large number of parameters used as input to the function snakeminimize, the function that moves the control points of the snake to minimize the snake’s energy function. This large number of parameters (corresponding to the various weights in the energy function) indicates a potential problem with this type of approach: many values need to be set correctly for the method to work optimally, and thus this particular program is only applicable to images obtained under specific circumstances.
2.5 The Future of Automated Cytology
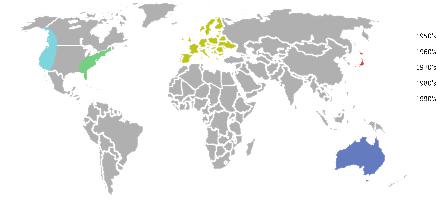
An interesting observation that can be made from the brief samples of the long history of automated cervical cytology that has been presented in this chapter is that the focus of the research in the field has been moving around the world about once every decade – Eastern USA, Japan, Europe, Western USA/Canada, and Australia (Fig. 2.11) – although there are, of course, outliers to this pattern. This pattern might have arisen because of the apparent ease of the problem: when researchers in one region have been making strong promises of progress for too long, without being able to deliver on these promises, it becomes increasingly difficult to obtain more research funds in that region; researchers in a different region in the world are then able to take the lead.
One significant development that we have not discussed so far is the efforts of producing cleaner specimens that are more easy to analyze than the smears, which can be very uneven in thickness and general presentation of the cells. These
2 Rapid Prototyping of Image Analysis Applications |
23 |
||
|
|
|
|
|
|
|
|
|
|
|
|
|
|
|
|
|
|
|
|
|
|
|
|
|
|
|
|
|
|
|
|
|
|
|
|
|
|
|
|
|
|
|
|
Fig. 2.11 A map of the world showing the location of major Pap smear analysis automation research over the decades
efforts led to two commercial liquid cytology systems in the 1990s [26, 27]. The companies behind these sample preparation devices have also developed dedicated image analysis systems. These devices work well, but the modified kits for preparing the specimens are so expensive that most of the economic gain from automation disappears.
The cost of automation is an important issue. One of the original motivations for developing automation was the high cost of visual screening. Still, the first generation automated systems were very complex and expensive machines costing about as much to operate as visual screening. The need for modified sample preparation for some systems added to these costs. A third aspect was that the combined effect of visual and machine screening gives a higher probability of actually detecting a lesion than either one alone, making it hard in some countries, due to legal liability reasons, to use automation alone even if it is comparable in performance to visual screening. All of this has made the impact of automation very limited in the poorer parts of the world, so cervical cancer is still killing a quarter million women each year. Most of these deaths could be prevented by a globally functioning screening program.
A significant challenge for the future, therefore, is to come up with a screening system that is significantly cheaper than the present generation. How can this be achieved? Looking at the history we can see two approaches.
One is the “rare event” approach. Modern whole-slide scanners are much more robust, cheaper, and easier to operate than earlier generations of robot microscopes. With software for such systems, a competitive screening system should be possible, perhaps utilizing a somewhat modified specimen preparation approach that gives cleaner specimens without the high cost of the present liquid-based preparations.
The alternative approach is to use the MAC concept. The obstacle there is to achieve sufficiently robust imaging to consistently detect the subtle changes of chromatin texture between normal and malignancy-influenced cells in an automated
24 |
C.L. Luengo Hendriks et al. |
system. A malignancy-influenced cell looks too much like a normal cell when it is slightly out of focus or poorly segmented. Here, modern 3D scanning concepts may make a significant difference.
So perhaps the next generation systems will be developed in third-world countries, to solve their great need for systems that are better and more economical than the systems that have been developed in the richer parts of the world.
2.6 Conclusions
As we have seen, the availability of a toolbox of image analysis routines greatly simplifies the process of “quickly trying out” an idea. Some of the algorithms that we approximated using only two or three lines of code would require many hundreds of lines of code without such a toolbox.
Another benefit to using an environment like MATLAB is the availability of many other tools not directly related to images that are very useful in developing novel algorithms. For example, in this chapter we have created graphs with some of the intermediate results. Being able to graphically see the numbers obtained is invaluable. In Sect. 2.4.5, we implemented only the first stage of the PAPNET system, but with equal ease we could have constructed the rest, using any of the neural network toolboxes that exist for MATLAB.
These two benefits are augmented in the MATLAB/DIPimage environment with an interpreted language, allowing interactive examination of intermediate results, and a high-level syntax, allowing easy expression of mathematical operations. The downside is that certain algorithms can be two orders of magnitude faster when expressed in C than in MATLAB, and algorithms written in MATLAB are more difficult to deploy. A common approach is to develop the algorithms in MATLAB, and translate them to C, C + +, or Java when the experimentation phase is over. Though it is not always trivial to translate MATLAB code to C, MATLAB code that uses DIPimage has a big advantage: most of the image processing and analysis routines are implemented in a C library, DIPlib, that can be distributed independently of the DIPimage toolbox and MATLAB. All these things considered, even having to do the programming a second time in C, one can save large amounts of time when doing the first development in an environment such as that described here.
References
1.Luengo Hendriks, C.L., van Vliet, L.J., Rieger, B., van Ginkel, M., Ligteringen, R.: DIPimage User Manual. Quantitative Imaging Group, Delft University of Technology, Delft, The Netherlands (1999–2010)
2 Rapid Prototyping of Image Analysis Applications |
25 |
2.Traut, H.F., Papanicolaou, G.N.: Cancer of the uterus: the vaginal smear in its diagnosis. Cal. West. Med. 59(2), 121–122 (1943)
3.Christopherson, W.M., Parker, J.E., Mendez, W.M., Lundin Jr., F.E.: Cervix cancer death rates and mass cytologic screening. Cancer 26(4), 808–811 (1970)
4.Bengtsson, E.: Fifty years of attempts to automate screening for cervical cancer. Med. Imaging Technol. 17(3), 203–210 (1999)
5.Tolles, W.E., Bostrom, R.C.: Automatic screening of cytological smears for cancer: the instrumentation. Ann. N. Y. Acad. Sci. 63, 1211–1218 (1956)
6.Spencer, C.C., Bostrom, R.C.: Performance of the Cytoanalyzer in recent clinical trials. J. Natl. Cancer Inst. 29, 267–276 (1962)
7.Prewitt, J.M.S., Mendelsohn, M.L.: The analysis of cell images. Ann. N. Y. Acad. Sci. 128(3), 1035–1053 (1965)
8.Watanabe, S., the CYBEST group: An automated apparatus for cancer prescreening: CYBEST. Comput. Graph. Image Process. 3(4), 350–358 (1974)
9.Tanaka, N., Ikeda, H., Ueno, T., Watanabe, S., Imasato, Y.: Fundamental study of automatic cyto-screening for uterine cancer. II. Segmentation of cells and computer simulation. Acta Cytol. 21(1), 79–84 (1977)
10.Tanaka, N., Ikeda, H., Ueno, T., Takahashi, M., Imasato, Y.: Fundamental study of automatic cyto-screening for uterine cancer. I. Feature evaluation for the pattern recognition system. Acta Cytol. 21(1), 72–78 (1977)
11.Tanaka, N., Ueno, T., Ikeda, H., Ishikawa, A., Yamauchi, K., Okamoto, Y., Hosoi, S.: CYBEST model 4: automated cytologic screening system for uterine cancer utilizing image analysis processing. Anal. Quant. Cytol. Histol. 9(5), 449–453 (1987)
12.Burger, G., Jutting, U., Rodenacker, K.: Changes in benign cell populations in cases of cervical cancer and its precursors. Anal. Quant. Cytol. 3(4), 261–271 (1981)
13.MacAulay, C., Palcic, B.: An edge relocation segmentation algorithm. Anal. Quant. Cytol. Histol. 12(3), 165–171 (1990)
14.Serra, J.: Image Analysis and Mathematical Morphology. Academic, London (1982)
15.Kuhl, F.P., Giardina, C.R.: Elliptic Fourier features of a closed contour. Comput. Graph. Image Process. 18(3), 236–258 (1982)
16.Haralick, R.M., Shanmugam, K., Dinstein, I.: Textural features for image classification. IEEE Trans. Syst. Man Cybern. 3(6), 610–621 (1973)
17.Galloway, M.M.: Texture analysis using gray level run lengths. Comput. Graph. Image Process. 4(2), 172–179 (1975)
18.MacAulay, C., Palcic, B.: Fractal texture features based on optical density surface area. Use in image analysis of cervical cells. Anal. Quant. Cytol. Histol. 12(6), 394–398 (1990)
19.Lee, J., Nelson, A., Wilbur, D.C., Patten, S.F.: The development of an automated Papanicolaou smear screening system. Cancer 81, 332–336 (1998)
20.DeCresce, R.P., Lifshitz, M.S.: PAPNET cytological screening system. Lab Med. 22, 276–280 (1991)
21.Luck, R.L., Scott, R.: Morphological classification system and method. US Patent 5,257,182, 1993
22.Duda, R.O., Hart, P.E., Stork, D.G.: Pattern Classification, 2nd edn. Wiley, New York (2001)
23.Mehnert, A.J.H.: Image Analysis for the Study of Chromatin Distribution in Cell Nuclei. Ph.D. Thesis, University of Queensland, Brisbane, Australia, 2003
24.Bamford, P., Lovell, B.: Unsupervised cell nucleus segmentation with active contours. Signal Process. 71(2), 203–213 (1998)
25.Li, B., Acton, S.T.: Active contour external force using vector field convolution for image segmentation. IEEE Trans. Image Process. 16(8), 2096–2106 (2007)
26.Hutchinson, M.L., Cassin, C.M., Ball, H.G.: The efficacy of an automated preparation device for cervical cytology. Am. J. Clin. Pathol. 96(3), 300–305 (1991)
27.Howell, L.P., Davis, R.L., Belk, T.I., Agdigos, R., Lowe, J.: The AutoCyte preparation system for gynaecologic cytology. Acta Cytol. 42(1), 171–177 (1998)

Chapter 3
Seeded Segmentation Methods for Medical Image Analysis
Camille Couprie, Laurent Najman, and Hugues Talbot
Segmentation is one of the key tools in medical image analysis. The objective of segmentation is to provide reliable, fast, and effective organ delineation. While traditionally, particularly in computer vision, segmentation is seen as an early vision tool used for subsequent recognition, in medical imaging the opposite is often true. Recognition can be performed interactively by clinicians or automatically using robust techniques, while the objective of segmentation is to precisely delineate contours and surfaces. This can lead to effective techniques known as “intelligent scissors” in 2D and their equivalent in 3D.
This chapter is divided as follows. Section 3.1 starts off with a more “philosophical” section setting the background for this study. We argue for a segmentation context where high-level knowledge, object information, and segmentation method are all separate.
In Sect. 3.2, we survey in some detail a number of segmentation methods that are well-suited to image analysis, in particular of medical images. We illustrate this, make some comparisons and some recommendations.
In Sect. 3.3, we introduce very recent methods that unify many popular discrete segmentation methods and we introduce a new technique. In Sect. 3.4, we give some remarks about recent advances in seeded, globally optimal active contour methods that are of interest for this study.
In Sect. 3.5, we compare all presented methods qualitatively. We then conclude and give some indications for future work.
H. Talbot ( )
Universit´ Paris-Est, Paris, France
G. Dougherty (ed.), Medical Image Processing: Techniques and Applications, Biological |
27 |
and Medical Physics, Biomedical Engineering, DOI 10.1007/978-1-4419-9779-1 3, © Springer Science+Business Media, LLC 2011