

Emerging Tools for Single-Cell Analysis
.pdfFluorescein-Derivatized Bovine Serum Albumin as an Exogenous Antigen |
201 |
F i g . 9.2. Principle of FITC-derivatized BSA and generation of a kinetic probe. Upon spatial separation of fluorescein molecules via unfolding or proteolytic cleavage of the protein carrier, a significant increase in fluorescence intensity results that can be detected using several fluorescence techniques, including flow cytometry and two-photon fluorescence microscopy.
standing of the intracellular microenvironment can be achieved. Finally, the fluorescent properties of the antigen are amenable to noninvasive methodologies to quantitate and monitor alterations in fluorescence parameters within live cells. Therefore, this novel fluorescent probe provided some of the first real-time kinetic measurements of intracellular uptake and processing within antigen-presenting cells, specifically macrophages.

202 |
Application of Fluorescence Lifetime and Two-Photon Fluorescence Cytometry |
Publisher’s Note: Permission to reproduce this image online was not granted by the copyright holder. Readers are kindly requested to refer to the
printed version of this chapter.
F i g . 9.3. Representation of the pH dependence of fluorescein. As pH decreases, a noticeable decrease in the fluorescence intensity of fluorescein is detected. The shaded region represents the pH range observed within the endocytic system. (Copyright Royal Microscopical Society, 1997. Reprinted with permission.)
TWO-PHOTON FLUORESCENCE MICROSCOPY
Prior to flow cytometry, J774 macrophages were incubated with the antigenic probe, and both fluorescence lifetime and fluorescence intensity of single cells were measured using two-photon fluorescence microscopy with time-resolved lifetime imaging. Two-photon fluorescence microscopy is a technique involving the excitation of a fluorophore using two photons each containing one-half the energy required for transition from the ground state to the excited state (French et al., 1997). Therefore, only regions of high photon density will result in excitation (French et al., 1997). The practical application of this phenomenon is that over 80% of the total fluorescence intensity derives from a 1- m-thick region about the focal point, allowing for the construction of three-dimensional images similar to those observed in confocal microscopy with several additional advantages (French et al., 1997). Namely, twophoton fluorescence allows for better separation of excitation and emission light while localizing photobleaching and photodamage to submicrometer regions at the focal point (French et al., 1997). Two-photon fluorescence microscopy also provides for generation of three-dimensional images without using confocal pinholes (French

Two-Photon Fluorescence Microscopy |
203 |
et al., 1997). This is especially important in the context of the current application due to the high spatial density of fluorescent endocytic vesicles (French et al., 1997; Weaver et al., 1997). Because of the three-dimensional imaging capabilities of twophoton fluorescence microscopy, out-of-focus endocytic vesicles contributed minimal fluorescence to lifetime images and did not affect experimental results. In short, each of the parameters listed above was critical for the successful application of twophoton fluorescence microscopy in studying antigen processing within viable cells (French et al., 1997; Weaver et al., 1996).
To perform two-photon experiments, macrophage cells were incubated with FITC–BSA for various periods of time at 37°C, and the cells were immediately ob-
Publisher’s Note: Permission to reproduce this image online was not granted by the copyright holder. Readers are kindly requested to refer to the
printed version of this chapter.
F i g . 9.4. Two-photon imaging of macrophage cell line J774 incubated with FITC–BSA for various periods of time. Macrophage cell line J774 was incubated with FITC–BSA, and the fluorescence intensity (left panel) and fluorescence lifetime (right panel) were monitored at 1h, 5h, and 24h using two-photon fluorescence microscopy with time-resolved fluorescence lifetime imaging. As the probe was degraded within the cell, noticeable increases in fluorescence lifetime and intensity were detected. (Copyright Royal Microscopical Society, 1997. Reprinted with permission.) See color plates.

204 |
Application of Fluorescence Lifetime and Two-Photon Fluorescence Cytometry |
served microscopically (French et al., 1997). Increases in both fluorescence lifetime and intensity were observed throughout the experiment, indicative of the proteolysis of FITC–BSA (Fig. 9.4). In a similar experiment, increased fluorescence intensity was not observed with the nondegradable polymer FITC–poly-D–lysine, verifying that the increases in both fluorescence lifetime and intensity observed with FITC–BSA were due to specific enzymatic degradation. Interestingly, the average fluorescence lifetime of intracellular FITC–BSA was only 2.2 ns after 24 h, which was significantly lower than expected, even when accounting for the acidic environment of the endocytic system (French et al., 1997; Fig. 9.4). This discrepancy can be explained in part by the fact that the reported values are averages, and single cells contain vacuoles with totally degraded protein as well as vacuoles with partially degraded antigen. Moreover, a macromolecule such as the MHC II could be interacting with fluoresceinated peptide fragments and causing fluorescence quenching (French et al., 1997). Regardless of the mechanism, these results proved that FITC–BSA was localized to an acidic environment and enzymatically processed over a period of 24 h within the endocytic system of murine macrophages (French et al., 1997). More importantly, these data represented the first kinetic measurements of antigen processing within living cells and served as a foundation for flow cytometry experiments.
APPLICATION OF FLOW CYTOMETRY FOR MONITORING ANTIGEN PROCESSING AND PRESENTATION
Fluorescence Intensity Measurements
Once two-photon microscopy confirmed the validity of the antigenic probe, flow cytometry fluorescence intensity measurements were utilized to characterize the processing pathway, and these experiments provided crucial details in regard to both the mechanism of internalization and the kinetics of degradation. However, it is important to mention that several fluoresceinated derivatives of BSA were studied both in vitro and in vivo to determine the most suitable derivative for flow cytometry measurements (Voss et al., 1996). In contrast to other probes, FITC10BSA exhibited an important balance of spectral properties. The probe produced a sufficient level of fluorescence in the flow cytometer even at low concentrations (2–10 g/ml), and the fluorescence was sufficiently quenched such that FITC10BSA was sensitive to events such as unfolding and proteolysis (Voss et al., 1996). Additionally, enzyme-linked immunosorbent assay (ELISA) with anti-BSA antibodies revealed that the antigenic structure of the BSA carrier was left relatively unaffected by FITC conjugation (French et al., 1997). Based on these studies, 10 FITC groups per molecule of BSA were selected as the optimum degree of substitution to monitor antigen processing in flow cytometry measurements (Weaver et al., 1996).
Flow cytometry fluorescence intensity measurements proved invaluable in dissecting the mechanism of uptake by murine macrophages. Specifically, the ability to monitor the internalization of antigen by live cells provided important kinetic information that ultimately resulted in the identification of a novel macrophage receptor

Application of Flow Cytometry for Monitoring Antigen Processing and Presentation |
205 |
possessing specificity for fluorescein and other aromatic structures (Cherukuri et al., 1997a). Using methods developed by Sklar et al. (1984), flow cytometry measurements revealed that as fluorescein substitution of BSA increased, a concomitant increase in the rate of uptake was observed (Cherukuri et al., 1997a; Sklar and Finney, 1982; Fig 9.5). Rates of 4.2 0.2 106, 9.6 0.1 106, and 1.9 0.1 107 M-1 min-1 were observed for FITC5BSA, FITC10BSA, and FITC22BSA, respectively (Cherukuri et al., 1997a). The same study also demonstrated that receptor-mediated endocytosis was the primary mechanism for internalization of FITC–BSA by macrophages (Cherukuri et al., 1997a). One obvious conclusion derived from these studies was that a receptor possessing specificity for fluorescein and other aromatic structures was involved in antigen internalization (Cherukuri et al., 1997a). To con-
Publisher’s Note: Permission to reproduce this image online was not granted by the copyright holder. Readers are kindly requested to refer to the
printed version of this chapter.
F i g . 9.5. Internalization of FITCxBSA probes by murine macrophage cell line J774. Macrophage cells were incubated with 10 g of FITC3BSA ( ), FITC5BSA ( ), FITC8BSA ( ), FITC10BSA ( ), FITC15BSA ( ), or FITC22BSA ( ) for the specified period of time. Fluorescence intensity was monitored on the flow cytometer. Data represented averages SEM of triplicate experiments. (Copyright Elsevier Science, 1997. Reprinted with permission)
206 |
Application of Fluorescence Lifetime and Two-Photon Fluorescence Cytometry |
firm this conclusion, a series of model synthetic probes consisting of fluorescein labeled poly-D-lysine were developed for use with flow cytometry (Cherukuri et al., 1997b). The probes possessed several characteristics essential for measuring intracellular uptake. Most importantly, as a D-isomer, FITC–poly-D-lysine could be neither enzymatically degraded nor recognized by receptors (Cherukuri et al., 1997b). Therefore, the effects of carrier molecules on cellular uptake were negligible, and the role of the hapten could be analyzed in a more controlled system (Cherukuri et al., 1997b). Using the methods of Sklar et al. (1984), these studies confirmed that hapten recognition was critical for the optimal uptake of fluorescein-derivatized probes by J774 macrophages as well as peritoneal macrophages (Cherukuri et al., 1997b; Cherukuri and Voss, 1998; Sklar et al., 1984).
In addition to identifying the receptor, flow cytometry offered a simple technique for examining the specificity of the receptor. Cells were either preincubated or coincubated with various monovalent ligands at several concentrations (Cherukuri and Voss, 1998). These samples were analyzed by flow cytometry, and the percent inhibition of fluorescence intensity was calculated (Cherukuri and Voss, 1998). These data revealed that unconjugated phenyl ring structures (i.e., L-pheny- lalanine) possessed higher inhibitory efficiency relative to derivatized phenyl ring structures such as fluoresceinamine (Cherukuri and Voss, 1998). Once the specificity of the receptor was determined, purification of the novel protein was required, and although subsequent purification involved biochemical techniques, flow cytometry fluorescence intensity measurements facilitated the identification and initial characterization of this novel receptor (Cherukuri et al., 1997a, 1998; Cherukuri and Voss, 1998). The obvious benefits of flow cytometry in the context of this system were rapid data collection, existence of theoretical models for monitoring receptor–ligand interactions, consistent quantitative measurements, and statistically significant analyses of the entire cell population (Sklar and Finney, 1982; Cherukuri et al., 1997a).
Flow cytometry fluorescence intensity measurements also provided a powerful tool for analyzing the processing of the antigenic probe within the endocytic system of the cell. In these experiments, two protocols were available. First, the cells were added to the flow cytometer, and once the level of autofluorescence was established, antigen was added to the cell sample directly on the flow cytometer followed by a brief mixing step. The fluorescence intensity of cells was then monitored over extended periods of time. The second experiment involved incubating cells in tissue culture with antigen and removing an aliquot of cells at specified time points for analysis by flow cytometry. Each of these experiments provided important information related to processing of antigen for MHC II loading. As evident in Figure 9.6, the average fluorescence intensity of cells was relatively homogeneous, suggesting that the processing of antigen by these cells was a synchronous process within the cell population (Weaver and Voss, 1998a; Fig. 9.6). In the context of the second protocol, flow cytometry offered a novel method to investigate the requirements for antigen processing by applying various inhibitors of the processing pathway to the cells. Inhibitors of adenosine triphosphate (ATP) synthesis and endocytic trafficking were utilized throughout these studies and proved to be invaluable (Weaver et al., 1996;

Application of Flow Cytometry for Monitoring Antigen Processing and Presentation |
207 |
Publisher’s Note: Permission to reproduce this image online was not granted by the copyright holder. Readers are kindly requested to refer to the
printed version of this chapter.
F i g . 9.6. Homogeneous uptake and processing of FITC10BSA by murine peritoneal macrophages. Cells were monitored on the flow cytometer for several seconds prior to the addition of FITC10BSA to establish the level of autofluorescence. FITC10BSA at 10 g/ml was then added directly to the cells on the flow cytometer, and fluorescence intensity was monitored as a function of time. (Copyright Editions Scientifiques et Medicales Elsevier, 1998. Reprinted with permission.)
Weaver and Voss, 1998b). As a specific example, protease inhibitors were also incubated with the cells prior to the addition of FITC10BSA. Interestingly, the kinetics of processing were altered in the presence of these inhibitors (Weaver et al., 1996; Weaver and Voss, 1998a). Inhibition by thiol and aspartyl protease inhibitors was observed at slightly different time points early in the pathway (Fig. 9.7; Weaver et al., 1996; Weaver and Voss, 1998a). This was consistent with previous reports which demonstrated the importance of cathepsin B, a thiol protease, and cathepsin D, an aspartyl protease, in the generation of T-cell epitopes (Fineschi and Miller, 1997). In the case of serine and metalloprotease inhibitors, inhibition was observed at 120 min. (Fig. 9.7; Weaver et al., 1996). The conclusion derived from these experiments was that the enzymatic processing of antigen within these cells was a sequential series of events. Therefore, the localization and activity of these enzymes provide an important regulatory mechanism for this pathway (Fineschi and Miller, 1997). This is important since the goal of processing is to generate peptides that induce T-cell stimulation and protective immunity (Weaver et al., 1996). Moreover, if this process were not regulated, many antigenic determinants could be destroyed (Weaver et al., 1996). Although discussed in the context of other systems, this idea represented an important conceptual advance in the area of antigen processing and presentation (Weaver et al., 1996). For this reason, the application of the novel fluorescent probe to flow cytometry intensity measurements proved to be a significant methodology for offering new insights into these intracellular events.
At this point, it is important to note the similarity in kinetics between flow cytometry and two-photon fluorescence microscopy. This was significant because the 3-dimensional resolution afforded by two-photon fluorescence verified that only
208 |
Application of Fluorescence Lifetime and Two-Photon Fluorescence Cytometry |
fluorescence localized within the vacuoles of the cells was observed, and the apparent similarity in data validated the use of flow cytometry as a method to monitor the kinetics of intracellular, endocytic events (Fig. 9.8; French et al., 1997). Flow cytometry had additional advantages, specifically the ability to gate on a particular population of cells, thereby eliminating the contribution of dead cells to total fluorescence. Moreover, compared to two-photon fluorescence microscopy, the flow cytometry analysis provided a statistically significant analysis of the entire cell population over an extended period of time.
Besides detecting intracellular events, flow cytometry intensity measurements were also useful for detecting surface-expressed MHC II–peptide complexes. Subcellular fractionation experiments revealed that fluorescein was associated with peptides bound in the context of the MHC II molecule (Weaver and Voss, 1998b). Furthermore, the fluorescyl moieties were accessible for binding by high-affinity antifluorescein antibodies (Weaver et al., 1998b). Therefore, both antifluorescein and anti-MHC II antibodies could be used to stain for MHC II–fluoresceinated peptide complexes on the cell surface. Namely, these antibody reagents should provide a useful nonradioactive alternative for calculating the number of specific MHC II–peptide complexes on the cell surface.
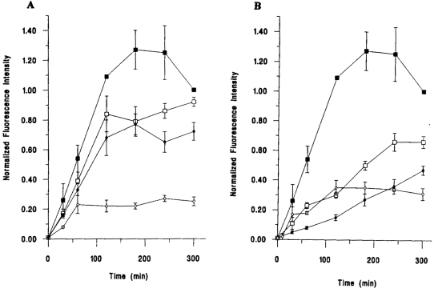
F i g . 9.7. Effect of specific protease inhibitors on the processing of FITC10BSA. (A) Prior to incubation with 10 g/ml of FITC10BSA, macrophage cells were preincubated with 15 M TPCK ( ), 250 M E-64 ( ), and 45 M 1,10 phenanthroline ( ). (B) Cells were also preincubated with 350 M Pepstatin A ( ), 50 M TLCK( ), or 500 M leupeptin ( ) prior to addition of 10 g/ml of FITC10BSA. Data represented averages SEM of triplicate experiments. Fluorescence intensity was normalized to the fluorescence of cells incubated for 300 min. Cells incubated with 10 g/ml of FITC10BSA ( ). TPCK: N-tosyl-L-phenyl- alanine chloromethyl ketone. E-64: trans-epoxysuccinyl-L-leucylamido-(4-guanidino) butane. TLCK: N - p-tosyl-L-lysine chloromethyl ketone.

Application of Flow Cytometry for Monitoring Antigen Processing and Presentation |
209 |
F i g . 9.8. Kinetics of intracellular degradation of FITC10BSA by murine macrophage cell line J774. Cells were preincubated with 10 g/ml of FITC10BSA and incubated for the specified period of time at 37°C. After several washes, fluorescence intensity of cells was monitored by two-photon fluorescence microscopy (lower panel) or flow cytometry (upper panel). Data represented averages SEM of triplicate experiments.
Fluorescence Polarization Measurements
In order to monitor fluorescence polarization, a fluorophore is excited with planepolarized light, and the resulting fluorescence is detected in the planes parallel and perpendicular to the excitation light. Assuming that the rotational lifetime of the fluorophore is less than the fluorescence lifetime, the emission will have a different

210 |
Application of Fluorescence Lifetime and Two-Photon Fluorescence Cytometry |
polarization than the excitation, making it possible to gain information about the fluorophore’s local environment (Lakowicz, 1983; Weber, 1952). In the present system, fluorescence polarization analysis by flow cytometry provided a useful method for monitoring the local environment and intracellular processing of FITC10BSA within the cell. However, in these experiments, calibration of the flow cytometer was critical. Therefore, highand low-fluorescence polarization controls were monitored prior to the experiment. For the low-fluorescence polarization control, FITC10BSA was digested with Pronase for 35 min. These peptides were then incubated with macrophages for 30 min, and fluorescence polarization was monitored on the flow cytometer. As expected, due to extensive rotational motion of these peptides, a fluorescence polarization value of 0.04 0.01 was observed (Fig. 9.9). As a high-fluorescence polarization control, the fluorescence polarization of Immunobrite III beads was also monitored on the flow cytometer (Fig. 9.9). Upon addition of the beads, a fluorescence polarization value of 0.380.01 was determined (Figure 9.9). Since these results verified that the flow cytome-
F i g . 9.9. Representative fluorescence intensity histograms of murine macrophage cell line J774 preincubated with various fluorescent probes. The upper panel represents the fluorescence intensity of Immunobrite level III beads. The middle panel represents the fluorescence intensity of Pronase-digested FITC10BSA peptides. The lower panel represents the fluorescence intensity of cells incubated with 10g/ml FITC10BSA. In all examples, fluorescence intensity in the both the vertical and horizontal planes was detected.