

Emerging Tools for Single-Cell Analysis
.pdfMaterials and Methods |
181 |
F i g . 8.2. Conceptual diagram of the multifrequency, fluorescence lifetime flow cytometer illustrating the laser excitation pulse train, beam splitter (BS), laser monitor, cell sample stream, cell-stream laser-beam intersection point in the flow chamber, fluorescence detector, fluorescence and laser monitor signals, and time and multifrequency measurement signal-processing electronics for making lifetime-based measurements.
always be larger than the weighted average of the individual component lifetime values, whereas the lifetime determined by phase shift will always be shorter than the weighted average (Spencer and Weber, 1969). It is only when there is a single exponential decay that both methods give the same result. Also, phase shift measurements at two or more frequencies can be used to detect heterogeneous fluorescence decays (Deka et al., 1995). If the decay is multiexponential, measurement by time-resolved methods (Deka and Steinkamp, 1996; Demas, 1983; Lakowicz, 1983) or by multifrequency methods over a wide range of frequencies (Jameson et al., 1984; Lakowicz et al., 1984) is required, as illustrated in Figure 8.2, using the multiharmonic frequency content from the pulse train of a mode-locked laser (Alcala et al., 1985; Lakowicz et al., 1986).
Phase-Resolved Separation of Fluorescence Emission Signals. The principle of phase suppression, as applied to flow cytometry, for separating two fluorescence emission signals having different lifetimes (i.e., phase shifts 1 and 2) by phase-sensitive detection, is illustrated below and in Figure 8.4B. The output of the PSD (by superposition of the two signals) is
|
1 |
|
V |
|
cos( |
|
– |
)e |
–a2(t–t )2 |
1 |
|
V |
|
cos( |
|
– |
)e |
–a2(t – t |
)2 |
(8.9) |
v (t) m |
1 |
1 |
0 |
m |
2 |
2 |
0 |
|
||||||||||||
0 |
2 |
1 |
|
|
R |
|
|
2 |
2 |
|
|
R |
|
|
|
|
||||
where V1 and V2 are the signal intensities, m1 and m2 are the demodulation factors, and1 and 2 are the phase shifts that result when a cell stained with two fluorochromes,
182 |
Fluorescence Lifetime Flow Cytometry |
each having a different lifetime 1 and 2, is excited by a single modulated source. To resolve either of the two signals, the reference phase is shifted by an amount /21 or - /2 2 degrees (Veselova et al., 1970). This results in one signal being passed and the other being nulled. For example, if the reference phase is adjusted to equal - /2 2 degrees, the detector output is expressed as
|
1 |
|
|
|
– )e |
–a2(t–t )2 |
(8.10) |
v (t) m V sin( |
|
0 |
|||||
0 |
2 |
1 |
1 |
2 |
1 |
|
|
Similarly, if the reference phase is adjusted to equal /2 1 degrees, the output is expressed as
v |
1 |
|
V |
|
sin( |
|
– |
2 |
(t–t0) |
2 |
(8.11) |
(t) m |
2 |
2 |
)e–a |
|
|||||||
0 |
2 |
2 |
|
|
1 |
|
|
|
|
||
Both signals are resolved, but with a loss in amplitude [sin ( 2 - 1)]. When fluorescence signals are processed by two PSDs operating in parallel, the contributions to the total fluorescence signal are resolved by setting one detector reference to /2 1 degrees and the other detector reference to - /2 2 degrees (Steinkamp and Crissman, 1993).
Signal Processing. The present signal detection/processing electronics (Steinkamp et al., 1993) are based on the homodyne signal-processing scheme. Signal homodyning (Blair and Sydenham, 1975) relies on direct measurement of the phase shift by multiplying the signal with a suitable reference at the same frequency using any number of electronic devices, such as a double-balanced mixer. This is conceptually the simplest form of signal processing. The main disadvantages are susceptibility to noise interference; requirements for high-frequency precision electronics; loss of phase resolution at high frequencies due to limited resolution of variable time delays; and processing that can be implemented only in the analog mode for high-frequency measurements.
To avoid the need for high-frequency signal-processing electronics and to better isolate the signal from noise interference, a frequency-heterodyning technique has been developed for static spectrofluorometric frequency-domain lifetime measurement (Spencer and Weber, 1969). This technique works by mixing the fluorescence signal, at the detector PMT base or an external mixer, with a second signal of different frequency (i.e., frequency heterodyning). The resulting difference frequency contains the same information as the original high-frequency signal, but the difference can be set to any suitable lower value to suit the measurement conditions, for example, signal processing (digital) speed. In addition, the frequency-heterodyning signalprocessing method can be used with either singleor multifrequency excitation schemes, such as a mode-locked laser pulse train (Alcala et al., 1985; Lakowicz et al., 1986). Modern multifrequency lifetime spectrofluorometers utilize pulsed excitation sources, coupled with frequency heterodyne methods, to measure excited-state lifetimes in bulk solutions (Mitchell and Swift, 1989).
The analog electronics commonly found in static and flow frequency-domain measurement instruments are limited to collecting only one frequency at a time. As the
Materials and Methods |
183 |
signal processing becomes increasingly complex (multifrequencies), these electronics are a source of errors. By replacing the analog processing electronics with a com- puter-controlled digital processing and acquisition system (Feddersen et al., 1989), multifrequency phase/modulation lifetime data are processed by software. This digital acquisition technology is not a simple substitution of analog processing, but it provides a new approach and capabilities for measuring multiple excited-state lifetimes by frequency-domain methods.
Instrumentation
A Spectra Physics model 2025 5W argon laser (Spectra Physics, Mountain View, CA) serves as the excitation source and the modulator is a model 350 KDP dc-50 MHz bandwidth unit (Conoptics, Danbury, CT) (see Fig. 8.3) in the single-frequency, fluorescence lifetime flow cytometer, which has been described in detail (Steinkamp et al., 1993). A model 3335A RF signal synthesizer (Hewlett Packard, Palo Alto, CA) is used as the sine wave generator for the modulator drive electronics and as the reference frequency source for the homodyne signal. The laser beam is focused by crossed cylindrical lenses onto the cell stream in a Coulter Biosense flow chamber. The twocolor fluorescence detector is a modified version of a multicolor unit (Steinkamp et al., 1987). An f/0.95 [0.53 numerical aperture (NA)] lens collects and collimates the modulated fluorescence emission to a second lens that focuses the emitted light onto a pinhole spatial filter located in front of a PMT. A Burle Industries model 4526 PMT/Comlinear model 401 high-speed operational amplifier configured in the transimpedance mode serves as the photodetector.
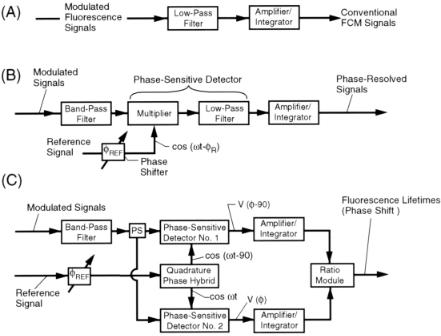
Forward-scattered light from cells is focused by a lens onto the photocathode of a PMT detector (see Fig. 8.3). The light-scatter signals are demodulated using a low-pass electronic filter set at 180 kHz (bandwidth) to obtain the cw-excited laser excitation light-scatter signal. The conventional cw-excited fluorescence signals are obtained by using a low-pass electronic filter set at 180 kHz, followed by an amplifier/integrator or logarithmic amplifier (see Fig. 8.4A). The phase-sensitive detection electronics (singlechannel) consist of a band-pass electrical filter having a center frequency corresponding to the laser modulation frequency ( ), a passive phase detector (multiplier), and a low-pass electronic filter set at 180 kHz (see Fig. 8.4B). Switchable delay lines are used to shift the phase of the reference signal with respect to the modulated fluorescence signals. The PSD output signals are amplified or integrated. Logarithmic amplifiers may also be employed to amplify phase-resolved fluorescence signals. The two-phase ratio detector for making fluorescence lifetime measurements is shown in Figure 8.4C. A signal splitter is used to divide the fluorescence detector output signal to two PSD circuits. A 2–32-MHz quadrature phase hybrid module supplies two reference signals which are 90° out of phase with each other to the PSD circuits for generating outputs
v( –90) (t) and v( ) (t), the ratio that is directly proportional to the lifetime. The conventional light scatter and fluorescence, phase-resolved fluorescence, and lifetime signals
are recorded as listmode data for display as frequency distribution histograms or as bivariate dot and contour diagrams using our LACEL computer-based data acquisition system (Hiebert et al., 1981). This system recently has been replaced by DiDAC, a new generation data acquisition system (Buican et al., 1991; Parson et al., 1993).

184 |
Fluorescence Lifetime Flow Cytometry |
The longest lifetime that can presently be used in phase-resolved fluorescence measurements depends on the lowest usable excitation frequency, which is about 0.5 MHz. This corresponds to a 318-ns lifetime (45° phase shift). For lower modulation frequencies, the cw-excited, low-frequency signal component interferes with the 0.5- MHz high-frequency signal. The shortest lifetime depends on the maximum usable excitation frequency, which is about 35 MHz (bandwidth of the switchable delay lines) and corresponds to 0.5–1.0 ns. The longest and shortest measurable lifetimes depend on the usable frequency range of the phase comparators. Presently, the limiting component is the 2–32-MHz quadrature phase hybrid module. Higher frequency models are commercially available.
Cell Preparation, Staining, and Lifetime Measurement Procedure
Cultured human lung fibroblasts (HLFs) (primary cell line HFL-1; ATCC, Manassas, VA) were harvested before confluence from tissue culture flasks, washed in phos- phate-buffered saline (PBS), and fixed in absolute methanol, absolute ethanol, 1.0% formaldehyde, 1.0% paraformaldehyde, and 0.1% glutaraldehyde for analysis of autofluorescence lifetime using 488-nm laser excitation, a 29-MHz modulation frequency, and a Schott OG515 long-pass (Melles Griot; Irvine, CA)/530 band-pass (Omega Optical, Brattleboro, VT) filter combination in the fluorescence detector. Viable (unfixed) HLFs (controls) were also analyzed under the same conditions. Murine thymocytes were obtained from deeply anesthetized C3H/HEJ mice after intraperitoneal injection of pentobarbital followed by excision of the thymus. Each thymus was washed in PBS; the thymuses were pooled and minced into small pieces and passed (syringed) 4–5 times through an 18-gauge needle to disperse cells. Pooled samples were then filtered through a 100- m nylon mesh filter to remove large debris and clumps. The cells were centrifuged and the pellet was suspended in 1.0% bovine serum albumin (BSA), washed in PBS, and resuspended in 50 l of BSA for antibody labeling.
F i g . 8.3. System block diagram of the fluorescence lifetime flow cytometer illustrating the laser, modulator/drive electronics, beam splitter, laser monitor, flow chamber, forward light scatter and fluorescence detectors, synthesized sine wave signal generator, and signal detection/processing electronics.
Materials and Methods |
185 |
F i g . 8.4. Block diagram of the signal-processing electronics for obtaining conventional FCM signals by low-pass filtering (A); phase-resolved signals by phase-sensitive detection (B); and fluorescence lifetimes by the two-phase ratio method (C).
Murine thymus cells were labeled with anti-mouse Thy 1.2 antibody [anti( )Thy 1.2] directly conjugated to FITC (FITC– Thy 1.2); PE (PE– Thy 1.2); Red 613, a PE/Texas Red tandem conjugate (Glazer and Stryer, 1983) (Red 613Thy 1.2) (Gibco BRL, Grand Island, NY); and Quantum Red, a PE/Cy 5 tandem conjugate (Quantum RedThy 1.2) (Sigma Chemical, St. Louis, MO) and incubated for 30 min on ice. The labeled thymus cells were centrifuged, washed in PBS containing 1.0% BSA, and resuspended in PBS for flow analysis using 488-nm laser excitation and a 29-MHz modulation frequency. An OG515 filter was used to measure FITCand PE-labeled antibodies, and Schott RG610 and RG645 long-pass filters (Melles Griot, Irvine, CA) were used to measure Red 613– and Quantum Red–labeled antibodies, respectively. Fluorescence quenching of FITC– Thy 1.2 antibody labeling of murine thymus cells at F/P [fluorescence-to-protein (antibody)] ratios of 4.5, 8.7, and 13.7 (Pharmingen, San Diego, CA) was demonstrated with murine thymocytes labeled at an FITC– Thy 1.2 antibody dilution of 1 : 100 using 488-nm laser excitation, a 29-MHz modulation frequency, and an OG515/530 filter. Thymocytes were also labeled with FITC– Thy 1.2 antibody (4.5 F/P ratio) at a 1 : 1000 dilution.
Chinese hamster cells (line CHO; ATCC, Manassas, VA) maintained in exponential growth in suspension culture were harvested, fixed in 70% ethanol (1 h), and centrifuged, and the ethanol was removed by aspiration prior to staining with DNA-
186 Fluorescence Lifetime Flow Cytometry
binding fluorochromes. Ethanol-fixed CHO cells were stained with Hoechst 33342
(0.5 |
g/ml; Calbiochem, La Jolla, CA), 4',6-diamidino-2-phenylindole (DAPI) |
(1.0 |
g/ml; Molecular Probes, Eugene, OR), mithramycin (50.0 g/ml; Pfizer Lab- |
oratories, Groton, CT) and 7-amino actinomycin D (7-AAD) (12.7 g/ml; Molecular Probes). Hoechstand DAPI-stained cells were analyzed using UV laser excitation, a 29-MHz modulation frequency, and a Schott GG400 long-pass filter. Mithramycinand 7-AAD-stained cells were analyzed using 457-nm laser excitation, a 29-MHz modulation frequency, and a Schott GG495 long-pass filter and 514nm laser excitation, a 29-MHz modulation frequency, and a Schott OG550 long-pass filter, respectively. Nuclei isolated from CHO cells (Vindelov et al., 1983) were stained with TOTO (5.2 g/ml) and ethidium homodimer II (6.5 g/ml; Molecular Probes) and analyzed using 496-nm laser excitation, a 29-MHz modulation frequency, and an OG515/530 filter combination and 488-nm laser excitation, a 6-MHz modulation frequency, and an OG515 filter, respectively. Fixed CHO cells treated with 50.0 g/ml RNase (Worthington, Freehold, NJ) for 30 min at 37°C were stained with propidium iodide (15.0 g/ml), ethidium monoazide (5.0 g/ml), and ethidium bromide (15.0 g/ml; Molecular Probes). Propidium iodide– and ethidium bromide–stained cells were analyzed using 488-nm laser excitation, a 6-MHz modulation frequency, and an OG515 filter, and ethidium monoazide–stained cells were analyzed using 488-nm laser excitation, a 10-MHz modulation frequency, and an OG515 filter. Chromosomes obtained from line clone Chinese hamster embryo (CCHE) cells [American Type Culture Collection (ATCC), Manassas, VA] growing in culture were prepared and stained with propidium iodide (50.0 g/ml) (Aten et al., 1980) and analyzed using 488-nm laser excitation, a 6-MHz modulation frequency, and an OG515 filter.
In a final set of experiments, mouse thymus cells were labeled with anti-mouse Thy 1.2 antibody [anti( )Thy 1.2] directly conjugated to Red 613 as described above. Sample tube 1 (first control) contained only Red 613– Thy 1.2 labeled thymocytes, sample tube 2 (second control) contained unlabeled thymocytes to which PI was added for a final concentration of 1 g/ml, and sample tube 3 contained Red 613– Thy 1.2–labeled thymocytes to which PI was added for a final concentration of 1 g/ml. All samples were kept on ice prior to analysis by flow cytometry using 488nm laser excitation, a 10-MHz modulation frequency, and an RG610 filter. A fourth sample tube containing Red 613– Thy 1.2–labeled thymocytes and PI (1 g/ml) was placed in a 37°C, 5% CO2 incubator for 6 h prior to flow analysis.
The ability to quantify fluorescence decay times on particles and cells labeled with fluorescent probes by direct phase shift measurement in flow cytometry is illustrated in Figure 8.4C. The outputs of PSDs 1 and 2, that is, sin and cos output, were initialized by removing the long-pass barrier filter in the fluorescence detector, adjusting the reference phase shift ( R) to zero (null), and maximizing the sin and cos outputs, respectively, using nonfluorescent microspheres. The barrier filter was then replaced, and fluorescent-labeled particles of known liftetime (Deka et al., 1994), for example, Flow-Check fluorospheres (Coulter, Miami, FL), lifetime ~7.0 ns, were analyzed at the same PMT and PSD amplifier/integrator gain settings. The ratio module gain was adjusted to position the Flow-Check microspheres, typically in channel
Results |
187 |
70 of the histogram, prior to analyzing labeled cell samples at fixed gain settings. Neutral density filters were used in the fluorescence detector to compensate for differences in light scatter (nonfluorescent particles) and fluorescence (DNA Check microspheres and labeled cells) signal intensities when required to maintain the PMT voltage constant during lifetime measurement.
RESULTS
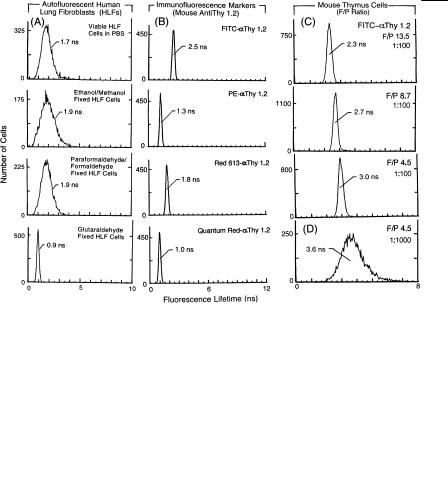
The results of experiments designed to compare the autofluorescence lifetimes of viable and fixed HLFs are shown in Figure 8.5A. The histograms show that the lifetimes of ethanol-, methanol-, paraformaldehyde-, and formaldehyde-fixed HLFs are slightly increased compared to unfixed HLFs, the exception being glutaraldehydefixed HLFs. The problem this presents is that the broadened lifetime histogram coefficients of variation (CVs) of viable and ethanol-, methanol-, paraformalde- hyde-, and formaldehyde-fixed fixed cells partially overlap the lifetimes of the FITC-labeled antibody probe, thus making phase-resolved measurements based on lifetime differences difficult to accomplish. To alleviate this problem, we have de-
F i g . 8.5. Fluorescence lifetime frequency distribution histograms recorded on cultured viable human lung fibroblasts (HLFs), ethanol/methanol-fixed HLFs, paraformaldehyde/formaldehyde-fixed HLFs, and glutaraldehyde-fixed HLFs (A) and on murine thymus cells labeled with anti( )Thy 1.2 antibody conjugated to FITC, PE, Red 613, and Quantum Red (B), FITC– Thy 1.2 having F/P ratios 13.5, 8.7, and 4.5 (all at 1 : 100 antibody dilution) (C), and FITC– Thy 1.2 having an F/P ratio of 4.5 (1 : 1000 antibody dilution)
(D). Since the individually measured lifetime distributions for ethanol and methanol (and paraformaldehyde and formaldehyde) were identical, only one of the histograms for each pair is shown in (A).
188 |
Fluorescence Lifetime Flow Cytometry |
veloped an approach in which low-concentration glutaraldehyde is used as the primary cell fixative for cell surface immunofluorescence measurements (Steinkamp et al., 1999b). When compared to viable HLFs and HLFs fixed in the other fixatives, the fluorescence lifetime is considerably shorter, and the histogram CV is smaller. We have also measured the lifetimes of FITC-labeled microspheres (simulated FITC-labeled antibody fluorescence) having fluorescence intensities similar to the glutaraldehyde-fixed HLF cells and determined that the lifetime histogram does not overlap the simulated FITC probe histogram (data not shown). The use of glutaraldehyde as a fixative to lower the lifetime of autofluorescent cells may facilitate the detection of FITC-labeled cell surface fluorescence by phase-resolved fluorescence emission measurements.
The measurement of fluorescence lifetimes on murine thymus cell surface markers labeled with FITC, PE, Red 613, and Quantum Red conjugated to anti( )–Thy 1.2 antibody is illustrated in Figure 8.5B. The modal channel values of the lifetime histograms are less than the expected values listed in Table 1 (antibody solution measurements). Since these data suggest fluorescence quenching, studies using microspheres labeled with varying numbers of FITC molecules were performed
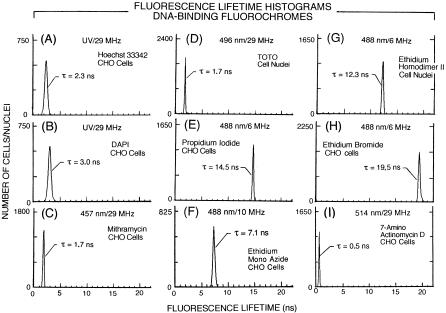
F i g . 8.6. Fluorescence lifetime frequency distribution histograms recorded on CHO cells and isolated CHO cell nuclei that were stained with DNA-binding fluorochromes: Hoechst 33342 (A), DAPI (B), mithramycin (C), TOTO (D), propidium iodide (E), ethidium mono azide (F), ethidium homodimer II (G), ethidium bromide (H), and 7-amino actinomycin D (I).

Results |
189 |
F i g . 8.7. Fluorescence intensity (amplified/integrated) frequency distribution histogram recorded on PIstained chromosomes obtained from line CCHE cells (A) and corresponding bivariate contour diagram of mVs.sin φ and mVs.cos φ fluorescence signal intensities (B) and fluorescence lifetime histogram (C).
(Steinkamp et al., 1996). Lifetime values ranged from 2.0 to 3.8 ns, thus illustrating the self-quenching of FITC bound to microspheres. To demonstrate the FITC self-quench- ing phenomenon as a function of antibody labeling dilution and F/P ratio, fluorescence lifetime histograms were recorded on murine thymus cells labeled with FITC– Thy 1.2 having F/P ratios of 13.7 (maximum quenching), 8.7, and 4.5 (minimum quenching) (Deka et al., 1996) (see Fig. 8.5C). In Figure 8.5D the FITC– Thy 1.2 (F/P 4.5) antibody was diluted by 1 : 1000. The lifetime distribution peak modal value increased to 3.6 ns and was in close agreement with the value listed in Table 1, but with a broader CV due to lower fluorescence intensity (photon measurement statistics).
Figure 8.6 shows the fluorescence lifetime histograms measured on fluorochromes having DNA labeling specificity. The modal channel lifetime values of the histograms recorded for Hoechst 33342 and DAPI (A–T base pair specificity) and mithramycin (G–C base pair specificity) were slightly shorter (see Figs. 8.6A–C) than the reported values listed in Table 1. The lifetime histogram for TOTO (high-sen- sitivity dimer of thiazole orange) is shown in Figure 8.6D. TOTO is thought to intercalate into DNA without base-pair specificity. The modal channel value of 1.7 ns is the same as the lifetime value previously reported by time-resolved solution measurements (Castro et al., 1993). The lifetime histograms for the propidium iodide, ethidium monoazide, ethidium homodimer II, and ethidium bromide DNA–interca- lating fluorochromes, which lack base-pair specificity, are shown in Figures 8.6E–H. Ethidium homodimer II is thought to exhibit A–T base-pair labeling preference. Figure 8.6I shows the lifetime histogram measured for 7-AAD-labeled cells having G–C base-pair preference. The lifetime values measured for propidium iodide, ethidium bromide, and 7-AAD are essentially the same as those given in Table 1. These data illustrate the capability to precisely measure lifetimes of DNA-binding probes and will serve as the basis for resolving fluorescent marker emissions that are to be quantified in combination with these fluorochromes. Sailer et al. have further characterized the fluorescence intensities and lifetimes of DNA-binding fluorochromes for labeling normal and apoptotic cells (Sailer et al., 1996, 1997a, 1998a, 1998b).
190 |
Fluorescence Lifetime Flow Cytometry |
The ability to simultaneously measure fluorescence intensity and lifetime on PIlabeled chromosomes (from line CCHE cells) is illustrated in Figure 8.7. The flow karyotype fluorescence intensity histogram is shown in Figure 8.7A. Excellent measurement resolution was achieved with each chromosome peak defined. In Figure 8.7B, mVmsin and mVmcos [corresponding to V( – 90) and V( ) of Fig. 8.4C] are plotted in bivariate form to show the lifetime measurement linearity. The slope of this line is equal to tan , which is directly proportional to the lifetime, and the corresponding lifetime distribution is unimodal (see Fig. 8.7C). These data demonstrate the measurement precision of the technology and will serve as the basis for future studies involving human chromosomes.
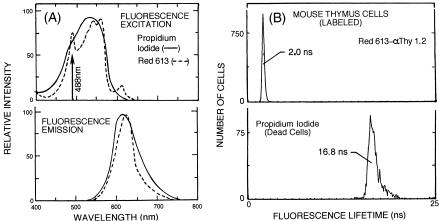
An example illustrating phase-resolved measurements on murine thymus cells labeled with Red 613– Thy 1.2 and stained with PI (“dead cells”) (Stöhr and VogtSchaden, 1980) using two PSD channels operating in parallel (Steinkamp and Crissman, 1993) is shown below. Since the emission spectra of Red 613 and PI overlap (see Fig. 8.8A), the separation of Red 613 and PI signals cannot be achieved using conventional methods employing electronic compensation (Loken et al., 1977). Also, the PI labeling intensity is 42.5 times greater than the Red 613– Thy 1.2 fluorescence. The measured fluorescence lifetime histograms of Red 613 and PI individually labeled murine thymus cells are well separated (see Fig. 8.8B). Based on the lifetimes of Red 613 (2.0 ns) and PI (16.8 ns), murine thymus cells were labeled separately with Red 613– Thy 1.2 and PI (controls), and the phase shifts of the two phasesensitive detector channels (see Fig. 8.9A) were adjusted to (1) null Red 613 signals in the PSD channel 2 output and (2) null PI signals in the PSD channel 1 output, as illustrated in Figure 8.9B. Thymus cells labeled with both Red 613– Thy 1.2 and PI
F i g . 8.8. Fluorescence excitation and emission spectra of PI and Red 613 (A) and fluorescence lifetime histograms recorded on unfixed murine thymus cells labeled separately with Red 613– Thy 1.2 and PI (“dead cells”) (B).