

Emerging Tools for Single-Cell Analysis
.pdfCritical Aspects of the System |
129 |
ture (in an opaque container) for several months with little degradation. An undesirable characteristic of these dyes is that they are not optimal under saturating conditions, although a dye–DNA ratio of 1 : 5–1 : 10 is optimal for flow analysis. But if the amount of DNA to be stained is not accurately known it is very easy to get suboptimal staining. This aspect alone requires that internal staining (size) standards be included along with an unknown fragment whose size is being determined. The order of reagent mixing is also important (for reasons that are not entirely clear), and the best results are produced when DNA is added to the dispersed dye solution (Glazer and Rye 1992). It is also possible to obtain good results by adding considerably diluted dye to a dispersed DNA solution (data not shown).
As with other bis-intercalating dyes, each molecule of POPO-3 intercalated unwinds the DNA helix by 60° (Spielmann et al., 1995) and each intercalator doubles the inter-base-pair spacing (Glazer and Rye 1992). This has a profound effect on the physical length of various sized DNA fragments at the dye–DNA ratio of 1 : 5 (see Table 6.1 below) which ties in with unique observations of the burst waveform made with this instrument, to be discussed under Results. We often see a gradual decline in the event rate for lambda DNA (or larger fragments), as a sample is being analyzed; at times, larger fragments seem to get stuck in the capillary. Attempts to coat the inner surface of the capillary so as to repel DNA molecules have been only marginally successful.
Sample Delivery and Flow Rate
It is necessary to set the concentration of fragments to the range where it is possible to regulate the sample event rate; in the current system, 10–10–10–12 M is about optimal. More dilute samples can be utilized, but it takes longer to collect a reasonable amount of data. If the sample volumetric flow rate is increased too much, the coefficient of variation (CV) of the measurement increases. Increasing the sample concentration can increase the speed of data accumulation, but then it becomes difficult to avoid excessive coincidence. A delicate balance must be maintained between the long transit time (1–10 ms) through the laser beam and the sample concentration or event rate.
In operation, only a fraction of a microliter is actually analyzed. This is another advantage of using such small-bore tubing to deliver the sample to the point of analysis. The volume of a 30-cm length of 40-µm-ID tubing is 0.38 µl. If it were possible to conveniently handle 1 µl samples, this instrument could analyze 104–105 DNA frag-
T A B L E 6.1. Physical Length of Stained and Unstained DNA Fragments
Fragment |
Size (kbp) |
Physical length (µm) |
Stained length (µm) |
|
|
|
|
Lambda/Kpn1 |
1.5 |
0.51 |
0.71 |
Lambda/Kpn1 |
17.0 |
5.8 |
8.1 |
Lambda/Kpn1 |
30.0 |
10.2 |
14.3 |
Lambda |
48.5 |
16.5 |
23.1 |
T5 |
110.0 |
37.4 |
52.4 |
|
|
|
|
130 |
Single DNA Fragment Detection by Flow Cytometry |
ments and still have more than 90% of the microliter left; if 104 fragments are analyzed (at 10–12 M), only about 30 nl of the DNA sample will be consumed.
Resolving the fragment populations present in a sample of HindIII-digested lambda DNA is relatively easy—all the child fragments are equally represented. Each initial lambda molecule yields one, and only one, member of each of the fragment classes (125, 564, 2027, 2322, 4361, 6557, 9416, 23130 bp) if the digestion is complete. (The 125 bp is not visible and the 2027and 2333-bp fragments are not separately resolved.) However, it can be very difficult to cleanly resolve a relatively rare, large fragment within an abundance of small fragments such as from the host bacterium in a plasmid preparation with a high background of genomic DNA fragments. These situations demand careful and deliberate sample preparation.
Detector
The EG&G APD detector has a significant advantage over a photon-counting PMT simply because it has a much higher quantum efficiency, >60% (at 633 nm) as opposed to 10–20% for the PMT. However, due to the longer deadtime (40 ns vs. <1 ns), the APD has a lower maximum count rate than a PMT and hence a smaller useful dynamic range. The APD may also be more sensitive to damage by high light levels; in the specification sheet EG&G states that if more than 106 photons impinge on the diode in 1 µs, it probably will be destroyed! In routine operation we prefer to keep the average count rate below 500 kHz, but it is the instantaneous count rate that must be constrained, as far as the APD is concerned. Also, the APD cannot differentiate between one photon and multiple photons which might arrive simultaneously. Overall, the APD-based system is more sensitive but a PMT can inherently handle higher fluorescence intensities. However, features of the fluidics and optical geometry of the MiniSizer, coupled with the way DNA molecules behave in flow, somewhat negate the smaller dynamic range of the APD. This will be fully discussed further on. The APD module is expensive ( $4000) but it is a very small, self-contained unit that requires only +5 V at 3 A. It counts individual photons of light at significantly greater than 10 MHz, with better than 60% detection efficiency, enabling the system to detect single phycoerythrin molecules in solution or pieces of DNA molecules as small as 245 bp up to at least as large as 177 kbp (data not shown).
Detection Volume
An essential aspect of this type of instrument is to reduce the detection volume—the portion of the sample stream that is actually interrogated by the optical system. A convolution of the laser beam dimensions and the field of view of the collection lens (including any spatial filters) define this. A picoliter occupies a volume equal to 1000 µm3 (10 × 10 × 10 µm). In the current system, the sample stream is about 1 µm in diameter. Therefore, the volume of fluid from which fluorescence is optimally collected is approximately 0.01 pl. As a frame of reference, with free dye molecules at 1 µM, this volume would still contain 104 molecules.

Results and Discussion |
131 |
The efficiency of the dye, combined with the high NA of the fluorescence collection lens and the sensitivity of the detector, results in relatively strong signals. In an early configuration of this instrument, an adjustable slit (Oriel, Stratford, CT; www.oriel.com) was placed at the focal point of the objective in order to constrain the light reaching the detector to that originating from the sample stream. In the MiniSizer, the 200-µm-diameter active region of the APD itself, placed at the focal point of the objective, serves as the system aperture. This results in a simpler system with two fewer parts, eliminating the adjustable slit and a second microscope objective (to refocus the diverging light passing through the slit onto the active area of the APD). This approach appears to be at least as sensitive as the original configuration, and the dynamic range and linearity of the system are unaffected (data not shown).
RESULTS AND DISCUSSION
Using the best available nucleic acid stains, it is possible to stain a small sample of DNA in about an hour and thereafter, within minutes, to have a histogram of analyzed fragment sizes. In a series of experiments, the flow-based measurement has very good linearity over a large size range (245 bp to nearly 400 kbp) and there is direct enumeration of discrete populations of fragments. Unlike gel electrophoresis, the resolution of fragment size in the molecular flow analyzer improves with increasing size.
Small Fragment Sizing
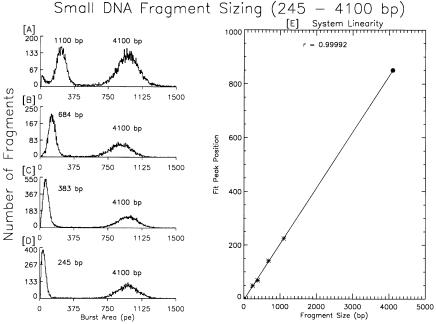
The application of flow “cytometry” to measure the size of individual DNA fragments in solution is unique in that there are precisely known standards that can be used to calibrate the machine and its performance. A molecule of lambda DNA has exactly 48,502 bp (strain c1857 ind 1 Sam 7, Promega). Also, the sizes of the fragments that result from restriction enzyme digestion of lambda DNA are known exactly. Therefore, we know what a properly prepared sample of that DNA should look like, and, if such a sample produces the correct distribution, we can have confidence in the instrument when we use it to analyze an unknown sample of DNA. Unfortunately, POPO-3 fluorescence is optimal within a narrow range of dye–DNA ratios, and this can be elusive when the mass of DNA in the sample being analyzed is not known within a factor of 10. This limitation can be overcome by the use of internal staining standards, just as known size standards are run in adjacent lanes of electrophoresis gels. In Figure 6.7, four small DNA fragments are analyzed along with a 4.1-kbp standard. This graph illustrates the performance of the system at the instrument’s detection limit. The 245-bp fragment has only about 50 POPO-3 molecules intercalated. If the four fragments were mixed together prior to analysis, they would not be individually resolved. The minimum resolvable size difference (in one batch of fragments) is about 1.5 kbp as can be seen in Figure 6.6 with the HindIII digest of lambda DNA. However, with internal staining standards, the sizing accuracy of the system is affirmed and its response is clearly linear.
132 |
Single DNA Fragment Detection by Flow Cytometry |
Fig. 6.7. Small DNA fragment sizing. Four different fragments were individually mixed with a 4100-bp standard (A–D) and analyzed. The 245-bp fragment (D) is at about the detection limit of the current system. With a dye–DNA (bp) ratio of 1 : 5 there are approximately 50 dye molecules bound to the smallest fragment. Nevertheless the linearity of the system is excellent all the way down to the detection limit. The position of the 4100-bp standard and 0 defined the limits of the fit. The small fragments were purified from electrophoretic gels following restriction enzyme digestion.
Burst Outline Analysis
Figure 6.8 illustrates two interesting points condensed from analyzing the same sample of Kpn1-digested lambda DNA at three different dwell time settings, 16, 25, and 50 µs. First, it can be seen that there is enhanced resolution of the three fragments (produced by this digestion: 1.5, 17.0, 30.0 kbp) in the burst duration graph at 25 and 16 µs dwell times. There is a threshold effect, particularly on the smaller fragments, but there is a real difference in the burst duration as the fragment size increases. Second, up to a certain size ( 22 kbp, Figs. 6.2 and 6.8) as the burst height increases, so does the burst area. Beyond that point, the burst height remains constant but the burst duration increases so that the integrated burst area continues to increase (Fig. 6.8B, middle left-hand graph). This is consistent with the dye molecules being intercalated relatively uniformly along the length of the fragment and the physical length of the 30-kbp fragment being stretched out in flow larger than the laser beam’s vertical dimension (11 µm high). Therefore, until the laser beam is entirely filled by a fragment of sufficient length, the burst height increases as the fragment size increases. When the length of a fragment oriented in flow is greater than

Results and Discussion |
133 |
Fig. 6.8. Dwell time effect on burst height and duration histograms. This figure illustrates the effect of the MCS dwell time on the burst height and duration using a Kpn1-digested sample of lambda DNA containing three fragments: 1.5, 17, and 30 kbp. Decreasing the dwell time from 50 to 25 µs results in a dramatic change in the burst duration histogram, whereas a dwell time of 16 µs does not make much more difference. Changes in the burst height at different dwell times are due simply to the fact that fewer photons are detected in shorter time intervals. The integrated burst area histogram is unaffected by these dwell time changes.
the height of the laser beam, the burst height plateaus at the maximum value (because the entire beam height is filled) while the burst duration extends in proportion to the total fragment length. The burst height increases beyond this point only if the fragment is not stretched out, kinked, looped, or oriented perpendicular to the flow or if more than one piece of double-stranded DNA is present, so that more dye
134 |
Single DNA Fragment Detection by Flow Cytometry |
molecules are in the laser beam simultaneously. If a portion of the fragment is not double stranded, that region will have fewer dye molecules along its length and the burst height will be proportionately lower. Although both the fragment size (up to about 22 kbp) and the dwell time of the MCS card (fewer photons are counted in smaller time intervals) affect the burst height, the burst area distribution is unaffected; hence only one histogram is drawn in the upper left graph in Figure 6.8A.
DNA Extension in Flow
Intact unstained lambda DNA can be physically stretched to more than 15 µm in length (Kornberg and Baker, 1992). Furthermore, DNA molecules are easily stretched out by fluid forces in flow (Perkins et al., 1994). A reasonable approximation of the physical length of a piece of DNA can be calculated by the equation
Physical length (µm) = (0.34 µm/kbp) × (fragment size in kbp) |
(6.3) |
When DNA is stained with an intercalating dye—POPO-3 is a bis-intercalating dimer—the inter-base-pair spacing doubles [from 0.34 to 0.68 nm (Glazer and Rye, 1992)] where each dye molecule is inserted. With the dye–DNA ratio of 1 : 5 there is one dimer for every 5 bp and, therefore, a 40% maximum occupancy of available slots (it is possible to have both legs intercalated with one dye molecule for every 4 bp):
40% occupancy (1 dye dimer for 5 bp) |
0.4 × 0.68 |
= 0.272 |
Therefore 60% of the spaces are 0.34 nm |
0.6 × 0.34 |
= 0.204 |
|
0.272 + 0.204 |
= 0.476 |
Here, 0.476 × size (in kbp) gives the stained length (in micrometers), as indicated in Table 6.1.
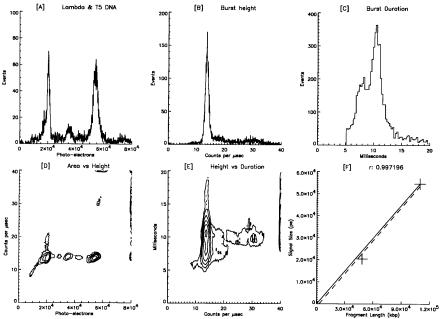
From Table 6.1 it can be seen that the physical length of the stained 30-kbp Kpn1 fragment is longer than the vertical dimension of the laser beam spot size (11 µm high), while the 17-kbp fragment is not. Therefore, the fragment length that would give the maximum burst height (just long enough to entirely fill the laser beam) is about 22 kbp. The effect of the molecules stretching out in flow means that the APD detector has to contend with a smaller dynamic range of signal intensities than it would if the DNA remained tightly condensed in a globular form. As a result, the APD’s enhanced sensitivity, compared to a PMT, is a real bonus, and its smaller dynamic range is not as detrimental as it might otherwise be. Also, this is why the deadtime correction is based on count rate, not on burst area. Figure 6.9 clearly illustrates this point with the measurement of a mixture of lambda and T5 DNA. At about 110 kbp, the T5 coliphage DNA is also a double-stranded linear molecule like lambda. It appears that there is only one distinct population in the burst height distribution (panel B), whereas the burst area histogram (panel A) shows both DNA molecules being equally represented. In panel D, the contour plot of burst area versus burst height, the burst height distribution levels off at about 20,000 pe (the lambda peak),
Results and Discussion |
135 |
Fig. 6.9. Large DNA fragment analysis. Various graphs of the analysis of a mixed sample of lambda (48.5 kbp) and T5 bacteriophage DNA (110 kbp) using 2.5 mW of laser power and 250 µs dwell time, diluted 1:20 in 1X TE just prior to analysis. The plateau in burst height is very apparent in graph (D). Because the burst height is the same for both fragments (B), the burst duration must increase in order for T5 DNA to register as larger than lambda DNA. The increase in burst duration with constant burst height is clearly seen in (E). Some aggregation and coincident events appear in the burst height histogram. The source of the small peak at 3.5 × 10⁴ pe in (A) is unknown.
but the burst area continues increasing out to 55,000 pe for the T5 peak. Two populations are visible in the burst duration histogram with the lambda peak at 7 ms and the T5 at almost 11 ms. It is worth postulating that circular, double-stranded DNA (with two double strands in the laser beam simultaneously) should give twice the burst height, compared to linear double-stranded molecules. This has been observed in preliminary experiments.
Future Directions
With the DNA molecule extended in flow, resulting in signals stretched out in time, there is effectively some scanning resolution along the length of the molecule. The current configuration of the instrument is designed to accommodate a second APD detector on the thick side of the flow cell, although a longer-working-distance objective will be required. Just as in conventional cytometry, two-parameter analysis is much more useful and powerful than single-parameter analysis. For example, the second APD will permit detection of a sequence-specific hybridization probe using a second fluorescent dye. Temporal location of the second signal, with respect to the size mea-

136 |
Single DNA Fragment Detection by Flow Cytometry |
surement signal, will give low-resolution mapping of the specific sequence along the length of the fragment. A new data collection system that can process the correlated count rate history from two photon-counting detectors has recently been completed. This system will process the raw data in real time, monitor the background level, and produce the primary data directly: burst height, width, and area. As a result, the pho- ton-counting system will behave like a conventional cytometer that produces eventbased data and a standard listmode data file. Furthermore, this system has a conventional light-scatter channel for use in experiments (on particles large enough to scatter light) where the highest possible fluorescence sensitivity is required.
This type of flow-based instrument, a multiparameter molecular analyzer with photon-counting sensitivity, promises to open up entirely new areas of individual, submicroscopic “particle” analysis. The intense interest in every aspect of the structure and function of DNA has driven the development of exquisitely selective and sensitive DNA binding dyes. This has been facilitated by the polymer nature of DNA and intercalating dye molecules that yield fluorescence signals proportional to the length of the DNA fragment.
As new and better fluorescent probes are developed for other biologically important molecules, and as this type of instrumentation becomes more widely available, it will be possible to study a vast range of molecular properties and interactions. This technology should be extensible to the study of protein assembly and folding and of protein–protein interactions using fluorescence energy transfer probes or other highsensitivity probes directly at the level of the individual molecule. It should be possible to study individual receptor–ligand interactions and individual messenger RNA molecules. Furthermore, the very high sensitivity of the system will facilitate the analysis in flow of subcellular components and organelles, such as lysosomes or Golgi vesicles, and mitochondria. DNA fragment sizing is merely the first clearly demonstrated application of this new instrumentation. This technology opens the gateway to a whole new universe of flow-based analytical possibilities.
ACKNOWLEDGMENT
This work was supported by the Department of Energy (NN20) and by the National Institutes of Health–funded National Flow Cytometry Resource (RR-01315).
REFERENCES
Agronskaia A, Florians A, van der Werf K, Schins J, de Grooth B, Greve J (1998): Photon-counting device compatible with conventional flow cytometric data acquisition electronics. Cytometry 32:255–259.
Ambrose WP, Goodwin PM, Jett JH, Johnson ME, Martin JC, Marrone BL, Schecker JA, Wilkerson CW, Keller RA (1993): Application of single molecule detection to DNA sequencing and sizing. Ber Bunsenges Phys Chem 97:1535–1542.
Carlsson C, Jonsson J, Akerman B (1995): Double bonds in DNA gel electrophoresis caused by bis-inter- calating-dyes. Nucl Acids Res 23(13):2413–2420.
References |
137 |
Glazer AN, Rye HS (1992): Stable dye-DNA intercalation complex as reagents for high sensitivity fluorescence detection. Nature 359:859–861.
Goodwin PM, Cai H, Jett JH, Ishaug-Riley SL, Machara NP, Semin DJ, Van Orden A, Keller RA (1997): Application of single molecule detection to DNA sequencing. Nucleosides & Nucleotides 16(5 &6):543–550.
Goodwin PM, Ambrose WP, Keller RA (1996): Single-molecule detection in liquids by laser-induced fluorescence. Acc Chem Res 29:607–613.
Goodwin PM, Johnson ME, Martin JC, Ambrose WP, Marrone BL, Jett JH, Keller RA (1993): Rapid sizing of individual fluorescently stained DNA fragments by flow cytometry. Nucl Acids Res 21(4):803–806.
Huang Z, Jett JH, Keller RA (1999): Bacteria genome fingerprinting by flow cytometry. Cytometry 35:169–175.
Huang Z, Petty JT, O’Quinn B, Longmire JT, Brown NC, Jett JH, Keller RA (1996): Large DNA fragment sizing by flow cytometry: application to the characterization of P1 artificial chromosome (PAC) clones. Nucl Acids Res 24:4202–4209.
Johnson ME, Goodwin PM, Ambrose WP, Martin JC, Marrone BL, Jett JH, Keller RA (1993): Sizing of DNA fragments by flow cytometry. Proc SPIE 1895:69.
Keller RA, Ambrose PA, Goodwin PM, Jett JH, Martin JC, Wu M (1996): Single molecule fluorescence analysis in solution. Appl Spectros 50:12A–32A.
Kornberg A, Baker T (1992): DNA Replication, 2nd ed. New York: W.H. Freeman.
Li LQ, Davis LM (1993): Single photon avalanche diode for single molecule detection. Rev Sci Instrum 64(6):1524–1529.
Perkins TT, Quake SR, Smith DE, Chu S (1994): Relaxation of a single DNA molecule observed by optical microscopy. Science 264:822–826.
Petty JT, Johnson ME, Goodwin PM, Martin JC, Jett JH, Keller RA (1995): Characterization of DNA size determination of small fragments by flow cytometry. Anal Chem 67(10):1755–1761.
Rye HS, Yue S, Wemmer DE, Quesada MA, Haugland RP, Mathies RA, Glazer AN (1992): Stable fluorescent complexes of double-stranded DNA with bis-intercalating asymmetric cyanine dyes: Properties and applications. Nucl Acids Res 20(11):2803–2812.
Smith DI, Blattner FR, Davies J (1976): The isolation and partial characterization of a new restriction endonuclease from Providencia stuartii. Nucl Acids Res 3:343–353.
Spielmann HP, Wemmer DE, Jacobsen JP (1995): Solution structure of a DNA complex with the fluorescent bis-intercalator TOTO determined by NMR spectroscopy. Biochemistry 34:8542–8553.
Wu M, Goodwin PM, Ambrose WP, Keller RA (1996): Photochemistry and fluorescence emission dynamics of single molecules in solution: b-phycoerythrin. J Phys Chem 100(43):17406–17409.
Zucker RM, Elstein KH, Gershey EL, Massaro EJ (1990): Increasing sensitivity of the Ortho analytical cytafluorograph by modifying the fluid system. Cytometry 11:848–851.

Emerging Tools for Single-Cell Analysis: Advances in Optical Measurement Technologies
Edited by Gary Durack, J. Paul Robinson Copyright © 2000 Wiley-Liss, Inc.
ISBNs: 0-471-31575-3 (Hardback); 0-471-22484-7 (Electronic)
7
Fluorescence Lifetime Imaging:
New Microscopy Technologies
Weiming Yu, William W. Mantulin, and Enrico Gratton
University of Illinois at Urbana-Champaign, Urbana, Illinois
INTRODUCTION
In recent years there has been remarkable progress in the field of fluorescence microscopy and time-resolved imaging both in the technical aspects and in the variety of applications. Fluorescence spectroscopy is now a mature technique, and one finds its applications in many areas throughout science. During the last decade, there has been growing interest, especially in the biological sciences, in the determination of fluorescence lifetime information directly on living biological specimens. To this end, one naturally needs to expand from classical single-point measurement to simultaneous multiple-point measurement for the formation of an image. This technical expansion raises a new challenge, namely, the ability to acquire images with fluorescence lifetime information within a reasonable time frame and with similar accuracy and precision comparable to that of single-point spectroscopy measurement. This goal is the main scope of this chapter, which will provide an overview of the different techniques used in fluorescence lifetime imaging microscopy (FLIM).
After the atomic age, the space age, and now the information age, it is easy to forget how long ago fluorescence lifetimes had been first experimentally measured, the molecular aspects of fluorescence studied, and the theoretical background formulated. To realize where the future of the field lies and in which direction we would
139