

Emerging Tools for Single-Cell Analysis
.pdf150 |
Fluorescence Lifetime Imaging: New Microscopy Technologies |
light source. To recover the lifetime of every pixel from the whole image, the most computationally efficient method is the fast Fourier transform algorithm:
j=N |
|
|
|
Fsin,i = sin (∆θj,i) Ij,i |
(7.9) |
||
j=1 |
|
|
|
j=N |
|
|
|
Fcox,i = cos (∆θj,i)Ij,i |
(7.10) |
||
j=1 |
|
|
|
DCi = N1 |
j=N |
|
|
j=1 Ij,i |
|
(7.11) |
|
ACi = Fsin,i + Fcos,i |
(7.12) |
||
|
2 |
2 |
|
where Ij,i is the total fluorescence intensity for the ith pixel at the jth phase shift which
has the phase difference ∆θj,i with respect to the zero phase and Fsin,i and Fcos,i are the sine and cosine Fourier components. Respectively, DCi and ACi in Equations (7.11)
and (7.12) are the dc and ac components. From both the modulation factor,
AC
m = i (7.13)
DCi
and the absolute phase shift of the fluorescence signal,
φ = arctan |
Fsin,i |
(7.14) |
|
||
|
Fcos,i |
|
one may retrieve the lifetime value. The zero-phase delay is normally obtained by measuring a scattering sample or samples with known lifetime.
The Instrument
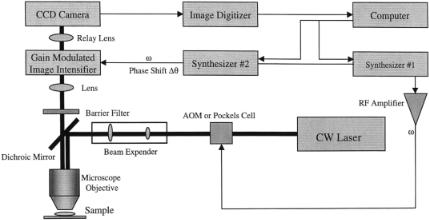
A typical homodyning FLIM setup, which in some ways resembles the time-domain FLIM, is shown in Figure 7.7. The FLIM configuration using the homodyning method can also be adapted for endoscopic imaging with small modifications (Mizeret et al., 1997; Schneider and Clegg, 1997). Due to the nature of the endoscopic measurement, images of laser reflection from the tissue may be used as the reference for the zero-phase correction.
Modulation of the Excitation Light Source. A microscopy imaging system using the homodyning method requires an intensity-modulated excitation source. There are several configurations of modulated source one may choose from, either using a pulsed laser (Lakowicz et al., 1994a; So et al., 1995) or using a continuouswave laser in combination with acoustic-optical or electro-optical modulators
FLIM Using Frequency-Domain Homodyning Method |
151 |
F i g . 7.7. Block diagram of a frequency-domain homodyning FLIM.
(Morgan et al., 1992; So et al., 1994; Clegg et al., 1996). Both configurations allow modulation of the excitation light source to hundreds of megahertz. These are not the components that limit the bandwidth of the whole system. Early systems using direct modulation of the deuterium lamp offered a cheap alternative, but with limited frequency response (Morgan et al., 1992, 1995).
Modulation of the Microchannel Plate Image Intensifier. In the frequency domain, the microchannel plate image intensifier is gain modulated at the appropriate frequency ranges. The gain modulation of the image intensifier can be done through either variation of the acceleration voltage at the photocathode or variation of the actual high voltage across the microchannel plate where the electrons are multiplied. One great advantage of modulation through the photocathode is the possibility of achieving a large dynamic range of the modulation frequency from a few hundred kilohertz to hundreds of megahertz. However, there are several drawbacks of modulating the photocathode. The common problems are iris effect and electronic defocusing. The iris effect is related to the characteristic of the photocathode requiring a certain amount of time to equilibrate after any changes of applied electronic potential. Electronic defocusing occurs when the modulation voltage is going through zero and the electrons at the photocathode diffuse to the nearby channels, causing blurring of the image at the end of the microchannel plate. The iris effect of the cathode will limit the bandwidth of the modulation and will also lead to nonuniform phase shift across the photocathode. To solve these problems caused by the iris effect, it is possible to reduce the impedance of the photocathode by thicker coating of the cathode surface to achieve higher frequency response. The direct modulation of the gain of the microchannel plate eliminates both the iris effect and the defocusing effect and result in greater phase stability. However, it is normally difficult using this method to reach high-frequency modulation and it is typically performed below tens of megahertz, which is still adequate for the measurement of common fluorescence probes with lifetime of a few nanoseconds.

152 |
Fluorescence Lifetime Imaging: New Microscopy Technologies |
Signal Detection. The image formed at the phosphor screen can be refocused onto a CCD camera through a lens or fiber optic coupling and digitized by the image digitizer via a computer for data processing. Typically, for the CCD camera, many research groups preferred the cooled slow-scan system as compared to the normal video-rate camera, for its reduced read-out noise and integration capability (Clegg et al., 1996; Morgan et al., 1992; Marriott et al., 1991).
FLIM USING THE FREQUENCY-DOMAIN HETERODYNING METHOD
Background
Frequency-domain heterodyning is achieved by modulating the excitation light source and the fluorescence detector at different frequencies. The idea of heterodyning is to convert the fluorescence phase shift and demodulation information from the very high frequency to the low cross-correlation frequency ∆ω, which is the frequency difference between the modulation of the excitation and the detector, thereby facilitating data acquisition (Spencer and Weber, 1969). Previously, our group has developed FLIM systems using the heterodyning method (French et al., 1992; So et al., 1995). Other research groups have also developed similar FLIM systems using wide-field illumination (Clegg et al., 1996), as well as confocal laser scanning (Piston et al., 1992).
Using the sinusoidal modulation of the excitation source, the fluorescence has the form F(t) as in Equation (7.6). The fluorescence signal C(t) with cross-correlation modulation at the detector is given by the equation
C(t) = DCC + ACC cos(ωCt – φC)] |
(7.15) |
where φc is a constant phase shift for the instrument, and DCc and ACc are the dc and ac components, respectively, when the detector is modulated at angular frequency ωc. The low-frequency component at the cross-correlation frequency is a new function CC(t) from the product of F(t)C(t) given by
CC(t) = DC0DCC |
AC AC |
(7.16) |
+ 0 C cos(∆ω t – ∆θ) |
||
|
2 |
|
where ∆φ = φc − φ. Practically, the cross-correlation can be achieved by modulating the gain of the photomultiplier tube or the photocathode of the image intensifier at ω + ∆ω. By using a preamplifier with a low-pass filter, we can readily obtain the crosscorrelation signals electronically from the high-frequency signals.
For spectroscopy measurements, one can in principle choose any cross-correlation frequency compatible with the bandwidth of the digitizer. For lifetime imaging, the cross-correlation frequency is determined differently for the scanning configuration and the wide-field illumination configuration. For an intensified CCD camera, used for the wide-field illumination configuration, frequency is determined by the frame rate of the camera. In the case of the laser scanning system, the cross-correlation fre-
FLIM Using the Frequency-Domain Heterodyning Method |
153 |
quency should be chosen as high as possible for the fastest scanning rate under the condition that there are enough photons. For normal scanning microscopy measurement, we typically use a cross-correlation frequency between 10 and 20 kHz.
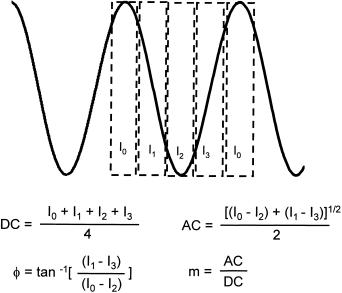
To obtain the phase shift and modulation information, in both scanning and camera systems, we acquire four data points per cross-correlation waveform (Fig. 7.8) and use the fast Fourier transform to analyze the data for its computational efficiency. The mathematical calculation for the ac, dc, phase, and modulation in this case is the same as Equations (7.11) and (7.14) with ∆θj,i=0, . . . , (π/2)·j, j = 1, 2, 3, 4. An approach of three different digital filters is applied in analyzing the raw data to remove any random noise as well as noise at higher harmonics. The first digital filter is the waveform folding, which averages contiguous waveforms at the cross-correlation frequency. The folding of the waveform removes any random noise not at the specific cross-correlation frequency and its harmonics. Using the folding method, the signal- to-noise ratio typically increases linearly with the number of folds (Feddersen et al., 1989). The high-frequency noise is normally reduced electronically through preamplification of the signal. The fast Fourier transform of the in-phase averaged data is effectively a second filter, which separates the signal at the cross-correlation frequency from the noise at higher harmonics. The frame averaging at every pixel is a third filter, which also removes random noise, such as that due to dark counts and photon statistics. The last frame-averaging method is less efficient, compared with the folding, as the increase of the signal-to-noise ratio is only proportional to the square root of the number of averages. In practice, it is possible to perform waveform
F i g . 7.8. Calculation of the DC, AC, φ, and m values by sampling 4 data points per cross-correlation waveform.
154 |
Fluorescence Lifetime Imaging: New Microscopy Technologies |
folding and frame averaging to achieve high lifetime sensitivity, but at the price of slowing down the final data collection rate.
With a fast computer and a fast data acquisition card, it is possible to digitize increased number of points for each waveform. It is conceivable that analyzing more data points will allow us to better discriminate the signal at the cross-correlation frequency against noise, especially the high-frequency noise, and to achieve better phase sensitivity and lifetime measurement accuracy.
Instrumentation
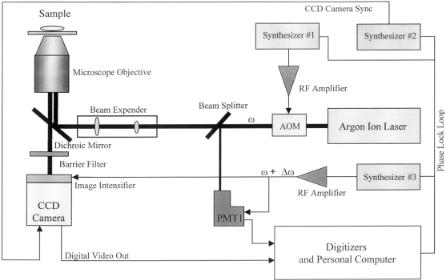
Intensified Camera-Based Microscopy System. Many time-resolved microscopy systems, in both the time domain and frequency domain, adapted the intensified parallel data acquisition using either a CCD camera or a multianode photomultiplier tube (PMT) (Dowling et al., 1998; Hartmann et al., 1997; Mizeret et al., 1997; Clegg et al., 1996; McLoskey et al., 1996; Ni and Melton, 1996; Periasamy et al., 1996; So et al., 1994; Lakowicz et al., 1994a; Oida et al., 1993; Morgan et al., 1992). The image intensifier is a microchannel plate–based system, which can be either gated for time-domain measurements or gain modulated for frequency-domain experiments. The instrument diagram of our time-resolved camera is illustrated in Figure 7.9.
Modulation of the Laser. The cw beam of the argon-ion laser (model 2025, Spectra Physics, Mountain View, CA) is sinusoidally modulated by either an acousticoptical modulator (AOM) or a Pockels cell (ISS, Champaign, IL). The choice
F i g . 7.9. Instrument diagram of a time-resolved fluorescence microscope using gain-modulated image intensifier in the frequency-domain heterodyning mode.
FLIM Using the Frequency-Domain Heterodyning Method |
155 |
between an AOM and a Pockels cell depends on two factors; one is the characteristic of the frequency response of the device and the other is the light throughput. To obtain the same depth of light modulation, the Pockels cell attenuates more light compared to the AOM. On the other hand, the Pockels cell may have a linear frequency response over the full range between 0 and 500 MHz as compared to the AOM, which typically falls in the ranges between 20 and 120 MHz and can be modulated only at certain frequencies determined by the physical dimension of the crystal. The easiest way to achieve high-frequency modulation for the excitation source is to use a short pulsed laser beam, which can have a harmonic content exceeding a gigahertz. We may choose the alternative by using laser systems such as the Nd–YAG laser (Antares, Coherent, Santa Clara, CA)-pumped dye laser (model 700, Coherent) combined with a cavity dumper (model 7220, Coherent) or an argon-ion laser (Innova 300, Coherent)–pumped Ti–sapphire laser (Mira 900, Coherent) combined with a pulse picker (model 9200, Coherent) and a second-harmonic generator (model 5-050, Coherent). The trade-off in such a system is the high cost.
No matter which laser system one uses there will always be intensity jitter and phase instability from either the laser or the modulator. In the case of using the AOM, the phase stability of the laser modulation is strongly dependent upon the thermal stability of the AOM crystal. A water bath capable of maintaining a highly stable temperature is normally required. In order to correct the phase jitter and instability during the experiment, we choose to use a second detector, a gain-modulated photomultiplier tube (R928, Hamamatsu, Bridgewater, NJ), as a reference.
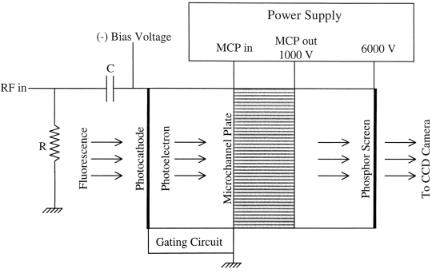
Signal Detection and Data Acquisition System. The central component of the whole system is the gain modulated microchannel plate (Fig. 7.10). The microchannel plate (model V6390U) is custom specified, made by Hamamatsu (Bridgewater, NJ) for its high-frequency response. We can modulate the image intensifier up to 500 MHz, as compared to the normal unit, which dies off at about 200 MHz. The modulation of the image intensifier is achieved via modulating the voltage of the photocathode.
The laser beam after the modulator is then coupled into the microscope (Axiovert 35, Carl Zeiss, Thornwood, NY) using an epi-illumination configuration. The fluorescence passes through a long-pass dichroic mirror and a barrier filter before hitting the photocathode of the image intensifier. After amplification in the microchannel plate, the fluorescence from the sample forms an image at the phosphor screen and can be captured by the CCD camera (model CA-D1-256, Waterloo, Ontario). This CCD camera is capable of frame rates of about 200 Hz that allow up to 50 Hz for cross-correlation. The slow refresh rate of the phosphor screen is effectively a lowpass filter for removing the high-frequency noise.
The digital image at the CCD camera is captured by an image digitizer (MATROX Electronic Systems, Dorval, Quebec) via an 8-bit digital output port on the camera. The fast Fourier transform is performed at every pixel of the whole image based on four data points per cross-correlation waveform. Before transferring the timeresolved image to the main computer, we perform on-board frame averaging to reduce noise. The reference signal from the PMT is acquired via a separate digitizer
156 |
Fluorescence Lifetime Imaging: New Microscopy Technologies |
(A2D-160, DRA Laboratories, Sterling, VA). The whole imaging system is synchronized through either the external clock or the external trigger.
Sequential Laser Scanning-Based Microscopy System. Our time-resolved laser scanning microscope system is based on multiphoton excitation and frequencydomain heterodyning techniques (So et al., 1995). Fluorescence microscopy using two-photon excitation has become popular since the introduction of this technique into microscopy in the early 1990s (Denk et al., 1990) due to its superior background noise rejection and reduction of overall sample photodamage and photobleaching. Two-photon excitation is based on the theory that the chromophore molecule may simultaneously absorb two red photons, each with half the energy required to excite the molecule. The number of photon pairs, n, absorbed by the molecule for each laser pulse has the form
δ |
|
πA2 |
2 |
n ≈ |
E |
(7.17) |
|
t |
hcλ |
|
where δ is the two-photon cross section of the chromophore, t is the pulse width of the laser, E is the energy of each laser pulse, A is the numerical aperture (NA) of the objective, λ is the wavelength of the laser, c is the speed of light, and h is Planck’s constant. We can see that the number n is proportional to the square of the laser energy and to the fourth power of the numerical aperture A. This highly nonlinear relationship means that two-photon excitation appreciably occurs only at the focal
F i g . 7.10. Functional diagram of a gated microchannel plate image intensifier with gain modulation at the photocathode.

FLIM Using the Frequency-Domain Heterodyning Method |
157 |
F i g . 7.11. Time-resolved laser scanning fluorescence microscope instrument diagram using frequencydomain heterodyning.
point of the microscope objective, where the excitation photon density is high. Due to this fact, microscopy using two-photon excitation has an inherent three-dimen- sional sectioning effect; moreover, photodamage of the sample and photobleaching of the chromophore are also localized to the focal point. It is also clear from Equation (7.17) that high efficiency of two-photon excitation can be achieved by using a very short pulse combined with a microscope objective of high numerical aperture. It has been demonstrated that there are significant advantages using two-photon excitation for imaging photosensitive dye–labeled samples (Yu et al., 1996) as well as living cells (French et al., 1997; Yu et al., 1996; Koenig et al., 1996), live embryos (Centonze and White, 1998), and other vital tissue samples (Master et al., 1997; Piston et al., 1995).
Excitation Source and Optics. The configuration of our time-resolved laser scanning microscope is illustrated in Figure 7.11. The Ti–sapphire laser (Mira 900, Coherent) pumped by a 5-W solid-state laser (Verdi, Coherent) produces an 80-MHz pulse train with about 100-fs pulse width. A 4-MHz laser pulse train, obtained by passing the original 80-MHz pulse through a pulse picker (model 9200, Coherent), forms the fundamental laser modulation frequency. It is steered onto the scanner mirrors (Cambridge Technology, Watertown, MA) and then beam expanded before being reflected by the dichroic mirror into an inverted microscope (Axiovert 35, Carl Zeiss). For the objective, we typically use a high-NA oil-immersion objective such as the F-Flura 40x/1.3 or Plan-Apochromats 63x/1.4 from Zeiss. After passing the
158 |
Fluorescence Lifetime Imaging: New Microscopy Technologies |
dichroic mirror and barrier filters, the fluorescence signal is collected by a PMT (R928, Hamamatsu), which is gain modulated at the desired frequencies.
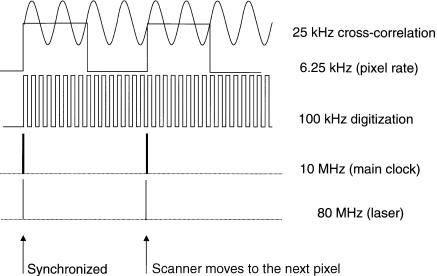
Synchronization of the Instrument and Data Acquisition. On the other hand, the 80-MHz signal output from the photodiode monitor of the Ti–sapphire laser is amplified and divided by a custom made divider box, which generates a 10-MHz transistor–transistor logic (TTL) pulse used as the main clock for the whole instrument. A high-bandwidth frequency synthesizer (HP8341B, Hewlett Packard, Palo Alto, CA) externally referenced to the 10-MHz main clock, produces a signal at the harmonic frequency of the laser fundamental plus a cross-correlation frequency and is then amplified by a high-frequency amplifier (403L ENI, Rochester, NY) for the gain modulation of the PMT. The digitizer (A2D-160, DRA Laboratories) located inside a PC is externally clocked, using the main clock line. The on-board counter uses the external clock to produce the pixel clock, the line clock, and the frame clock that is sent to the scanner controller unit for synchronous laser scanning. An example of the relation among the laser, main clock, digitization rate, cross-correlation frequency, and pixel clock is graphically shown in Figure 7.12. The solid-state laser-pumped Ti–sapphire laser produces a very stable laser pulse and provides a stable clock. The frequency drift of the laser during a typical working day is on the order of 20–40Hz when the laser system is properly tuned. In principle, it is not necessary to use the second detector in this case. The raw data recorded by the digitizer are transferred to the main computer for analysis and retrieval of the lifetime information. The time-resolved images are then displayed on the computer screen. The frame rate of a 256 × 256 pixel image depends on the
F i g . 7.12. Clock map for a 100-kHz single-channel digitizer sampling a 25-kHz signal with 4 times folding. The resulting pixel rate is 160 µs. The 80-MHz laser frequency and the 10-MHz main clock are shown only symbolically.

FLIM Using Optical Mixing Methods |
159 |
cross-correlation frequency and how many folds of the waveform are performed. Under our default condition of 12.5-kHz cross-correlation and two times folding, the imaging frame rate is about 13 s.
FLIM USING OPTICAL MIXING METHODS
Background
Pump–probe is a general terminology for using two laser beams overlapped in space and interacting with the sample molecules. The stimulated emission technique refers to the use of a second laser beam at an emission wavelength to stimulate the emission of a fluorescent molecule from the excited state induced by the first laser beam. The pump–probe technique is well established in laser spectroscopy for studying ultrafast molecular processes and dynamics (Diffey et al., 1998; Vanbrederode et al., 1998; Kumble et al., 1998). The use of stimulated emission for spectroscopy study has also been demonstrated with a simple system (Lakowicz et al., 1994b; Kusha et al., 1994). The capability of using stimulated emission for time-resolved fluorescence imaging has been reported in the literature using both time-domain (Mueller et al., 1995) and frequency-domain (Dong et al., 1995) configurations. We have adapted the fre- quency-domain heterodyning pump–probe technique (Elzinga et al., 1987a,b) for time-resolved microscopy imaging.
The basic idea of the stimulated emission technique is graphically illustrated in Figure 7.13. Two laser beams are required for this technique. The fluorescence molecule is excited by the first laser beam, the pump beam, which is intensity modulated at a given frequency ω. The second laser beam, the probe beam, which is intensity modulated at frequency ω + ∆ω, is tuned within the wavelength of the fluorescence emission to stimulate the decay transition of the molecule from the excited states. One may choose to detect either the stimulated emission or the remaining fluorescence emission. In the epiillumination configuration we used, we chose to detect the isotropic emission of the fluorescence, rather than the stimulated emission. The reasons are threefold. First, the stimulated emission travels collinearly in the direction of the pumping or the probing beam (Sargent et al., 1974) that is not seen directly by the microscope objective. Second, there is strong high-frequency noise and laser interference competing with the stimulated emission signal. Third, equivalent information is contained within either the fluorescence or the stimulated emission, since the system conserves the total number of the excited-state population. The important function of the second probe beam is to modulate the excited state population of the fluorescent molecules. The consequence of beating the two laser beams at different frequencies, asynchronous pump and probe, is the modulation of the intensity of the fluorescence emission at the cross-correlation frequency ∆ω and its harmonics. The modulation depth of the fluorescence signal depends upon the degree of ground-state saturation. It is not necessary to deplete the groundstate population for time-resolved measurements. Therefore, relatively low laser power can be used as compared with spectroscopic studies using stimulated emission (Dong et al., 1995). To obtain the lifetime information, the algorithm of phase delay and modulation factor can be implemented with a simple detection and data acquisition scheme.