

Emerging Tools for Single-Cell Analysis
.pdf108 |
Microfabricated Fluidic Devices for Single-Cell Handling and Analysis |
network using electroosmotic flow. They used the system to demonstrate the ability to obtain information about single-cell reaction rates and the effect of inhibitor drugs on calcium cell influx. It should be noted that pressure-driven flow was utilized because protein adsorption on the channel walls reduced the electroosmotic flow significantly. An inhibitor was combined with the cells at the first intersection
(1). Incubation occurred while the cells slowly moved down the main channel (incubation time of 4 min). An activator was mixed with the cells at the next intersection (2). A fluorescence microscope was positioned over the second intersection (2). By stopping flow appropriately, visualization of single cells was possible and the kinetics of calcium was studied.
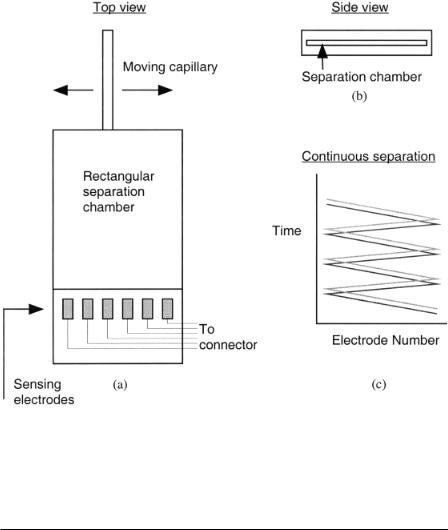
Ewing (1998) and Mesaros et al. (1993) have coupled capillary electrophoresis to electrophoresis in narrow rectangular channels to achieve continuous analysis on small-volume samples. This approach could lead to continuous electrophoretic analysis on the effluent from single cells. The capillary is used to sample analytes and continuously distribute them along a wide, flat separation chamber, as shown in Figures 5.13a,b. The result is the ability to continuously monitor separations, as shown in Figure 5.13c. Continuous separations of dopamine and catechol have been demonstrated. The height of the separation chambers ranged from as small as 0.6 µm to as large as 21 m. Electrochemical array detection was used to monitor the separations at the exit of the chamber (Suljak et al., 1998).
Other Areas of Interest. Another area that holds promise is the use of acoustic devices for cell transport and manipulation. Several groups have demonstrated microfabricated devices capable of transporting small particles via various acoustic methods (Kozuka et al., 1994; Luginbuhl et al., 1997; Hashimoto et al., 1997). Other techniques such as laser scissors and tweezers (Berns et al., 1991; Berns, 1998) and patch clamp techniques (Neher and Sakmann, 1992) while important, will be difficult to implement in high-throughput systems and thus are not discussed in detail here.
F i g . 5.12. Schematic of the fluidic network used to demonstrate cellular assays on a chip. An inhibitor is combined with the cells at 1, incubation occurs during transport down the main channel, an activator is introduced at 2, and flow is stopped and the cells are visualized just after 2. (After Andersson et al., 1997.)
Summary |
109 |
F i g . 5.13. (a) Top view of continuous loading scheme. A moving capillary continuously loads sample into a rectangular separation chamber. (b) Side view of separation chamber (heights of 0.6–21 µm have been used). (c) Resulting output yields a continuous separation of analytes. [After Ewing (1998) and Suljak et al. (1998).]
SUMMARY
The advent of new miniaturization technologies has the potential of providing novel tools to facilitate modern biology. Specifically, the ability to fabricate complex systems that are of the same scale as a single cell allows one to think beyond traditional methods. However, designers of new miniaturized systems for biology must be cognizant of the physics of the scale. That is, does it make sense to miniaturize? What is to be gained? The development costs of microfabricated systems is typically quite high. Thus, the two driving forces for miniaturization are greatly enhanced performance and new functionality (that cannot be achieved with other methods). The integration of these new fabrication and emerging sensing technologies may provide novel smart systems for single-cell analysis and sorting.

110 |
Microfabricated Fluidic Devices for Single-Cell Handling and Analysis |
OTHER SOURCES OF INFORMATION
The overview of microfabricated devices for single-cell handling and analysis given in this chapter is far from exhaustive due to the space limitations. The goal of this chapter was to provide the cytometry community with an overview of potentially related work in the microfabrication community. The focus here has been on flowing systems that might potentially lead to improved or new flow cytometry devices capable of more extensive analysis of single cells. Interested readers are encouraged to examine the following conference proceedings and journals for more information on microfabricated devices and their potential application to biology.
•Proceedings of the TAS Workshop, 1994, 1996, 1998.
•International Conference on Solid-State Sensors and Actuators, 1991, 1993, 1995, 1997.
•Proceedings of the Annual IEEE International Conference on Micro Electro Mechanical Systems, 1987–1999.
•Proceedings of the Solid-State Sensor and Actuator Workshop, Hilton Head, SC, 1990, 1992, 1994, 1996, 1998.
•Journal of Microelectromechanical Systems, IEEE/ASME.
•Micromachined Transducers Sourcebook, by G. T. A. Kovacs, CRC Press, Boca Raton, FL, 1997.
•Fundamentals of Microfabrication, by M. Madou, CRC Press, Boca Raton, FL, 1997.
ACKNOWLEDGEMENTS
I would like to thank the following people for advice, information, and helpful discussions: Juan Santiago, Robin Liu, Henry “Gripp” Zeringue, Ian Glasgow, Gary Durack, Tim Peck, and Andrew Webb.
REFERENCES
Altendorf E, Zebert D, Holl M, Yager P (1997): Differential Blood Cell Counts Obtained Using a Microchannel Based Flow Cytometer. Chicago: Transducers ’97.
Andersson PE, Li PCH, Smith R, Szarka RJ, Harrison DJ (1997): Biological Cell Assays on an Electrokinetic Microchip. 1997 Int’l Conf. on Solid-State Sensors and Actuators, Chicago.
Ayliffe HE, Rabbitt RD, Frazier AB (1998): Microfabricated electric impedance chamber for the electrical characterization of single cells. SPIE.
Bakajin O, Carlson R, Chou CF, Chan S, Gabel C, Knight J, Cox T, Austin RH (1998): Sizing, Fractionation and Mixing of Biological Objects Via Microfabicated Devices. Solid-State Sensor and Actuator Workshop, Hilton Head Island, SC.
References |
111 |
Berns, MW (1998): Laser scissors and tweezers. Sci Am (April): 62–67.
Berns MW, Wright WH, Wiegand-Steubing R (1991): Laser microbeam as a tool in cell biology. Int Rev Cytom 129:1–44.
Brody JP, Yager P, Goldstein RE, Austin R (1996): Biotechnology at low Reynolds numbers. Biophys J 71:3430–3441.
Brody JP, Han Y, Austin RH, Bitensky M (1995): Deformation and flow of red blood cells in a synthetic lattice: Evidence for an active cytoskeleton. Biophys J 68:2224–2232.
Carlson R, Gabel C, Chan S, Austin R, Brody J, Winkleman J (1997): Hydrodynamic activation and sorting of white blood cells in a microfabricated lattice. SPIE 2978:206215.
Chan KL, Green NG, Hughes MP, Morgen H (1998): Cellular Characterization and Separation: Dielectrophoretically Activated Cell Sorting (DACS). 20th Annual International Conference—IEEE/EMBS, Hong Kong.
Coulter WH (1956): High speed automatic blood cell counter and cell size analyzer. Proc Natl Electronics Conf 12:1034–1042.
Ewing AG (1998): Parallel Separations in Microfabricated Channels with Capillary Electrophoretic Sample Introduction. m-TAS ‘98, Banff, Canada.
Fuhr G, Shirley SG (1995): Cell handling and characterization using micron and submicron electrode arrays: state of the art and perspectives of semiconductor microtools. J Micromech Microeng 5:77–85.
Fuhr G, Zimmermann U, Shirley SG (1996): Cell motion in time-varying fields: Principles and potential. In Electromanipulation of Cells, Zimmerman U, Neu GA (eds). Boca Raton: CRC Press. Chapter 5. 259-328.
Fuhr F, Arnold WM, Hagedorn R, Muller T, Benecke W, Wagner B, Zimmerman U (1992): Levitation, holding and rotation of cells within traps made by high-frequency fields. Biochim Biophys Acta 1108: 215–223.
Fulwyler M (1977): Hydrodynamic orientation of cells. J Histochem Cytochem 25(7):781–783.
Glasgow I, Zeringue HC, Beebe DJ, Choi S-J, Lyman JT, Wheeler MB (1998): Individual Embryo Transport and Retention on a Chip. m-TAS -98, Banff, Canada.
Hagedorn R, Fuhr G, Muller T, Gimsa J (1992): Traveling-wave dielectrophoresis of microparticles. Electrophoresis 13:49–54.
Harrison DJ, Fluri K, Seiler K, Fan Z, Effenhauser CS, Manz A (1993): Electrophoresis-based chemical analysis system on a chip. Science 261:895–897.
Hashimoto K, Ikekame K, Yamaguchi M (1997): Micro actuators employing acoustic streaming caused by high-frequency ultrasonic waves. Transducers 97: 805–808
Hogan B, Beddington R, Costantini F, Lacy L (1994): Manipulating the Mouse Embryo. New York: Cold Spring Harbor Laboratory Press.
Jacobson SC, Hergenroder R, Koutny LB, Warmock RJ, Ramsey MJ (1994): Effects of injection schemes and column geometry on the performance of microchip electrophoresis devices. Anal Chem 66:1107–1113.
Kaler KVIS, Docoslis A, Kalogerakis N, Behie LA (1996): A Micromachined DEP Cell Filtration Device. 1996 IEEE Industry Applications Society Meeting, San Francisco, CA.
Kikuchi Y (1995): Effect of leukocytes and platelets on blood flow through a parallel array of microchannels: Microand macroflow relation and rheological measures of leukocyte and platelet activities. Microvas Res 50:288–300.
Kikuchi Y, Sato K, Mizuguchi Y (1994): Modified cell-flow microchannels in a single-crystal silicon substrate and flow behavior of blood cells. Microvas Res 47:126–139.
Kikuchi Y, Sato K, Ohki H, Kaneko T (1992): Optically accessible microchannels formed in a singlecrystal silicon substrate for studies of blood rheology. Microvas Res 44:226–240.
Kovacs GTA (1998): Micromachined Transducers Sourcebook. Boston: WCB McGraw-Hill.
112 |
Microfabricated Fluidic Devices for Single-Cell Handling and Analysis |
Kozuka T, Tuziuti T, Mitome H (1994): Acoustic Manipulation of Micro Objects Using an Ultrasonic Standing Wave. 5th International Symposium on Micromachine and Human Science Proceedings, Nagoya Congress Center.
Kruth HS (1982): Flow cytometry: Rapid biochemical analysis of single cells. Anal Biochem 125:225–242.
Larsen U, Blankenstein G, Branebjerg J (1997): Microchip Coulter Particle Counter. Transducers ’97, Chicago, IL.
Lee S, Choi J, Kim Y (1995): Design of a Biological Cell Fusion Device. The 8th International Conference on Solid-state Sensors and Actuators, and Eurosensors IX, Stockholm, Sweden.
Liakopoulos TM, Choi J, Ahn CH (1997): A Bio-magnetic Bead Separator on Glass Chips Using Semiencapsulated Spiral Electromagnets. 1997 Int’l Conference on Solid-State Sensors and Actuators, Chicago, IL.
Luginbuhl P, DeRooij N, Collins, SD, Racine G-A, Setter N, Brooks KG (1997): Acoustic wave device for the translation of microparticles. SPIE 2978:129–134.
Madou M (1997): Fundamentals of Microfabrication. Boca Raton, FL: CRC Press.
Manz A, Harrison DJ, Verpoorte E, Widmer HM (1993): Planar chips technology for miniaturization of separation systems: a developing perspective in chemical monitoring. Adv Chromatog 33:1–66.
Masuda S, Washizu M, Kawabata I (1988): Movements of Blood Cells in Liquid by Nonuniform Traveling Field. IEEE Trans Ind Applic 24(1):217–222.
Masuda S, Washizu M, Nanba T (1987): Novel Methods of Cell Fusion and Handling Using Fluid Integrating Circuit. Electrostatics ’87, Oxford.
Mesaros JM, Luo G, Roeraade J, Ewing AG (1993): Continuous electrophoretic separations in narrow channels coupled to small-bore capillaries. Anal Chem 65:3313–3319.
Neher E, Sakmann B (1992): The patch clamp technique. Sci Am: 44–51.
Ogura E, Abatti PJ, Morizumi T (1991): Measurement of human red blood cell deformability using a single micropore on a thin Si3N4 film. IEEE Trans Biomed Eng 38(8):721–725.
Olson DL, Peck TL, Webb AG, Magin RL, Sweedler JV (1995): High-resolution microcoil 1H-NMR for mass-limited, nanoliter-volume samples. Science 270:1967–1970.
Peck TL, Stocker JE, Chen Z, LaValle L, Magin RL (1995): Application of Planar Microcoils Fabricated on Glass Substrates to NMR Microspectroscopy. 17th Annual Int Conf of the IEEE EMBS, Montreal Canada.
Peck TL, Magin RL, Kruse J, Feng M (1994): NMR microspectroscopy using 100 m planar RF coils fabricated on gallium arsenide substrates. IEEE Trans Biomed Engr 41(7):706–709.
Pinkel D, Stovel R (1985): Flow chambers and sample handling. In Flow Cytometry: Instrumentation and Data Analysis, Van Dlla MA, Dean PN, Laerum OD, Melamed MR (eds). New York: Academic Press, 77–98.
Purcell EM (1977): Life at low Reynolds number. Am J Phy 45:3–11.
Schnelle T, Hagedorn R, Fuhr G, Fiedler S, Muller T (1993): Three-dimensional electric field traps for manipulation of cells-calculation and experimental verification. Biochim Biophys Acta 1157:127–140.
Sobek D, Senturia S, Gray M (1994): Microfabricated Fused Silica Flow Chambers for Flow Cytometry. Solid-State Sensor and Actuator Workshop, Hilton Head, South Carolina.
Stocker JE, Peck TL, Webb AG, Feng M, Magin RL (1997): Nanoliter volume, high resolution NMR microspectroscopy using a 60 m planar microcoil. IEEE Trans Biomed Eng 44(11):1122–1128.
Stocker J, Peck T, Webb A, Franke S, Feng M, Magin R (1996): Integrated Microcoil/Amplifier Detector for Microspectroscopy. 37th Experimental NMR Conference, Asilomar, CA.
Stocker JE, Peck TL, Franke SJ, Kruse J, Feng M, Magin RL (1995): Development of an Integrated Detector for NMR Microscopy. 17th Annual Int Conf of the IEEE EMBS, Montreal Canada.
Suljak SW, Thompson LA, Ewing AG (1998): Electrophoretic Separations in Ultrathin Channels Using Microelectrode Array Detection. m-TAS ’98, Banff, Canada.
References |
113 |
Telleman P, Larsen UD, Phillip J, Blankenstein G, Wolff A (1998): Cell Sorting in Micro Fluidic Devices. mTAS ’98, Banff, Canada.
Tracey MC, Greenaway RS, Das A, Kaye PH, Barnes AJ (1995): A silicon micromachined device for use in blood cell deformability studies. IEEE Trans Biomed Engr 42(8):751–761.
Tracey MC, Kaye PH, Shepherd JN (1991): Microfabricated Microhaemorheometer. Rec Int Conf Sensors Actuators, California.
Trumbull JD, Glasgow IK, Beebe DJ, Magin RL (1998): Integrating Microfluidic Systems and NMR Spectroscopy: Preliminary Results. 1998 Solid-State Sensor and Actuator Workshop, Hilton Head Island, South Carolina.
Washizu M (1990): Handling biological cells using a fluid integrated circuit. IEEE Trans Ind Applic 26(2):352–358.
Webb AG, Grant SC (1996): Signal-to-noise and magnetic susceptibility tradeoffs in solenoidal microcoils. J Magn Reson 113:83–87.
Wilding P, Pfahler J, Bau HH, Zemel JN, Kricka LJ (1994): Manipulation and flow of biological fluids in straight channels micromachined in silicon. Clin Chem 40:43–47.
Wu N, Peck T, Webb A, Magin R, Sweedler J (1994): 1H-NMR spectroscopy on the nanoliter scale for static and on-line measurements. Anal Chem 66:38–49.

Emerging Tools for Single-Cell Analysis: Advances in Optical Measurement Technologies
Edited by Gary Durack, J. Paul Robinson Copyright © 2000 Wiley-Liss, Inc.
ISBNs: 0-471-31575-3 (Hardback); 0-471-22484-7 (Electronic)
6
Single DNA Fragment Detection by Flow Cytometry
Robert C. Habbersett, James H. Jett, and Richard A. Keller
Los Alamos National Laboratory, Los Alamos, New Mexico
INTRODUCTION
Flow cytometry technology—although in this context “cytometry” is a misnomer— has been extended to enable the analysis of very small samples of individual DNA fragments, rapidly and reliably, with direct quantitation of fragment size and number. This has required a new generation of flow instrumentation, literally a molecularlevel flow analyzer, which is the subject of this chapter. It is the result of extensive development work by numerous individuals at the Los Alamos National Laboratory (Ambrose et al., 1993; Petty et al., 1995; Huang et al., 1996; Goodwin et al., 1997). The initial instrument for DNA fragment size analysis, documented in 1993, evolved out of ongoing efforts to sequence DNA in flow (Goodwin et al., 1997). The simplified apparatus, to be described here, is a second-generation instrument that differs from the original in a number of significant ways. First, the range of DNA fragments that can be analyzed has been extended to both larger and smaller fragments. A different DNA-binding dye has been used in order to utilize a small, solid-state laser. A single data-acquisition card in a PC constitutes the entire data collection system. A new photon-counting detector, an avalanche photodiode (APD; Li and Davis, 1993) with high quantum efficiency, has replaced a bulky, liquid-cooled photomultiplier. Finally, DNA in solution is delivered directly into the flow cell, to within a few hundred
115
116 |
Single DNA Fragment Detection by Flow Cytometry |
micrometers of the laser beam, by small-bore quartz capillary tubing. This chapter will describe and explore the nature of these changes and how they affect the performance and extend the capabilities of this technology.
There are several fundamental differences between the realm of individual molecular analysis and the familiar world of conventional flow cytometry. First, this instrument requires a photon-counting detector for maximum sensitivity, instead of a current-mode photomultiplier tube; as a result, different electronics are required (along with custom software) to record and process the photon-counting data. The second major difference is that the flow velocity is ~1000 times slower (10 mm/sec vs. 10 m/sec). Very slow flow is required in order to collect sufficient photons from the relatively low number of fluorophores bound to small DNA fragments. Also, it is essential that the detection volume—the volume within the flow cell delineated by the intersection of the laser beam energy distribution with the field of view of the fluorescence collection lens—be as small as possible to reduce the background counts.
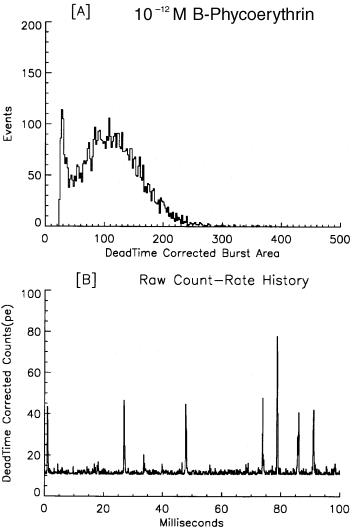
The approach to single fluorescent molecule detection in flow—techniques and in- strumentation—has been documented in detail elsewhere (Keller et al., 1996). DNA fragment sizing is the first direct application of this technology. This accomplishment required the new, highly specific DNA-binding dye TOTO-1 (Rye et al., 1992). From a family of related dimeric cyanine nucleic acid stains, TOTO-1 is essentially nonfluorescent until it binds to DNA, whereupon there is a 1400-fold enhancement of fluorescence resulting in relatively large signals, a very low background, and a low detection limit. The smallest DNA fragment clearly resolved from background in 1993 was 10,086 base pairs (bp) with about 200 photoelectrons detected from approximately 2000 dye molecules (1 : 5 dye-to-DNA bp ratio). Excellent measurement linearity was achieved for DNA fragments ranging in length from 10.1 to 48.5 kilobase pairs (kbp). Although gel electrophoresis has better resolution (at least for fragments below about 10 kbp), the flow-based measurement gives direct enumeration of the individual fragments analyzed. Detection of single, small, fluorescent molecules (<500 mol. wt.) in solution requires more elaborate equipment and complex techniques, such as time-gated detection or two-photon excitation, than those necessary to measure DNA fragment size (Keller et al., 1996; Goodwin et al., 1996; Johnson et al., 1993). The apparatus to be described in this chapter, known as the MiniSizer, can detect single phycoerythrin molecules in solution, as illustrated in Figure 6.1. However, phycoerythrin is a large macromolecule consisting of 34 individual fluorophores. Nevertheless, this is about the lower detection limit for the current configuration of the apparatus, with about 115 photons detected during the 2-ms transit time through the laser beam. Petty et al. (1995) reported detection of individual 1.5-kbp fragments in 1995 and the smallest detectable fragment continues to decrease.
An unfamiliar term needs to be introduced at this point. In this regime, with a pho- ton-counting detector, where the fluorescence emission and background noise are resolved into single photons, a “burst” of photons denotes the passage of a single fluorescent molecule through the laser beam, as seen in the bottom panel of Figure 6.1. This term will be used synonymously with “event” or “signal,” corresponding to the detection of a discrete fluorescent entity passing through the laser beam. Criteria such as burst area, burst height, and burst duration will be used to quantify these events.
Introduction |
117 |
Fig. 6.1. Detection of individual phycoerythrin molecules in solution. (A) Burst area histogram of B- phycoerythrin molecules in solution at 10–12 M with 10 mW of laser power (532 nm). (B) Segment of the raw data, i.e., the running count rate history, showing the individual bursts of photons detected from the PE molecules with a dwell time of 100 µs. The burst duration was about 550 µs.
The first DNA fragment–sizing apparatus was fairly cumbersome, nearly filling a 5 × 8-ft optical table. Numerous modules, including a liquid-cooled photon-counting PMT, an amplifier/discriminator, a water-cooled ion laser, a multichannel scaler system with a CAMAC computer interface, and a SUN workstation, were utilized. Continual technical improvements and simplifications have resulted in the system being reported here. For the MiniSizer, the decision was made at the outset to substantially
118 |
Single DNA Fragment Detection by Flow Cytometry |
diverge from the earlier work. We decided to evaluate the related but previously unproven dye POPO-3. This dye offered the compelling advantage that we could use the new solid-state, diode-pumped miniature lasers that were becoming less expensive, and hence more available. In a proof-of-principle experiment, using a borrowed laser (532 nm, 7 mW), a state-of-the-art APD detector, and POPO-3, the 564-bp fragment of lambda DNA was observed in flow for the first time (unpublished results). Based on these results, we bought a new frequency-doubled “µGreen” laser and an actively quenched APD detector, which can count more than ten million photons per second.
The top-left graph in Figure 6.2 shows the histogram of burst areas recorded from a sample of lambda bacteriophage DNA digested with the HindIII restriction enzyme. In addition to the 564-bp fragment, well resolved at the left edge of the graph (see insert), there are several other features to point out in this figure. Only six peaks are resolved in the graph, but actually eight fragments (125, 564, 2027, 2322, 4361, 6557, 9416, 23130 bp) result from this digestion of lambda DNA. The 125-bp fragment is not visible, while two fragments (2027 and 2322 bp) that are not separately resolved produce the second peak from the left. However, the integrated area of that peak reveals that two fragments are contained therein. Interestingly, the burst duration histogram (Fig. 6.2B) has structure in it, with the bump at 1230 µs [corresponding to the peak at 3500 photoelectrons (pe) in the area histogram] representing the 23.1-kbp fragment. Another significant point is that the positions of all six peaks—derived by simultaneously fitting six Gaussians to the histogram—appear linearly related to the known fragment sizes. Unfortunately, in this case, this is somewhat misleading. Note that the peak in Figure 6.2A at approximately 650 pe is smaller in area than the two peaks to its right. This peak represents the 4.4-kbp fragment that contains a “cos” site where a 12-bp region is single stranded and therefore “sticky.” This fragment hybridizes with its complementary sticky end on the 23.1-kbp fragment. When this happens, the 4.4-kbp fragment is underrepresented in the histogram, while the 23.1-kbp fragment becomes 27.5 kbp long. With intact lambda molecules, this sticky region is also responsible for concatamer formation. All fragments should be equally represented since eight fragments result from each and every lambda molecule completely digested. (Heating to 60°C for 10 min disassociates the 4.4- and 23.1-kbp fragments.) The interesting aspect of this is that the peak at 3500 pe is due to the 27.5-kbp aggregate instead of the individual 23.1-kbp fragments. As a result, when using the expected digest fragment sizes, the peak positions appear to be more linearly spaced (Fig. 6.2D) than they really are. The small shoulder at 3000 pe is the true 23.1-kbp peak, and it would be located further out in the histogram if the detector had a larger dynamic range. This nonlinearity is due to a fundamental limitation of the APD module caused by a fixed deadtime (about 30 ns) after each photon is detected and before the detector can again respond. Fortunately, this can easily be corrected in software, off-line, when the raw data (a running count rate history) are processed by software to extract the individual event characteristics: burst area, burst height, and width. The computer algorithm and other data processing issues will be described under Instrumentation. Another point, also to be elaborated on later, must be introduced here. In the burst-area-versus-burst-height contour plot (Fig. 6.2C), the 23.1-kbp fragment falls off the diagonal line of the smaller fragments; its area has increased but the burst height has leveled off and is no longer linearly correlated with