

Emerging Tools for Single-Cell Analysis
.pdf170 |
Fluorescence Lifetime Imaging: New Microscopy Technologies |
forming a complete Fourier transform, which recovers the correct waveform, as well as the bleaching rate.
Singleor Multiple-Exponential Decay
For real-time imaging, the time-domain FLIM provides results for a single apparent lifetime assuming a single-exponential decay. To solve the multiexponential problem, one needs data-fitting routines and more than two gates are necessary. For frequencydomain FLIM, using a single modulation frequency, one obtains two apparent life-
time values, τphase and τmod, which can be used to evaluate whether or not one has a single-exponential case. For systems with multiexponential decays, τphase and τmod are
not equal and each value can be used to evaluate different lifetime components, as we discussed in great length previously under Background of Frequency-Domain Method. With two apparent lifetimes obtained in the frequency domain, one has more information about the systems under investigation than with just one lifetime value in the case of the time domain. This point is also demonstrated in our lifetime measurement of cellular chloride concentrations. To resolve multiexponential decay, that is, individual lifetimes as well as the fractional contribution of each component, one needs to use more than one modulation frequency. However, for biological applications, we find that interest is often focused on the differences in the apparent lifetime at different spatial locations, and not so much on solving the fractional components with different lifetime values.
SUMMARY
We have described the theories and their applications of the major techniques used for fluorescence lifetime imaging. FLIM is one step forward toward quantitative microscopy, which we believe is the future of microscopy studies. The availability of the instrumentation to general laboratories depends on the cost, which is still high as most of the techniques require high-speed electronic or optical components in addition to the laser. In this respect, the pump–probe technique is attractive since it eliminates the cost of the high-speed detectors. To practically realize the FLIM methodologies, it is important to make these techniques user friendly. We have compared some of the major differences between the different FLIM methods that are the basis for choosing one technique over the other in practical applications. We have demonstrated, by measuring cellular chloride concentrations, that the capability of lifetime imaging is superior to simple intensity imaging. Valuable information can be derived from these quantitative measurements.
ACKNOWLEDGMENTS
We wish to acknowledge the support of the National Institutes of Health (RR03315) for the research on two-photon time-resolved microscopy. We thank Qiaoqiao Ruan

References |
171 |
for culturing the PC12 cell and Osman Akcakir for the chloride calibration measurement. Our thanks also go to Robert Clegg, who recently joined the Laboratory for Fluorescence Dynamics, for the valuable discussions we had on FLIM.
REFERENCES
Atherton SJ, Beaumont PC (1984): Photobiochem Photobiophys 8:103–113.
Ballew RM, Demas JN (1989): Anal Chem 61:30–33.
Buist AH, Mueller M, Gijsbers EJ, Brakenhoff GJ, Sosnowski TS, Norris TB, Squier J (1997): J Microscopy 186(3):212–220.
Buurman EP, Sanders R, Draaijer A, Gerritsen HC, van Veen JJF, Houpt PM, Levine YK (1992): Scanning 14:155–159.
Cario G, Franck J (1922): Z Phys 11:161.
Centonze VE, White JG (1998): Biophys J 75(4):2015–2024.
Clegg RM (1996): In Fluorescence Imaging Spectroscopy and Microscopy, Vol. 137. Wang XF, Herman B (eds). Chemical Analysis Series, New York: Wiley, pp 179–252.
Clegg RM (1992): Methods Enzymol 211:353–88.
Clegg RM, Schneider PC, Jovin TM (1996): In Biomedical Optical Instrumentation and Laser-Assisted Biotechnology. Dordrecht, The Netherlands: Kluwer Academic, pp 143–156.
Clegg RM, Schneider PC (1996): In Fluorescence Microscopy and Fluorescent Probes. New York: Plenum Press.
Cubeddu R, Canti G, Pifferi A, Taroni P, Valentini G (1997): Photochem Photobiol 66(2):229–236. Diffey WM, Homoelle BJ, Edington MD, Beck WF (1998): J Phys Chem B 102(15):2776–2786. Dix JA, Verkman AS (1990): Biochem 29:1949–1954.
Denk W, Strickler JH, Webb WW (1990): Science 248:73–76.
Dong CY, So PTC, French T, Gratton E (1995): Biophys J 69:2234–2242.
Dong CY, So PTC, Buchler C, Gratton E (1997): Optik 106(1):7–14.
Dowling K, Hyde SCW, Dainty JC, French PMW, Hares JD (1997): Opt Commun 135:27–31.
Dowling K, Dayel MJ, Hyde SCW, Dainty JC, French PMW, Vourdas P, Lever MJ, Dymoke-Bradshaw AKL, Hares JD, Kellett PA (1998): IEEE J of Selected Topics in quantum Electronics 4(2):370–375.
Dushinsky FZ (1933): Physik 81:7.
Elzinga PA, Lytle FE, Jian Y, King GB, Laurendeau NM (1987a): Appl Spectroscopy 41:2–4.
Elzinga PA, Kneisler RJ, Lytle FE, Jian Y, King GB, Laurendeau NM (1987b): Appl Opt 26:4303–4309. Feddersen BM, Piston DW, Gratton E (1989): Rev Sci Inst 60(9):2929–2936.
French T, Gratton E, Maier J (1992): Time-resolved laser spectroscopy in biochemistry III. SPIE Proc 1640:254–261.
French T, So PTC, Weaver Jr DJ, Coelho-Sampaio T, Gratton E, Voss Jr EW, Carrero J (1997): J Microscopy, 185:339–353.
Gadella Jr TWJ, Jovin TM J (1995): Cell Biol 129:1543–1548.
Gaviola E (1927):Z Phys 42:853.
Gaviola E, Pringsheim P (1927): Z Phys 43:384.
Gratton E, Limkeman M (1983): Biophys J 44:315–324.
Gratton E, Jameson DM, Hall R (1984): Ann Rev Biophys Bioeng 13:105–124.
Hartmann P, Ziegler W, Holst G, Luebbers DW (1997): Sensors Actuators B 38–39:110–115. Inglefield JR, Schwartz-Bloom RD (1997): J Neurosci Methods, 75:127–135.
172 Fluorescence Lifetime Imaging: New Microscopy Technologies
Itoh H, Evenzahav A, Kinoshita K, Inagaki Y, Mizushima H, Takahashi A, Hayakawa T, Kinosita K Jr (1997): SPIE Proc 2979:733–740.
Jameson DM, Gratton E, Hall R (1984): App Spec Rev 20:55–106.
Keating SM, Wensel TG (1991): Biophys J 59:186–202.
Koenig K, So PTC, Mantulin WW, Tromberg BJ, Gratton E (1996): J Microsc 183:197–204. Krnjevic K, Schwartz S (1967): Exp Brain Res 3:320–336.
Kumble R, Palese S, Lin VSY, Therien MJ, Hochstrasser RM (1998): J Amer Chem Soc 120(44):11489–11498.
Kusba J, Bogdanov V, Gryczynski I, Lakowicz JR (1994): Biophys J 67:2024–2040. Lakowicz JR, Jayaweera R, Joshi N, Gryczynski I (1987): Anal Biochem 160:471–479.
Lakowicz JR, Szmacinski H, Nowaczyk K, Berndt KW, Johnson M (1992): Anal Chem 202:316–330. Lakowicz JR, Szmacinski H, Nowaczyk K, Lederer WJ, Kirby MS, Johnson ML (1994a): Cell Calcium
15:7–27.
Lakowicz JR, Gryczynski I, Bogdanov V, Kusba J (1994b): J Phys Chem 98:334–342.
Mantulin WW, French T, Gratton E (1993): Medical Lasers and Systems II SPIE Proc 1892:158–166. Marriott G, Clegg RM, Arndt-Jovin DJ, Jovin TM (1991): Biophys J 60:1374–1387.
Masters BR, So PTC, Gratton E (1997): Biophys J 72:2405–2412.
McLoskey D, Birch DJ, Sanderson A, Suhling K (1996): Rev Sci Instrum 67(6):2228–2237.
Miki M, Miura T, Sano K, Kimura H, Kondo H, Ishida H, Maeda Y (1998): J Biochem 123(6):1104–1111. Mizeret J, Wagnieres G, Stepinac T, van den Bergh H (1997): Lasers in Med Sci 12:209–217.
Morgan CG, Mitchell AC, Murray JG (1992): J Microsc 165(1):49–60.
Morgan CG, Mitchell AC, Peacock N, Murray JG (1995): Rev Sci Instrum 66(1):48–51. Mueller M, Ghauharali R, Visscher K, Brakenhoff G (1995): J Microsc 177(2):171–179. Ni T, Melton LA (1996): Appl Spectrosc 50(9):1112–1116.
Oida T, Sako Y, Kusumi A (1993): Biophys J 64:676–685.
Periasamy A, Wodnicki P, Wang XF, Kwon S, Gordon GW, Herman B (1996): Rev Sci Instrum 67(10):3722–3731.
Piston DW, Sandison DR, Webb WW (1992): SPIE Proc 1640:379–389.
Piston DW, Kirby MS, Cheng H, Lederer WJ, Webb WW (1994): Appl Optics 33:662–669. Piston DW, Masters BR, Webb WW (1995): J Microsc 178(1):20–27.
Pringsheim P (1949): Fluorescence and Phosphorescence. New York: Interscience. Reinhart G, Marzola P, Jameson D, Gratton E (1991): J Fluorescence 1(3):153–161.
Sanders R, Draaijer A, Gerritsen HC, Houpt PM, Levine YK (1995): Anal Biochem 227:302–308. Sanders R, van Zandvoort MAMJ, Draaijer A, Levine YK, Gerritsen HC (1996): Photochem Photobiol
64(5):817–820.
Sargent III M, Scully MO, Lamb Jr WE (1974): Laser Physics. London: Addison-Wesley. Schneider P, Clegg RN (1997): Rev Sci Instrum 68(11):4107–4119.
Scully AD, Ostler RB, Phillips D, O’Neil PO, Townsend KMS, Parker AW, MacRobert AJ (1997): Bioimaging 5:9–18.
Silverman L, Campbell R, Broach JR (1998): Curr Opin Chem Biol 2(3):397–403.
So PTC, French T, Gratton E (1994): Time resolved Laser Spectroscopy in Biochemistry IV SPIE Proc 2137:83–92.
So PTC, French T, Yu WM, Berland KM, Dong CY, Gratton E (1995): Bioimaging 3:49–63. Subramaniam V, Kirsch AK, Jovin TM (1998): Cell Mol Biol 44(5):689–700.
Swift KM, Mitchell GW (1991): SPIE Proc 1431:171–178.
Sytsma J, Vroom JM, De Grauw CJ, Gerritsen HC (1998): J Microsc 191(1):39–51.
References |
173 |
Toth K, Sauermann V, Langowski J (1998): Biochemistry 37(22):8173–8179.
Vanbrederode ME, Ridge JP, Vanstokkum IHM, Vanmourik F, Jones MR, Vangrondelle R (1998): Photosyn Res 55(2–3):141–146.
Visser AJWG (1997): Curr Opin Colloid & Interface Sci 2(1):27–36.
Wagner S, Castel M, Gainer H, Yarom Y (1997): Nature 387:598–603.
Wang XF, Uchida T, Coleman DM, Minami S (1991): Appl Spectrosc 45(3):360–366. Woods RJ, Scypinski S, Love LJC, Ashworth HA (1984): Anal Chem 56:1395.
Yu WM, So PTC, French T, Gratton E (1996): Biophys J 70:626–636.

Emerging Tools for Single-Cell Analysis: Advances in Optical Measurement Technologies
Edited by Gary Durack, J. Paul Robinson Copyright © 2000 Wiley-Liss, Inc.
ISBNs: 0-471-31575-3 (Hardback); 0-471-22484-7 (Electronic)
8
Fluorescence Lifetime Flow Cytometry
John A. Steinkamp
Los Alamos National Laboratory, Los Alamos, New Mexico
INTRODUCTION
Conventional flow cytometry (FCM) instruments rapidly measure biochemical, functional, and physical properties of individual cells and subcellular components. They are used in clinical diagnostic medicine [e.g., acquired immunodeficiency syndrome (AIDS) diagnosis/treatment monitoring] and in biological and biomedical research applications. Routine clinical tests and biological measurements are primarily based on labeling cells with multiple-color fluorochromes for correlated analysis of biomolecules, such as DNA, RNA, proteins, enzymes, lipids, and cell surface receptors (human lymphocyte subsets); for determining specific DNA sequences [fluorescence in situ hybrid-hybridization (FISH)]; and for measuring subcellular components, such as mitochondria and chromosomes. Multicolor detection methods employing colorseparating dichroic and bandpass optical filters have been routinely used for measuring multiple fluorochrome emissions when spectra are sufficiently separated and the fluorochromes require only one excitation source. Electronic compensation is presently used to separate signals from partially overlapping fluorescence emission spectra to eliminate spectral cross-talk between adjacent detection channels (Loken et al., 1977). Overlapping spectral emissions also have been resolved by recording and analyzing emission spectra using fast Fourier transform (FFT) computational methods (Buican, 1990). If fluorochromes cannot be resolved by these means but
175
176 |
Fluorescence Lifetime Flow Cytometry |
have separated excitation spectra, multiple excitation sources can be employed to sequentially excite labeled cells and spatially resolve spectrally overlapping emission signals (Beavis and Pennline, 1994; Roederer et al., 1997; Steinkamp et al., 1991). In addition to utilizing the spectral emission properties of fluorescent probes (color/ intensity) to measure cellular features, excited-state lifetimes (decay times) provide a means to discriminate among fluorescent markers and serve as spectroscopic probes to study the interaction of fluorescent markers with their cellular targets, each other, and the surrounding microenviroment.
The direct measurement of excited-state lifetimes by flow cytometry is important because it provides information about fluorophore/cell interactions at the molecular level. An advantage of lifetime measurements is that lifetimes can be considered in some instances as absolute quantities. However, the lifetimes of fluorophores bound to cellular macromolecules can be influenced by physical and chemical factors near the binding site, such as solvent polarity, cations, pH, energy transfer, and excited-state reactions. Often such changes are accompanied by a change in the temporal nature of the fluorescence decay (e.g., single exponential, multiexponential, or nonexponential). Therefore, it is expected that lifetime measurements can be used to probe cellular complexes and subcompartments, such as (1) the chemical and structural changes that occur in DNA and chromatin during the cell cycle, in differentiating cells, and in apoptotic cells with damaged chromatin (Sailer et al., 1996, 1997a, 1998b); (2) DNA and double-stranded RNA (Sailer, 1998a); (3) the cell surface by quenching of fluoroscein isothiocyanate (FITC) -conjugated antibodies (Deka et al., 1996); and (4) the binding of cytotoxic chemicals to DNA and other molecular targets in cells (Sailer et al., 1997b). Table 8.1 lists the lifetimes of fluorescent markers used to measure cellular DNA, RNA and protein content, mitochondria, antibody labeling of cellular antigens, and the lifetime of cellular [line Chinese hamster ovary (CHO)] autofluorescence.
Static spectroscopic fluorescence measurements of excited-state lifetimes are made in the time domain by time-correlated, single-photon counting (Demas, 1983; Lakowicz, 1983) or in the frequency domain by determining the frequency response of the fluorescence emission to a continuous intensity-modulated excitation. Timedomain methods have been employed in fluorescence microscopy to measure the lifetime of fluorophores bound to cells (Keating and Wensel, 1991; Vigo et al., 1987) and of single molecules in flow (Wilkerson et al., 1993). In the frequency-domain method, the fluorescence emission signal has the same frequency content as the excitation but is shifted in phase, and the depth of modulation is decreased due to the finite lifetimes of the excited states. There has been remarkable progress in frequency-domain spectrofluorometric developments during the past several years (Berndt et al., 1990; Gratton and Limkeman, 1983; Gratton et al., 1984; Lakowicz et al., 1985, 1986; Mitchell and Swift, 1989; Thompson et al., 1992). These developments have been applied to microscope-based cellular imaging systems (Gadella et al., 1997, 1993; Lakowicz et al., 1992; So et al., 1994, 1995) and to flow cytometers for measuring lifetimes of fluorophores bound to cells using real-time analog (Pinsky et al., 1993; Steinkamp et al., 1993b) and digital signal (Beisker and Klocke, 1997; Deka et al., 1994; Durack et al., 1998) processing methods. The technology for combined fluorescence lifetime measurements on fluorophore-labeled particles and the

Introduction |
177 |
T A B L E 8.1. Examples of Fluorescence Lifetimes and Corresponding Phase Shifts at Various Excitation Frequencies for Fluorochromes Used to Label Cellular Complexes and Cells
|
Excitation |
Fluorescence |
|
Phase shifta |
|
|
|
|
|
||
Fluorescent |
wavelength |
lifetime |
At 10 MHz |
At 30 MHz |
At 50 Mhz |
dye/compound |
(nm) |
(ns) |
(deg) |
(deg) |
(deg) |
|
|
|
|
|
|
Hoechst 33342 (DNA)b |
360 |
2.6 |
9.2 |
26.1 |
39.2 |
DAPI (DNA)b |
360 |
3.5 |
12.3 |
33.4 |
47.7 |
Mithramycin (cells)c |
420 |
3.0 |
10.7 |
29.5 |
43.3 |
Propidium iodidec |
515 |
1.2 |
4.3 |
12.7 |
20.6 |
Propidium iodide (cells)c |
515 |
13.0 |
39.2 |
67.8 |
76.2 |
Ethidium bromide (cells)c |
515 |
19.0 |
50.0 |
74.4 |
80.5 |
Ethidium bromide (DNA)d |
515 |
22.5 |
54.6 |
76.7 |
81.9 |
7-AAD (DNA)e |
515 |
0.8 |
2.9 |
8.6 |
14.1 |
Acridine Orange (cells)c |
480 |
3(Gn), 13(Rd) |
10.7, 39.2 |
29.5, 67.7 |
43.3, 76.2 |
Pyronin Y (cells)c |
530 |
0.6, 2.3 |
2.2, 8.2 |
6.5, 23.4 |
10.7, 35.8 |
FITCf |
480 |
3.6 |
12.5 |
34.0 |
48.5 |
Fluoresceinc |
480 |
4.7 |
16.4 |
41.5 |
55.9 |
Rhodamine 123 (cells)g |
511 |
2.0, 4.0 |
7.2, 14.1 |
20.6, 37.0 |
32.1, 51.5 |
Phycoerythrin-Avidinc |
530 |
3.5 |
12.6 |
33.4 |
47.7 |
Texas Red-Avidinc |
530 |
4.6 |
16.1 |
40.9 |
55.3 |
Fluorescamineh |
uv |
7.0 |
23.8 |
52.8 |
65.5 |
Dansyl chlorideh |
uv |
14.0 |
41.2 |
69.4 |
77.2 |
CHO Cells (autofluores.)i |
365 |
1.8 |
6.4 |
18.7 |
29.5 |
a Phase shift equals arctan , where 2 f is the angular frequency and is the fluorescence lifetime.
b Biophys J 72:567, 1997. |
f Anal Let. 18(A4):393, 1985. |
c Unpublished data (J. Martin). |
g J Fluoresc 6:209, 1996. |
d Biochemistry 16:3647, 1977. |
h Clin Biochem 21:139, 1988. |
e Proc SPIE 2137:462, 1994. |
i J Microsc 183:197, 1996. |
surrounding fluorophore solution by flow cytometry also has been described (Steinkamp and Keij, 1999). Although frequency-domain, analog signal-processing methods are more suitable than time-domain methods for making lifetime measurements on a cell-by-cell basis in flow in real time, time-resolved lifetime measurements on single cells have been demonstrated (Deka and Steinkamp, 1996).
Fluorescence lifetimes also can be used to electronically separate the overlapping emissions from fluorescent probes based on differences in their lifetimes expressed as phase shifts using phase-sensitive detection in both static (Lakowicz and Cherek, 1981) and flow systems (Steinkamp and Crissman, 1993). Because signals from fluorophores are resolved electronically, rather than spectroscopically, the number of fluorescent probes that can be used on the same sample is increased; because different markers bind to different targets, increasing the number of potential fluorochrome

178 |
Fluorescence Lifetime Flow Cytometry |
probes increases the number of biological parameters that can be studied concurrently and correlated, and light losses from optical filtering are eliminated. In addition, background interferences, for example, autofluorescence, unbound fluorophores, nonspecific fluorophore labeling, and Rayleigh scatter, may be reduced or eliminated in the measurement process (Steinkamp et al., 1997, 1999b).
The resolution of signals from fluorescence emissions by phase-sensitive detection using flow cytometry was first demonstrated on cells stained with propidium iodide (PI) and FITC for total cellular DNA and protein content, respectively (Steinkamp and Crissman, 1993). Although the PI and FITC fluorescence emission signals are readily separable by conventional FCM methods (Crissman and Steinkamp, 1982), they were separated electronically using a single photomultiplier tube (PMT), a long-pass (barrier) filter to block scattered laser excitation light, and two phase-sensitive detection channels, one for PI and the other for FITC. In addition, phycoerythrin (PE)–antiThy 1.1 antibody–labeled rat thymus cells in suspension have been stained with PI (overlapping emission spectra) for locating “dead cells” and analyzed by phase-resolved methods to electronically separate cells that were PI positive only, PE–antiThy 1.1 labeled and PI positive, and PE–antiThy 1.1 labeled only (Steinkamp et al., 1999a). These studies also used murine thymus cells labeled with PE/Texas Red–antiThy 1.2 antibody and stained in suspension with PI (highly overlapping emission spectra). The application of phase-sensitive detection to eliminate autofluorescence from lung fibroblasts labeled with a cell surface FITC antibody has been described (Steinkamp et al., 1999b), and viable cells labeled with Hoechst 33342 and monobromobimane (overlapping fluorescence emissions) have been analyzed using phase-sensitive flow cytometry to determine relative DNA and glutathione content, respectively (Keij et al., 1999).
MATERIALS AND METHODS
Theory of Operation
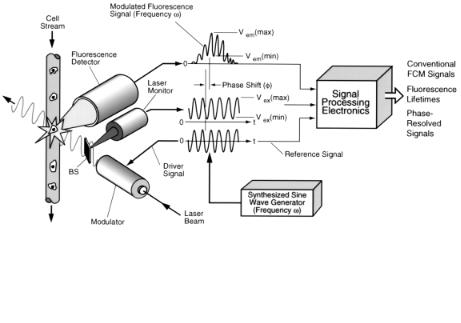
Fluorochrome-labeled cells are analyzed as they intersect an optically focused continuous wave (cw) laser beam that is sinusoidally modulated in intensity at a high frequency (see Fig. 8.1). The time-dependent fluorescence emission signal v(t) is a Gaussian-shaped, modulated pulse that results from the passage of the cell across the laser beam and can be expressed in an approximate form as
v(t) V[1 m sin( t– )]e |
–a2 |
(t–t0)2 |
(8.1) |
|
|
where V is the signal intensity, is the angular excitation frequency (modulation), and m are the respective signal phase shift and demodulation terms associated with a single fluorescence decay time ( ), t is time, and a is a term related to the laser beam height and the velocity of a cell crossing the laser beam at time t0 (Zarrin et al., 1987). An exact derivation of this relationship has been given by Deka et al. (1994). The cwexcited (dc), low-frequency signal component is extracted using a low-pass filter to give conventional FCM fluorescence intensity information (see Fig. 8.4A below). The
Materials and Methods |
179 |
high-frequency modulated sine wave signal component, which is shifted in phase ( ) by an amount
arctan |
(8.2) |
relative to the excitation frequency and demodulated by a factor m (described below), is processed by phase-sensitive detectors (PSDs) (Blair and Sydenham, 1975; Meade, 1982) to resolve fluorescence emission signals based on differences in lifetimes (expressed as phase shifts) and to quantify lifetime directly as a parameter (see Figs. 8.4B and 8.4C below). Each PSD consists of a multiplier, a sine wave reference signal with phase shifter to shift the phase of the reference ( R) with respect to the modulated fluorescence signal input to the multiplier, and a low-pass filter. The PSD outputs are Gaussian-shaped signals that are proportional to the fluorescence intensity, the demodulation factor, and the cos ( – R), expressed as
1 |
2 |
(t–t0) |
2 |
(8.3) |
vo(t) mV cos( – R) e–a |
|
|||
2 |
|
|
|
|
Measurement of Fluorescence Lifetime. Fluorescence lifetime as measured by phase shift is quantified by the two-phase method (Meade, 1982) using two PSDs (see Fig. 8.4C below). A quadrature phase hybrid circuit is used to form two reference sine wave signals that are 90° out of phase with each other. These signals are input as references along with the modulated fluorescence signal to two PSDs, the outputs are expressed as
1 |
–a2(t–t )2 |
1 |
–a2(t–t )2 |
(8.4) |
v –90(t) mV sin e |
0 |
and v (t) mV cos e |
0 |
|
2 |
|
2 |
|
|
where is the signal phase shift [Eq. (2)] and R has been set to zero. The v –90(t)/v (t) ratio expression results in tan , which is directly proportional to the fluorescence decay time, expressed as
1 |
1 |
V ( –90) |
|
(8.5) |
tan |
|
|||
|
|
V( ) |
|
|
Where V( – 90) and V( ) are the peak values in Equation (4).
Fluorescence lifetime may also be determined by measuring the relative depth of amplitude modulation (m) of the emission signal (mem) with respect to the excitation signal (mex). The relative modulation or demodulation factor m is determined from the ratio
mem |
modulation of fluorescence |
|
1 |
(8.6) |
m |
cos 2 1/2 |
|||
mex |
modulation of excitation |
[1 |
( ) ] |
|
In the steady-state system it is only necessary to measure the ac and dc fluorescence emission and excitation signal components and determine the relative modulation by ratio calculations (Spencer and Weber, 1969). In our system, the amplitude demodu-
180 |
Fluorescence Lifetime Flow Cytometry |
lation factor may be determined by measuring the maximum and minimum signal components at the peak height of the Gaussian-shaped fluorescence detector output signal (Vem) and the ac and dc components of the steady-state laser excitation monitor signal (Vex) (see Fig. 8.1), either by digital (Deka et al., 1994) or analog methods (Steinkamp et al., 1998). The relative modulation is then expressed as
m |
(V |
– V ) |
/ |
(V |
– V ) |
(8.7) |
max min |
max min |
|||||
|
(Vmax |
Vmin) em |
|
(Vmax |
Vmin) ex |
|
The real-time ratio results in cos which is proportional to the fluorescence decay lifetime, expressed as
tan(cos–1 m)
(8.8)
The above equations are derived on the assumption of a single-component exponential decay of fluorescence from a homogeneous emitting fluorophore population. This is often cited as the major shortcoming of the single-frequency method, because the existence of a unique single-component decay is presupposed, but not demonstrated by the measurement. This is indeed true if only one of the two quantities, that is, lifetime by phase shift or amplitude demodulation, is measured. However, if both are measured, the existence of an exponential can be demonstrated. In the heterogeneous fluorophore population, the lifetime measured by the degree of amplitude demodulation will almost
F i g . 8.1. Conceptual diagram of single-frequency, fluorescence lifetime flow cytometer illustrating the laser excitation beam, modulator, modulated laser beam, beam splitter (BS), laser monitor, cell sample stream, cell-stream laser-beam intersection point in the flow chamber, fluorescence detector, modulated fluorescence and reference signals, and synthesized sine-wave signal generator. The modulated fluorescence signals are processed electronically to give conventional FCM signals, fluorescence lifetimes, and phase-resolved fluorescence signals.