

Matta, Boyd. The quantum theory of atoms in molecules
.pdf172 7 Solid State Applications of QTAIM and the Source Function
volved in four HBs, two within the tape, and two with neighboring tapes, giving rise to a relatively high experimental sublimation energy (21 G0.5 kcal mol 1). The urea structure seems to provide the only instance of a carbonyl atom which accepts four NaH O hydrogen bonds [36]. In addition to the expected intramolecular and intermolecular interactions, application of QTAIM to the experimental geometry crystal periodic wavefunction (RHF/6-31G**) reveals [3] two unique long N N intermolecular interactions between orthogonal (NaN, 3.433 A˚ , shown in blue in Fig. 7.1, right) and parallel (NaN, 4.267 A˚ ) molecular tapes. The complete set of CPs in the unit cell (16n, 34b, 26r, and 8c) fulfils Morse’s relationship [16] and it agrees with a recent experimental determination using synchrotron di raction data and detailed multipolar analysis [37]. (The CP set found in the first QTAIM study of the urea crystal [2] also fulfilled Morse’s relationship, but did not include the BCPs and RCPs related to the shorter of the two unique N N contacts. With the adoption of automated CP searches in TOPOND-98 (Section 7.2), the complete set of CPs reported in the text was found [3, 21]. This set has been carefully checked with the grid search option of TOPOND-98.) The CP set is obtained by assigning to each unique CP found by TOPOND-98 a multiplicity equal to the multiplicity of the Wycko position where this unique CP is located.
7.3.1.1Urea: Packing E ects
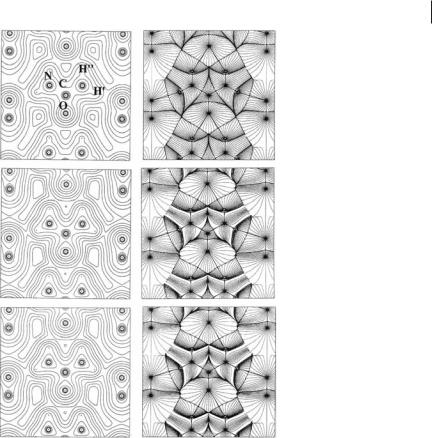
We start by obtaining an idea of the size of packing e ects on molecular electron density (ED) compared with the density changes resulting from molecule formation. Figure 7.2 shows r contour plots and ‘r trajectory maps in the molecular plane of a urea molecule in the crystal, for three di erent ED models. From top to bottom we see how the ED changes on going from the independent atom model (IAM) density [26], which is given by the sum of atomic densities with atoms being placed at the same positions as in the crystal, to the density resulting from superimposition of the EDs of isolated molecules placed at crystal positions [8], and, finally, to the ‘‘true’’ crystal ED. The ED changes because of the interaction density – the crystal density minus the superimposition of the density of isolated molecules – are, indeed, barely detectable whereas those resulting from the deformation density – the crystal density minus the IAM model – are much more evident. This is, for example, apparent from the noticeable change in the size of the atomic basins. Despite its smallness, the interaction density is responsible for the large (37%, vide infra) enhancement of the molecular dipole magnitude jmj in the crystal [2] and comparison of the atomic basins of the middle and bottom panels of Fig. 7.2 (right) immediately reveals how sensitive the values of jmj are to the location of the atomic boundaries and to the atomic ED distribution changes. The IAS determinations and the subsequent atomic basin integrations must be very accurate to enable proper evaluation of the molecular dipole enhancement jDmj occurring in the crystal. The changes of some topological properties at BCPs on passing from the IAM model to the isolated molecule at crystalline geometry (CG), then to the noninteracting molecules model, and finally to the crystal density are listed in Table 7.1. When the topological properties are analyzed,
7.3 QTAIM Applied to Molecular Crystals 173
Fig. 7.2 Electron density contour plots (left) and ‘r trajectories maps (right) in the molecular plane of a urea molecule in the crystal for three di erent ED models.
Top: IAM model; middle: noninteracting molecules model; bottom: crystal density periodic RHF model. In all models the molecules are placed at positions in the crystal and have crystal geometry. The noninteracting molecules and the crystal
periodic RHF densities look very much alike despite the 37% enhancement in the crystal of the molecular dipole magnitude. In the ‘r trajectory maps, note the NH00 O bond paths linking molecules along a tape (central part of each map) and the NH0 O bond paths providing cohesion of this tape with the two neighboring orthogonal tapes (left and right of each map).
the e ects resulting from the interaction density become clearly detectable. They are roughly one order of magnitude lower than those resulting from the deformation density for both intramolecular and intermolecular bonds. The molecular density and the sum of the noninteracting molecular densities are indistinguishable for intramolecular bonds. Conversely, the HBs, which are obviously absent in the isolated molecule, have, in the noninteracting molecules model, BCP properties already close to those in the crystal. This shows that the e ect of packing on the intramolecular is more evident than that on the intermolecular ED distribution

1747 Solid State Applications of QTAIM and the Source Function
Table 7.1 Changes of BCPs properties in urea with change of model density.[a,b]
Bond XxY |
r |
b |
(‘2r) |
b |
(l |
3 |
) |
b |
e |
|
|
|
|
|
b |
||||
|
|
|
|
|
|||||
CaO |
0.299 |
0.17 |
1.02 |
0.03 |
|||||
|
0.392 |
0.55 |
1.49 |
0.07 |
|||||
|
0.392 |
0.55 |
1.49 |
0.08 |
|||||
CaN |
0.381 |
0.33 |
1.75 |
0.00 |
|||||
0.264 |
0.20 |
0.52 |
0.04 |
||||||
|
0.341 |
0.94 |
0.73 |
0.05 |
|||||
|
0.341 |
0.94 |
0.72 |
0.05 |
|||||
NaH0, 1.009 A˚ |
0.349 |
1.15 |
0.53 |
0.10 |
|||||
0.235 |
|
|
1.05 |
0.01 |
|||||
0.39 |
|||||||||
|
0.345 |
1.92 |
0.78 |
0.06 |
|||||
|
0.345 |
1.91 |
0.77 |
0.06 |
|||||
NaH00, 1.005 A˚ |
0.344 |
1.95 |
0.88 |
0.05 |
|||||
0.237 |
|
|
1.07 |
0.01 |
|||||
0.40 |
|||||||||
|
0.351 |
1.92 |
0.71 |
0.06 |
|||||
|
0.351 |
1.92 |
0.71 |
0.06 |
|||||
O H0, 1.992 A˚ |
0.349 |
1.97 |
0.87 |
0.05 |
|||||
0.029 |
0.08 |
0.15 |
0.06 |
||||||
|
0.022 |
0.07 |
0.12 |
0.05 |
|||||
O H00, 2.058 A˚ |
0.022 |
0.07 |
0.12 |
0.07 |
|||||
0.026 |
0.07 |
0.13 |
0.05 |
||||||
|
0.019 |
0.07 |
0.11 |
0.01 |
|||||
|
0.019 |
0.07 |
0.11 |
0.04 |
|||||
|
|
|
|
|
|
|
|
|
|
a All quantities except distances in a.u. For each bond the first entry refers to the IAM model, the second to the molecular density, the third to the superimposition of noninteracting molecular densities, and the fourth to the crystal density. The urea molecule is at crystal geometry ([36], 12 K geometry) in all models. The hydrogen bonds have only three entries because they are clearly absent for the isolated molecule. b RHF/6-31G** wavefunction when appropriate.
[34]. The ED for the IAM model and for noninteracting molecules in the crystal were evaluated by use of the PATO and MOLSPLIT options, respectively, of CRYSTAL-98. The associated ODMs were then input to the TOPOND-98 software.
The percentage changes in the BCP properties of urea upon crystallization relative to those for the isolated molecule with the crystal geometry are listed in Table 7.2. (A full discussion of BCP and atomic property changes on crystallization, relative to the gas-phase molecule both with the crystal geometry and with the gas-phase optimized geometry (with C2v constraint), is given elsewhere [2]) Easy chemical understanding of these changes is immediately obtained by using the well known Bader and Essen [38] classification of bonds into shared-shell (‘2rb < 0) and closed-shell (‘2rb > 0) interactions, according to the sign of
|
|
|
|
|
7.3 QTAIM Applied to Molecular Crystals |
175 |
||||
Table 7.2 |
Percentage changes in the BCP properties and changes in the |
|
|
|
|
|||||
|
|
|
|
|||||||
atomic electron population and out-of-plane atomic quadrupole |
|
|
|
|
|
|||||
moment of urea on crystallization.[a,b,c] |
|
|
|
|
|
|
|
|||
|
|
|
|
|
|
|
|
|||
XxY |
DRx % |
Dr % D (‘2r)b% D (l3)b% Deb% |
W |
DN(W) |
DQ (W) |
|||||
|
|
b |
|
|
|
|
|
? |
|
|
CaO |
1.0 |
2.8 |
40.0 |
þ17.4 |
95.9 |
C |
þ0.032 |
0.07 |
|
|
CaN |
þ2.0 |
þ2.3 |
þ22.3 |
27.4 |
þ110.6 |
O |
þ0.092 |
þ0.08 |
||
NaH0 |
þ |
|
þ |
þ |
|
N |
þ |
þ |
||
1.5 |
0.3 |
1.6 |
12.8 |
20.3 |
0.087 |
0.36 |
|
|
||
NaH00 |
þ |
|
þ |
þ |
|
H0 |
|
|
|
|
2.9 |
0.6 |
2.6 |
22.5 |
25.0 |
0.053 |
|
|
|
||
|
|
|
|
|
|
H00 |
0.100 |
|
|
|
|
|
|
|
|
|
|
|
|
|
|
a Refs. [2, 21]; data refer to urea at the 12K neutron crystal geometry [36].
b For a given property P, DP% is evaluated as
DP% ¼ ½ðPcrystal PmoleculeÞ=Pmolecule& 100 whereas DP (P ¼ N; Q?Þ is given by DP ¼ Pcrystal Pmolecule.
c Rx, the BCP distance from the X atom, is positive (negative) when the BCP is displaced towards Y (X) in the crystal compared with the molecule in crystal geometry. Q?(W) is the out-of-molecular plane atomic quadrupole moment and a negative value denotes out-of-plane preferential accumulation of charge. A positive value for DQ?(W) indicates that in the crystal the electronic charge is partially moved from the out-of-plane to the molecular plane region.
‘2rb. Although too rigid, this dichotomous classification is usually valid for bonds among second-row atoms and it is particularly useful when applied on a relative basis [21]. It provides a set of quantitative indices [38] variation of which among a series of chemically related compounds or, as in this example, following a change of phase, pinpoint the e ect these perturbations have on the nature of a given bond [21]. For example, if, on passing from the gas to the crystal phase the
Gb=rb and ðl3Þb values of a bond decrease and the rb, ‘2rb, and jl1; 2; bj=ðl3Þb values all increase, this bond, upon crystallization, has become more covalent;
the reverse is true if the opposite changes occur. As shown in Table 7.2, for the CaN bond the rb and ‘2rb values increase and its parallel curvature largely decreases whereas the opposite changes occur for the CaO bond on passing from the molecule to the bulk. The NaH bonds undergo a negligible rb decrease accompanied by a noticeable (l3Þb increase. All these changes indicate that the CaO and NaH bonds become more polar and weaker whereas the covalence and strength of the CaN bond are enhanced on HBs formation in the crystal. Because of their link with the second derivative of the electron density, ð‘2rÞb, ðl3Þb, and eb seem more sensitive indices of crystal field e ects than rb values, the changes of the second derivative-related quantities being at least an order of magnitude greater than those of rb. For bonds such as CaO and CaN the greater their bond ellipticity, eb, the larger the extent of their p character. On crystallization, the double-bond character of CaN is substantially increased whereas for the CaO

176 7 Solid State Applications of QTAIM and the Source Function
bond this character is diminished, in agreement with the changes of the other BCP indices. As expected, the N quadrupole moment component perpendicular to the molecular plane is found to increase in the bulk (DQ?ðNÞ ¼ 0:36 au, Table 7.2), because electronic charge is removed from the out-of-plane lone pairs and placed in the CaN bond region [2]. (A negative value of Q?ðWÞ denotes out-of- plane preferential accumulation of charge [6].) The small increase found for Q?ðOÞ in the bulk is a result of more uniform electron charge concentration in the nonbonding regions, because of formation of its four HBs (vide infra).
The BCP displacements upon change of phase (DRx values in Table 7.2) are smaller for the more polar bonds, because the crystal field may less easily polarize this kind of bond. BCPs displace in such a way as to reduce the size of the H atoms and thus make them more positively charged in the bulk (Table 7.2). All heavy atoms, in contrast, have their population increased, the net result being a more polarized molecule, a larger dipole moment, and a flux in the crystal of 0.066 electrons from each amino group hydrogen donor to the carbonyl group acceptor. Table 7.3 shows that the molecular dipole moment magnitude jm j increases in the crystal by 37% and by 53% relative to the isolated molecules in the crystal and optimized geometry, respectively. As detailed in Table 7.3, the large dipole moment increase in the bulk is primarily as a result of a large increase of the magnitude of the charge-transfer component mCT, which contributes 88% and to 73% of the reported enhancements. The concomitant decrease of the first moment component, mA, because of the general reduction of atomic polarization on crystallization, serves only to slightly enhance the e ect resulting from charge transfer (CT), because, as typically found, the atomic polarization contribution opposes the CT contribution [6].
Table 7.3 Urea. Changes of the molecular dipole moment and of its atomic and charge-transfer components on crystallization.[a,b]
Contribution |
OG Molecule |
CG Molecule |
Crystal |
|
|
|
|
|
|
mA, (DjmA|%) |
0.71 |
0.54 |
0.45 |
( 16.7) |
mCT, (DjmCT|%) |
2.52 |
2.56 |
3.22 |
(þ25.8) |
m, (Djmj%) |
1.81 |
2.02 |
2.77 |
(þ37.1) |
a Ref. [2]; OG and CG refer to gas-phase optimized geometry (C2v constraint) and crystal geometry isolated molecules. All quantities in a.u. b The dipole component parallel to the C2 axis (directed from C to O atoms) is reported. Because of the C2v symmetry of the molecule, this is the only nonvanishing component; mA and mCT are the first moment and the charge-transfer components of the total dipole moment m. The percentage dipole changes are evaluated as:
DjPj% ¼ ½ðjPcrystalj jPCGmoleculejÞ=jPCGmoleculej& 100, for
P ¼ mA; mCT; m.
7.3 QTAIM Applied to Molecular Crystals 177
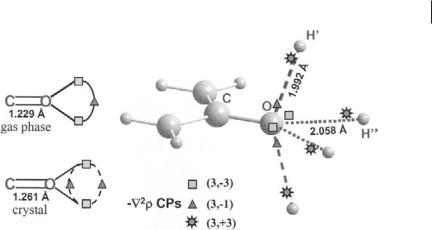
Fig. 7.3 Hydrogen bonds in the urea crystal and the ‘2r distribution. Left: On crystallization, the CO bond lengthens and the in-plane single saddle point linking the two O lone pair nonbonded ‘2r maxima bifurcates into two saddle points lying one above and the other below the molecular plane. Right: The O atom in the bulk may thus become involved in four NH O hydrogen bonds (HBs). The in-plane HBs (dotted lines) are formed by aligning the ð3; þ3Þ charge depletions (CDs) of the two H00 atoms of another molecule along a tape with
the two O lone pair charge concentrations. The two out-of-plane HBs (dashed lines) exploit the alignment of the ð3; þ3Þ charge depletions of H0 atoms of two neighboring orthogonal tapes with the two ð3; 1Þ O saddle points formed by the CO bond lengthening in the bulk. The saddle points are much better aligned with the H0 CDs than are the nonbonded maxima with the H00 CDs. This explains why the out-of-plane HBs are shorter and stronger than the in-plane HBs.
Careful analysis of the Laplacian CPs, in the valence shell charge concentration (VSCC) of the oxygen atom, provides an explanation of how this atom can form four NH O bonds in the bulk [2]. In the urea molecule, in its C2v optimized geometry, the two ð3; 3Þ ‘2r nonbonded maxima (NBMs) associated with the O atom lone pairs are linked by a ð3; 1Þ ‘2r saddle point, lying in the molecular plane (Fig. 7.3). The CO bond noticeably elongates in the crystal, from 1.229 to 1.261 A˚ , and as a result, this in-plane single saddle point bifurcates into two saddle points lying above and below the molecular plane (Fig. 7.3). Correspondingly, the two NBMs decrease in value, from 5.921 in the OG molecule to 5.669 a.u. in the crystal, whereas the charge concentration at the saddle point increases from 3.869 to 3.913 a.u., even though this point bifurcates in the bulk. The oxygen NBMs are the most electron-rich region in urea and their ‘2r value greatly exceeds the value of other charge concentrations (CCs) in the molecule, including those of the potentially competing NBMs (2.022 a.u.) associated with the N lone pair [2]. Conversely, the two ð3; 1Þ saddles interconnecting the oxygen NBMs are the second most electron-rich regions in the molecule and they are seen as maxima by the ð3; þ3Þ charge depletions (CDs) of H atoms approaching the oxygen VSCC in a plane containing the CaO axis and perpendicular to the molecular plane. HBs can thus be formed either approaching the ð3; 3Þ NBMs or the two

178 7 Solid State Applications of QTAIM and the Source Function
saddles interconnecting them. Both options are exploited in bulk urea and each O atom thus becomes involved in four HBs. The oxygen VSCC changes in such a way as to form a torus of nearly uniform charge concentration in its nonbonded region, which increases its capability to form more than two HBs, and which agrees with the discussed increase of Q?ðOÞ and the decrease of the CaO bond p character occurring in the bulk. It is worth noting that the bifurcation of the saddle point interconnecting the two oxygen NBMs also occurs in the isolated urea molecule, if the crystal geometry is adopted. Thus, the lengthening of the CaO bond in bulk urea, with the ensuing loss of the CaO bond p character and changes in the oxygen nonbonded regions, seems to be a key step in the onset of the observed 3D HB network in the bulk. A rationale for the out-of-plane HBs being shorter (1.992 A˚ ) than the in-plane HBs is given elsewhere [2]. Basically, the oxygen ð3; 1Þ saddle points may be much more easily aligned to their facing hydrogen ð3; þ3Þ CDs than is possible for the oxygen NBMs.
Table 7.4 lists the individual atomic volumes and their sum over a molecule or over the atoms of the aCO and aNH2 functional groups for the urea molecule in the crystal and in the gas phase (CG and OG geometries). This table reveals how the atomic size of the di erent atoms or groups of atoms in the molecule changes on crystallization and how the molecular volume contraction observed in the solid occurs.
For the gas-phase molecules, the volumes determined using the 0.001 (V1) and the 0.002 a.u. (V2) density envelope are reported, and the basin total volumes, VT, also are given for the crystal, because of their finite size in the condensed phase.
Table 7.4 Urea. Changes of the molecular, atomic, and functional group volumes on crystallization.[a]
W |
OG Molecule |
CG Molecule |
Crystal |
|
|
||||||
|
|
|
|
|
|
|
|
|
|
|
|
|
V1 |
V2 |
V1 |
V2 |
V1 |
V2 |
VT |
||||
|
|
|
|
|
|
|
|
||||
C |
18.7 |
17.4 |
19.9 |
18.5 |
21.0 |
19.1 |
21.2 |
||||
O |
129.7 |
108.9 |
132.2 |
111.1 |
115.6 |
104.6 |
124.3 |
||||
N |
118.0 |
100.8 |
117.9 |
101.4 |
120.2 |
107.5 |
135.0 |
||||
H0 |
24.7 |
18.9 |
24.6 |
18.8 |
16.8 |
15.3 |
17.7 |
||||
H00 |
26.7 |
20.2 |
27.4 |
20.8 |
18.2 |
16.3 |
18.7 |
||||
CO |
148.4 |
126.3 |
152.1 |
129.6 |
136.6 |
123.7 |
145.5 |
||||
NH2 |
169.4 |
139.8 |
170.0 |
140.9 |
155.2 |
139.1 |
171.4 |
||||
Molecule |
487.3 |
406.0 |
492.2 |
411.5 |
447.0 |
401.8 |
488.2 |
||||
|
|
|
|
|
|
|
|
|
|
|
|
a Ref. [2]; V1 and V2 are the volumes of the portion of the atomic basins where r is equal to or exceeds 0.001 or 0.002 a.u., respectively. VT is the total volume of the atomic basin; its value is finite only in the bulk.

7.4 QTAIM Applied to Surfaces 179
The computed total molecular volume in the crystal (488.2 a.u.) reproduces extremely well the volume per molecule in the unit cell (489.5). As a reaction of the molecules to the intermolecular exchange forces, the molecular volume reduces on crystallization by approximately 10% if the V1 values are compared and by about 2% if the V2 values are considered, with VT being very close to V1 in the gas phase. V2 is approximately 90% and 83% of V1 in the bulk and gas phases, respectively, indicating that the molecular density dies o more rapidly in the bulk than in the gas phase. Interestingly, the reported trends do not apply to the individual atomic basins, but they do to the aCO and aNH2 groups. This suggests that the two functional groups respond as the whole molecule to the change of phase, despite their constituting atoms reacting in quite di erent ways to the same perturbation. The contraction of the molecular volume on crystallization originates primarily from contraction of the atomic basins directly involved in the hydrogen bonds. For other atoms a small expansion is observed. The substantial decrease of oxygen (DV2 ¼ 6%) and hydrogen (H0, DV2 ¼ 19%; H00, DV2 ¼ 28%) atomic volumes is related to the mutual penetration of their van der Waals envelopes after HB formation. Penetration is measured by the di erence, DR, between the nonbonded radius of the H or of the O in the isolated molecule and the distance from the corresponding atoms to the HB CP in the crystal. (The nonbonded radius is taken as the average distance from the nucleus to the 0.001 a.u. contour in the isolated molecule [6].) The DR values are, as expected, higher for the shorter HB (H: 0.70; O: 0.56 a.u.) than for the longer HB (H: 0.59 and O: 0.54 a.u.) and the HB bond length di erence results mostly in H0 being penetrated much more e ciently than H00.
7.4
QTAIM Applied to Surfaces
Several experimental techniques are now available for obtaining qualitative information on the geometrical reconstructions which occur at semiconductor surfaces. The electronic structure and, especially, accurate EDD of the surface are much less accessible experimentally [39, 40]. In contrast, not only do ab-initio periodical calculations of model surfaces usually reproduce the observed geometrical distortions satisfactorily, but also do a ord a fairly accurate description of both the electronic structure and the EDD at the surface [41]. QTAIM analysis of the ab-initio wavefunctions then results in valuable, quantitative insight into the interplay between geometrical reconstructions, electronic relaxations, and bonding [42, 43].
QTAIM enables one to address very basic and important issues, for example:
How is the bonding of the surface atoms a ected?
What is a ‘‘dangling’’ bond and how are its properties modified by surface reconstruction?
How rapidly do the surface perturbations and the changes in these perturbations that result from the adsorption process

180 7 Solid State Applications of QTAIM and the Source Function
decay into the crystal in terms of the properties of the atoms in each of the succeeding layers?
What are the charges on the surface atoms on a free surface and in the chemisorbed states?
How much electronic charge is transferred and in what direction?
What is the atomic origin and nature of the surface ‘‘double layer’’?
What atoms are exposed on a particular chemisorbed or clean surface?
How can the surface character of an atom be defined?
Answers to these questions are given below for the Si (111)(1 1) clean and hydrogen-covered surfaces [42] and for the well known (2 1) reconstruction of the (111)(1 1) surface [43].
7.4.1
Si(111)(1D1) Clean and Hydrogen-covered Surfaces
The Si(111)(1 1)aH surface, in which all the silicon dangling bonds (DBs) are saturated by a single monolayer of hydrogen atoms, is one of the most ideal and simple semiconductor surfaces [44]. The clean Si(111)(1 1) surface, in which the DBs of the threefold-coordinated atoms of the first layer are not allowed to form bonds, is an ideal surface, which is not found in nature and which serves here and in the next discussed example for comparison purposes. These two surfaces were both described [42, 43] using the slab model (SLAB keyword) in the CRYSTAL program. A slab is a 2D periodic structure with two infinite periodic surfaces parallel to a crystalline plane (111, in our case), and a finite thickness, defined by the number of layers of atoms considered. Definition of a proper slab thickness is not a trivial task and the reader is referred to the original paper for technical details [42]. Stick-and-ball representations of the adopted centrosymmetric ten-layer slab models for the two surfaces are shown in Fig. 7.4 (top). In Tables 7.5 and 7.6 their bond and atomic properties are listed as a function of depth from surface and compared with corresponding data for the Si bulk and the SiH4 molecule. Labeling of the Si atoms, with Si1 being an Si atom in the outermost Si layer, is reported in Fig. 7.4 (top). Bonding patterns in a plane normal to the slabs’ surfaces and containing nuclei Si1 to Si5 are made evident by the ‘r trajectories portrayed in Fig. 7.4 (middle).
The large CT from Si1 to H induces noticeable asymmetry (DBCP values, Table 7.5) of the surface Si1aSi2 back bonds which become stronger (rb, ‘2rb, l3 values, Table 7.5) than in the bulk, whereas in the clean slab these same bonds are weakened compared with the Si crystal, in accordance with the well-known propensity of the (111)(1 1) surface to evolve in favor of other reconstructions (Section 7.4.2). Analysis of the dependence of SiaSi bond properties on depth from the surface indicates that starting from Si2aSi3 bond in the hydrogen-

Fig. 7.4 Si(111)(1 1)aH, Si(111)(1 1) and Si(111)(2 1) surfaces. Top: Adopted slab models and labeling of the atomic layers. For the reconstructed Si(111)(2 1) surface, only half of the centrosymmetric slab is shown. On reconstruction, the surface dangling bonds are on nearest-neighbor sites rather than on next-nearest-neighbor sites. In Si(111)(2 1) there are two layers of chainbonded atoms, a top layer (Si1 and Si2) of threefold-coordinated atoms and a lower layer (Si3 and Si4) of fourfold-coordinated atoms. Middle: ‘r trajectories and bonding pattern in planes normal to the slabs’ surfaces and containing the Si1 to Si5 nuclei [Si(111)(1 1); Si(111)(1 1)aH] or (right)
7.4 QTAIM Applied to Surfaces 181
Si1aSi4 bonds [Si(111)(2 1)]. Bottom: ‘2r contour plots in the same planes of the ‘r trajectories for the Si(111)(1 1)aH and Si(111)(1 1) slabs. In the reconstructed Si(111)(2 1) surface (right), contour plots in five di erent planes normal to the surface are juxtaposed to show the whole bonding network among the atoms of the two outermost layers. Adapted, with permission, from Figs. 2 and 3 of Ref. [42], F. Cargnoni, C. Gatti, E. May, D. Narducci, J. Chem. Phys. 2000, 112, 887–899 (Copyright 2000, American Institute of Physics) and from Figs. 1, 3, and 4 of Ref. [43], F. Cargnoni, C. Gatti,
Theor. Chem. Acc. 2001, 105, 309–322 (Copyright 2001, Springer).
covered and from Si3aSi4 bond in the clean surface, the SiaSi bonds become bulk-like.
The negatively charged H layer [q(H) ¼ 0:736] in the hydrogen-covered slab is almost entirely balanced [q(HþSi1þSi2) ¼ þ0:015] by the first two Si layers, with more than 94% of the compensating charge coming from Si1 atoms [q(Si1) ¼ þ0:698]. Distortions in the charge of surface cells are often treated [45] in terms of a uniform macroscopic surface density of dipoles. In this representa-