

The Physics of Coronory Blood Flow - M. Zamir
.pdf2.6 Elasticity of the Tube Wall: Capacitance |
57 |
eliminate the possibility of local changes in volume that would occur in wave propagation. Thus, the model depicts change in total volume only, consistent with the capacitance e ect in isolation.
p0
p1
qc |
p1 |
qr |
p0 |
q
Fig. 2.6.1. Capacitance e ect of flow in an elastic tube can be modelled by flow into a rigid tube with a balloon attached at one end. Flow rate q entering the system may go into the balloon or into the tube or both. Pressure p1 at entry into the system is equal to pressure prevailing inside the balloon. Pressure at exit from the rigid tube is p0, the same as that outside the balloon.
Initially, we consider the entrance to the balloon to be at entrance to the tube, so that pressure p1 at entry into the system is equal to pressure prevailing within the balloon. Pressure outside the balloon and at exit from the tube is p0. Flow through the tube and flow into the balloon are thus in parallel, in the sense that they can occur independently of each other.
Flow through the tube, to be denoted by qr , is determined by the viscous resistance R and by the pressure di erence Δp, as found previously (Eq. 2.4.3), namely
qr = |
Δp |
|
(2.6.1) |
|
R |
||||
|
|
|||
where |
|
|
|
|
Δp = p0 − p1 |
(2.6.2) |
|||
For flow into the balloon we note first that the balloon is in an inflated state when pressure inside the balloon is higher than pressure outside it, that is when
p1 > p0, Δp < 0 |
(2.6.3) |
If the volume of the balloon in this state is v, then the capacitance C which is a measure of the compliance of the balloon is usually defined by the amount
58 2 Modelling Preliminaries
of change in the pressure di erence Δp required to produce a change Δv in the volume of the balloon, that is
|
Δv |
|
C = |
|
(2.6.4) |
|
||
|
(Δp) |
|
The notation in the denominator emphasizes that it is not the pressure di erence Δp that produces the change in volume but a change in that pressure di erence. Also, in this form it is seen that a higher value of C represents a balloon that requires less change in Δp to produce a given change in volume, that is a balloon that is more elastic, or more compliant.
In coronary blood flow and blood flow in general the change in volume Δv is not a useful entity to work with because it is not easily accessible. A more useful entity is the capacitive flow rate qc representing the amount of flow going into or out of the balloon, which can be related to Δv in the following way. As before, we assume that fluid is incompressible, hence the only way to change the volume of the balloon is to change the amount of fluid within it, that is to have a nonzero flow rate qc going into or out of the balloon. If a constant flow rate qc occurs over a time interval Δt, the corresponding change in volume of the balloon will be
Δv = qcΔt |
(2.6.5) |
|||||
Substituting this into Eq. 2.6.4 we then have |
|
|||||
C = |
|
qcΔt |
|
(2.6.6) |
||
|
(Δp) |
|||||
|
|
|
||||
therefore |
|
|
|
|
||
qc = C |
(Δp) |
(2.6.7) |
||||
|
|
|
||||
Δt |
||||||
|
|
|
||||
More generally, if Δp is a continuous function of time, then qc correspondingly becomes a function of time, given by
qc = C |
d(Δp) |
(2.6.8) |
|
dt |
|||
|
|
This result shows clearly, again, that flow rate into the balloon depends not on the pressure di erence Δp but on the rate of change of that di erence. Also, by noting that total flow rate q into the system must be the sum of flow rates into the balloon and the tube, that is
q = qc + qr |
(2.6.9) |
we see clearly that, because of the capacitance e ect, flow rate q into the system is not necessarily equal to flow rate qr out of the system.
2.6 Elasticity of the Tube Wall: Capacitance |
59 |
If the pressure p0 at exit from the tube and outside the balloon is now fixed, then flow into the system is controlled by only one remaining variable, namely the input pressure p1. Under these conditions we consider the following three scenarios.
If the input pressure p1 is constant, that is, if
Δp = Δp0 |
(2.6.10) |
where Δp0 is a constant, then Eqs.2.6.1,8 give
qr = |
Δp0 |
|
R |
|
|
|
|
|
qc = 0 |
(2.6.11) |
|
Thus, in this case flow is entirely through the tube. Flow into the balloon is zero because the rate of change of Δp is zero (although Δp itself is not zero). The volume of the balloon remains unchanged in this case. The balloon comes into play only when Δp is a function of time, which occurs if p1 is a function of time.
If, for example, p1 increases linearly with time, then the pressure di erences across the tube and across the balloon will also increase linearly with time, say
Δp = |
Δp0 |
t |
(2.6.12) |
|
|||
|
T |
|
|
where Δp0 is a constant as before, t is time, and T is a fixed interval of time over which the change is taking place, which we introduce as in the previous section in order that Δp0 retains the physical dimensions of pressure, then Eqs.2.6.1,8 now give
qr = |
Δp0 |
|
t |
|
||
R |
T |
|
||||
|
|
|||||
qc = C |
Δp0 |
|
(2.6.13) |
|||
|
||||||
|
|
T |
|
|
|
|
There is constant flow into the balloon in this case, because the rate of change of Δp with time is constant. Flow through the tube increases linearly with time as Δp increases with time. To compare the two graphically it is easier to put them in nondimensional forms, namely
|
|
= |
qr |
= |
|
t |
|
|
|
q |
r |
|
|||||||
Δp0/R |
T |
|
|||||||
|
|
|
|
||||||
|
|
|
|
|
|||||
|
|
= |
qc |
= |
RC |
(2.6.14) |
|||
q |
c |
||||||||
Δp0/R |
|
T |
|||||||
|
|
|
|
|
|||||
|
|
|
|
|
|
||||
The product RC is seen to have the physical dimensions of time and is usually referred to as the “capacitive time constant”. We shall denote it by tc, in analogy with the inertial time constant (tL), and define it by
60 2 Modelling Preliminaries
tc = RC |
(2.6.15) |
thus the two flow rates in nondimensional form are finally given by
|
|
= |
qr |
= |
t |
|
|
q |
r |
|
|||||
Δp0/R |
T |
|
|||||
|
|
|
|
||||
|
|
|
|
|
|||
|
|
= |
qc |
= |
tc |
(2.6.16) |
|
q |
c |
||||||
Δp0/R |
T |
||||||
|
|
|
|
||||
|
|
|
|
|
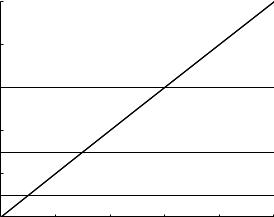
Fig. 2.6.2 compares these flow rates at di erent values of tc. We recall that higher values of tc (= RC) are associated with higher compliance, allowing more flow to go into the balloon. Therefore, as seen in the figure, capacitive flow is constant at a value in fact equal to tc/T , while resistive flow (flow through the tube) increases linearly as t/T .
flow rate (nondimensionalized)
1 |
|
|
|
|
|
|
0.8 |
|
|
|
|
|
|
0.6 |
|
|
|
|
|
tc / T=0.6 |
|
|
|
|
|
|
|
0.4 |
|
|
|
|
|
tc / T=0.3 |
|
|
|
|
|
|
|
0.2 |
|
|
|
|
|
tc / T=0.1 |
|
|
|
|
|
|
|
00 |
0.2 |
0.4 |
0.6 |
0.8 |
1 |
|
|
|
|
time t / T |
|
|
|
Fig. 2.6.2. Comparison of resistive (solid) and capacitive (dashed) flow rates when the driving pressure Δp is increasing linearly with time over a time interval T and at three di erent values of the capacitive time constant tc. In all cases, capacitive flow is constant since it depends on the rate of change of Δp, while resistive flow increases linearly with time since it depends on Δp itself. Higher values of the capacitive constant tc correspond to higher compliance, thus allowing more flow into the balloon.
Finally, an important scenario to consider is that in which the pressure di erences across the tube and across the balloon is oscillatory, say
Δp = Δp0 sin ωt |
(2.6.17) |
where Δp0 is a constant and ω is the angular frequency of oscillation. In this case Eqs.2.6.1,8 give
2.6 Elasticity of the Tube Wall: Capacitance |
61 |
|
8 |
|
|
|
|
|
|
6 |
|
|
|
tc / T=1 |
|
(nondimensionalized) |
|
|
|
|
|
|
4 |
|
|
|
tc |
/ T=0.5 |
|
|
|
|
|
|||
2 |
|
|
|
tc / T=0.1 |
||
|
|
|
|
|||
0 |
|
|
|
|
|
|
−2 |
|
|
|
|
|
|
rate |
|
|
|
|
|
|
−4 |
|
|
|
|
|
|
flow |
|
|
|
|
|
|
−6 |
|
|
|
|
|
|
|
|
|
|
|
|
|
|
−80 |
0.2 |
0.4 |
0.6 |
0.8 |
1 |
|
|
|
time t / T |
|
|
|
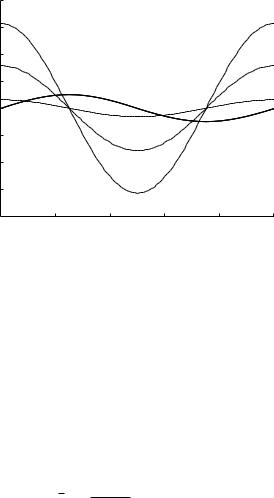
Fig. 2.6.3. Comparison of resistive (solid) and capacitive (dashed) flow rates when the driving pressure Δp is an oscillatory function of time of period T . The resistive flow (solid) has the same form as the driving pressure since inertial e ects are not included here and since it is una ected by the value of the capacitive time constant tc. The capacitive flow (dashed) in each cycle, on the other hand, is higher with higher values of tc because of higher compliance of the balloon.
qr = |
Δp0 |
sin ωt |
|
R |
|
||
|
|
|
|
qc = Δp0ωC cos ωt |
(2.6.18) |
||
As expected, both qc and qr are oscillatory functions of time, with the same frequency as the driving pressure, namely ω. To compare the two it is more appropriate to put them in nondimensional forms, namely
qr
qr = Δp0/R = sin ωt
|
|
= |
qc |
= ωtc cos ωt |
(2.6.19) |
||
qc |
|||||||
|
|
||||||
|
|
Δp0 |
/R |
|
|
||
The two flows are compared graphically in Fig. 2.6.3, where it is seen that how much of the flow goes into the balloon in each cycle depends on the value of the capacitive time constant tC . As in the previous case, higher values of the tc correspond to higher compliance, thus allowing more flow into the balloon. The resistive flow, on the other hand, is una ected by the value of tc and has the same form as the driving pressure, noting that inertial e ects are not included here.
The results of this section illustrate the important role that capacitance plays in the dynamics of oscillatory flow in a compliant system, and hence its
62 2 Modelling Preliminaries
important role in the dynamics of the coronary circulation. While the structure of the coronary vascular system is far more complicated than the simple system in Fig. 2.6.1, the compliance of the system is known to play a role similar to that depicted in Fig. 2.6.1. A key question in the coronary circulation is how much of the oscillatory component of coronary blood flow goes into simply inflating and deflating the volume of the system, and how much goes into forward flow? This question is not properly addressed in the example of Fig. 2.6.1 because the driving pressure used here is a simple harmonic (Eq. 2.6.17) which produces only symmetrical back and forth flow in the rigid tube of Fig. 2.6.1. In coronary blood flow the driving pressure is a more complicated waveform which has a net forward component and some harmonic components. Because the forward and the oscillatory parts of the flow are not entirely separable from each other, capacitance of the system a ects both, and much of the work in this subject is aimed at determining the nature and magnitude of this e ect [98, 97].
2.7 Elasticity of the Tube Wall: Wave Propagation
As stated in the previous section, a fundamental di erence between flow in a rigid tube and flow in an elastic tube is that a local change of pressure in a rigid tube is transmitted instantaneously to every part of the tube while in an elastic tube the change is transmitted with a finite speed. The reason for this is that a local increase in pressure in an elastic tube is able to stretch the tube wall outward, forming a local bulge, and when the change in pressure subsides, the bulge recoils and pushes the excess fluid down the tube [124]. The increase in pressure and the bulge associated with it propagate down the tube like the crest of an advancing wave. This scenario is not possible in a rigid tube because fluid in that case cannot stretch the tube wall, and because, as stated earlier, we assume throughout this discussion that the fluid is incompressible. It is for these two reasons that the local change in pressure in a rigid tube is transmitted instantaneously to every part of the tube. Wave propagation is not possible in a rigid tube.
If a change in pressure occurs at some interior position along an elastic tube, the change will propagate equally in both directions, towards both ends of the tube, as illustrated in Fig. 2.7.1. A scenario of more practical interest, however, is that in which a change in pressure occurs at one end of the tube and propagates in one direction towards the other end, which happens, for example, when a pump is placed at one end of a tube to drive the flow, or simply when there is a change in the pressure di erence driving the flow. In this case wave propagation is in only one direction, namely from entrance to exit, as illustrated in Fig. 2.7.2, and this is the case we discuss in what follows under the general heading of wave propagation. However, the possibility exists that a wave propagating in one direction may be totally or partially reflected by an obstacle [221], thus leading to a secondary wave moving in the opposite
2.7 Elasticity of the Tube Wall: Wave Propagation |
63 |
||||||||||
|
|
|
|
|
|
|
|
|
|
|
|
|
|
|
|
|
|
|
|
|
|
|
|
|
|
|
|
|
|
|
|
|
|
|
|
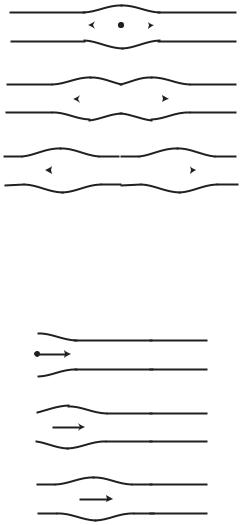
Fig. 2.7.1. A local change in pressure at an interior point in an elastic tube will propagate equally in both directions, towards the two ends of the tube.
direction as illustrated in Fig. 2.7.3. This will be discussed later in the book under the heading of wave reflections. Thus, in this section we consider only a primary wave moving from one end of an elastic tube to the other end.
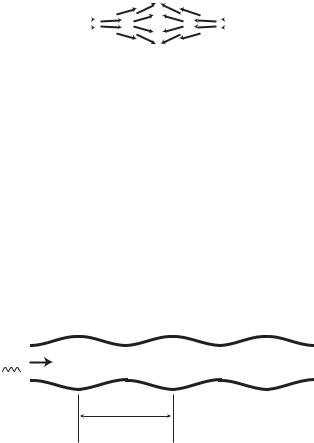
Fig. 2.7.2. A wave propagation scenario of more practical interest is that in which a change in pressure occurs at one end of a tube and propagates to the other end. This occurs, for example, when flow is driven by the stroke of a pump at the tube entrance, or simply when there is a change in the pressure di erence driving the flow.
When considering flow in an elastic tube, it is useful to distinguish between wave motion and fluid motion. If the flow is driven by an increase in pressure at the tube entrance, for example, then wave motion refers to the forward motion of the local swelling or bulge in the tube caused by the increase in pressure, as illustrated in Figs. 2.7.2, 3, much like the motion of the crest of a wave on the surface of a lake. The speed at which the bulge advances along
64 2 Modelling Preliminaries
the tube is referred to as the wave speed. Fluid motion, on the other hand, refers to the motion of fluid elements within the tube, associated with that wave motion. As the wave crest passes each position along the tube, fluid elements at that location are first swept towards the local bulge in the tube, as illustrated schematically in Fig. 2.7.4, and then as the wave passes and the bulge subsides they are swept back by the decreasing pressure. The situation is again much the same as that experienced by a floating or submerged body swept by the passage of the crest of a wave on the surface of a lake.
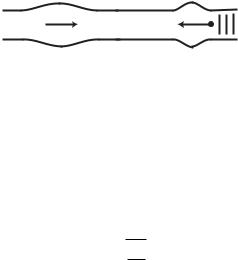
Fig. 2.7.3. A wave moving in one direction along an elastic tube may be reflected totally or partially by an obstacle, resulting in a secondary wave moving in the opposite direction.
The wave speed c in an elastic tube depends on the elasticity of the tube, a simple measure of that elasticity being the Young’s modulus E, sometimes also referred to as the modulus of elasticity. The value of c also depends on the diameter d of the tube and its wall thickness h, and on the density ρ of the fluid. An approximate formula for the speed in terms of these properties is the so called Moen-Korteweg formula [168, 135, 34, 141]
c = |
Eh |
(2.7.1) |
ρd |
The formula is only approximate because it does not take into account some dependence of the wave speed on viscosity of the fluid. Also, the formula is based on the assumption that the wall thickness h is small compared with the tube diameter. Despite these limitations the formula can be used to provide an estimate of the wave speed in the cardiovascular system. This is possible if it is further assumed that an average wall-thickness-to-diameter ratio h/d above can be taken for the entire system, which leaves c dependent on E and ρ only. Thus, taking E = 107 dyne/cm2, ρ = 1 g/cm3, and h/d = 0.1, we find c = 1000 cm/s which, in order of magnitude, is a representative estimate of the wave speed in the cardiovascular system.
If the pressure at the entrance of an elastic tube does not merely rise once but rises and falls in an oscillatory manner, the result is a train of wave crests moving in tandem along the tube, the distance between two consecutive crests being referred to as the wave length L, as illustrated in Fig. 2.7.5. Fluid motion within the tube then consists of back and forth movements everywhere along the tube as consecutive wave crests pass by. This situation provides a basic working model for flow in the cardiovascular system where the driving
2.7 Elasticity of the Tube Wall: Wave Propagation |
65 |
|
|
|
|
|
|
|
Fig. 2.7.4. As a wave crest passes each position along an elastic tube, fluid elements at that location are first swept towards the local bulge in the tube and then, as the crest passes and the bulge subsides, they are swept back by the decreasing pressure. This fluid motion is to be distinguished from the wave motion, illustrated in Figs. 2.7.1–3, which is concerned with only the motion of the wave itself. Fluid motion is shown above only schematically in order to illustrate the di erence between fluid motion and wave motion, the motion of fluid elements is actually considerably more complicated.
pressure generated by the heart rises and falls in a periodic manner. If the frequency of oscillation is f cycles/s (Hz), then the wave length is related to the wave speed by
L = |
c |
(2.7.2) |
|
f |
|||
|
|
P0(t)
L
Fig. 2.7.5. If the pressure at the entrance of a tube does not change only once but continuously, in an oscillatory manner, the result is a train of wave crests moving along the tube, or what is commonly referred to as wave propagation. The distance L between two consecutive crests is referred to as the wave length.
If the frequency of oscillation of the pressure pulse generated by the heart is taken as 1 Hz, then an estimate of the wave length based on the above estimate of the wave speed is L = 1000 cm. The wave length is shorter at higher frequency, being only 500 cm at a frequency of 2 Hz. More important, the pressure pulse generated by the heart is actually a composite wave consisting of many so called harmonic components. Each harmonic component is a perfect sine or cosine wave but has a di erent amplitude and di erent frequency. The frequency of the pressure pulse generated by the heart represents only the so-called fundamental frequency, that is, the frequency of the first harmonic component which is referred to as the fundamental harmonic. The frequency of the second harmonic is double the fundamental frequency, and
66 2 Modelling Preliminaries
the frequency of the third harmonic is three times the fundamental frequency, and so on. Thus, the higher harmonics have increasingly shorter wave lengths.
Finally, wave speed and wave length are a ected by the degree of elasticity of the vessel wall, via the value of Young’s modulus E in Eq. 2.7.1. More rigid walls have higher values of E and therefore lead to higher wave speeds and higher wave lengths, which is relevant to blood vessels as they become more rigid, generally with age or more locally because of disease. In the limiting case of a totally rigid tube, E is infinite and hence both the wave speed and wave length become infinite. Wave propagation is therefore not possible in a rigid tube, clearly because a local increase in pressure cannot stretch the tube radially outward and thereby start the propagation process. Nevertheless, it is sometimes convenient to think of wave propagation in a rigid tube as one in which the wave speed is infinite, with a change in pressure at one end reaching all parts of the tube with infinite speed, that is instantaneously, as stated briefly in the previous section. Indeed, if the driving pressure at the entrance of a rigid tube changes in an oscillatory manner, the entire body of fluid within the tube oscillates back and forth in unison, which is not to be confused with wave propagation [221].
One of the most important e ects of wave propagation in an elastic tube is the possibility of wave reflections. Wave reflections arise when a wave meets a change in one of the conditions under which it is propagating, such as the diameter or elasticity of the tube, or more generally any change in the resistance to wave propagation along the tube. It is important to distinguish between the resistance to flow in a tube and the resistance to wave propagation in that tube. The first represents the opposition to flow in a tube caused by the viscous shear at the tube wall, and is usually referred to as “pure resistance” or simply resistance. The second represents the opposition to wave propagation in a tube caused by a combination of elasticity of the tube wall and inertia of the fluid, and is usually referred to as reactance. We have noted earlier, for example, that wave propagation is not possible in a rigid tube. This can now be expressed more accurately by saying that a rigid tube has infinite reactance. More generally, a less elastic tube has higher reactance and o ers more resistance to wave propagation than does a more elastic tube. The combined e ects of reactance and pure resistance are commonly referred to as “impedance”. We shall see later that wave reflections in a tube arise at a point where there is a change of impedance, which may be caused by a change of diameter or elasticity of the tube. Impedance and wave propagation play a central role in the dynamics of coronary blood flow and they are explored more fully in later chapters.
2.8 Mechanical Analogy
The mechanics of flow in a tube or a system of tubes can be identified, by analogy, with the basic mechanics of a solid object in motion under the influ-