

Multidimensional Chromatography
.pdf80 |
Multidimensional Chromatography |
analysis, unless the analyst was only specifically interested in increasing the separation of limited target zone(s).
This immediately also leads one to conclude that where a total sample should be analysed by MDGC – due to the less-than-satisfactory resolution of components achievable on a single column – or might be better analysed by MDGC applied over the whole analysis, conventional MDGC fails to deliver the separation power demanded. Wilkins and co-workers addressed this problem to some extent by using multiple traps (5, 6) where they could isolate contiguous fractions from a petroleum chromatographic separation on one column into different sorption traps, as shown by the approach indicated in Figure 4.2(c). The lower part of the latter shows that each ‘trap’ is analysed separately, and here gives five independent 2D chromatograms. Clearly, there is a physical and practical limitation to the number of traps that can be employed for this purpose. We should view Wilkins’ work as an innovative transitional technology, recognizing the limitations of MDGC and trying to develop a system that offers a step towards maximizing the power of MDGC. Conceptually, we should wish to apply Wilkins’ concept to the microcolumn environment, with minimum zone widths and on a rapid time-frame, but without the multitude of traps. We might thus seek to incorporate the idea of multiple-zone trapping into the column itself.
While it is generally acknowledged therefore that MDGC can increase resolution by transfering zones from one column to another, there is clearly a limited opportunity to improve the total analysis through this approach.
Conventional multidimensional gas chromatography operation procedures should now be reconsidered and redefined in light of the new method of comprehensive GC GC technology, as discussed below.
4.2INTRODUCTION TO GC GC SEPARATION
The comprehensive GC GC technique was introduced by Phillips and co-workers (7–9) and has been reviewed by de Geus et al. (10). GC GC achieves the goal of applying multidimensional gas chromatography separation over the total analytical separation. The comprehensive GC GC experiment is also defined as a system that allows all of the sample from the first column to be analysed on the second column. The key to the experiment is the technical achievement of the interface between the two dimensions, which is discussed in more detail below. Notwithstanding the above discussion, GC GC is achieved precisely by the method shown in Figure 4.2(b), except that we have to modify the diagram slightly, and this is shown in Figure 4.2(d). The 2D analysis duration for the ‘heartcut’ zone is approximately the same as the zone duration taken or transferred from 1D. These zones are a small fraction of the elution time of an individual chromatographic peak, as shown in the figure. The transfer of solute from 1D to 2D involves, again, an innovative approach that leads to zone compression of the chromatographic band between the two dimensions. This is the ‘modulator’, and intervenes between the
Orthogonal GC–GC |
81 |
two dimensions to give two important results, and benefits, which arise from the modulation process. These are as follows:
(i)the zone to be passed (or more correctly, pulsed) from 1D to 2D must be compressed in space;
(ii)the compressed zone must be delivered to 2D very rapidly, and as a sharp pulse;
(iii)2D must be capable of giving fast GC results, achieved by a combination or all of the following, i.e. a short column, thin film thickness, narrow id column (giving high carrier linear velocity) and higher temperature (if a two-oven system is used);
(iv)the peaks produced at the detector will be increased in peak height response due to the above process;
(v)all of the first column solute is transferred to the second column.
It is tempting to draw the analogy between GC GC and 2D planar chromatography. On a TLC plate, the original single spot may be developed along one edge of the plate, which is then rotated 90° and placed in a second eluting solvent system to give rise to a different separation mechanism for separating compounds that were unresolved in the first step. The final plate could have solute spots distributed anywhere over the plate space that had been ‘developed’ by eluent. In a similar sense, the GC GC experiment, if properly designed, could theoretically have peaks distributed over a space corresponding to the full range of possible distribution constants available to the mixture components on the columns used in the experiment. In TLC, however, zone visualization is conducted on the final plate (e.g. by densitometry), whereas in the GC case we must have a single detector recording the effluent from the second column. The GC GC experiment also has all of the normal method advantages of the GC technique – sensitive analysis, hyphenation with mass spectrometry should be possible, readily automated methods, etc.
The ability of a GC column to theoretically separate a multitude of components is normally defined by the capacity of the column. Component boiling point will be an initial property that determines relative component retention. Superimposed on this primary consideration is then the phase selectivity, which allows solutes of similar boiling point or volatility to be differentiated. In GC GC, capacity is now defined in terms of the separation space available (11). As shown below, this space is an area determined by (a) the time of the modulation period (defined further below), which corresponds to an elution property on the second column, and (b) the elution time on the first column. In the normal experiment, the fast elution on the second column is conducted almost instantaneously, so will be essentially carried out under isothermal conditions, although the oven is temperature programmed. Thus, compounds will have an approximately constant peak width in the first dimension, but their widths in the second dimension will depend on how long they take to elute on the second column (isothermal conditions mean that later-eluting peaks on 2D are broader). In addition, peaks will have a variance (distribution) in each dimension depending on
82 |
Multidimensional Chromatography |
the dispersion/diffusion processes in each column. For a discussion on two-dimen- sional separations, with zone formation, considerations of resolution, and expressions for dispersion in each dimension, the reader is directed to the treatment by Giddings (12). If single dimension capacity is calculated by how many peaks of basewidth x ( 4 )s can be fitted into a total available elution time of y s, then approximately y/x peaks can be separated. For GC GC, we can approximate the capacity by calculating how many peak ‘areas’ can be fitted into the total available area. Taking a peak as having a 15 s basewidth in dimension 1, and an average of 200 ms in the second dimension with a modulation 4 s, then for a 60 min (3600 s) analysis we should have a capacity of (3600/15) (4/0.2) 4800 peaks. This statistically available capacity probably cannot all be used in an analysis, but more importantly it does increase dramatically the potential separation power, and many more compounds can be separated, hence achieving the goal of MDGC analysis. To properly implement the comprehensive GC GC method, zone compression is used (an option not available in the TLC experiment or liquid mobile phase separations), which in combination with fast second-dimension analysis gives very much improved sensitivity (13, 14) with improvements of 50-fold or better being reported.
4.3INTRODUCTION TO MODULATION TECHNOLOGY
There are essentially two procedures which can deliver the requirements of modulation between the two columns as defined above – these are the thermal sweeper/modulator of Phillips, and the cryogenic modulator of Marriott. A third option which has been reported is the valve/diaphragm modulator of Synovec and co-workers (15). The latter is capable of producing very narrow peak pulses to a second column, but it does this by a rapidly switching diphragm valve, which momentarily diverts a slice of the peak entering the valve to a second column. This may be as small as a 10 ms zone from each 1s portion of a peak, although the rest of the solute is vented. Whilst the chromatogram presentation seems to be analogous to that of the other comprehensive gas chromatography technologies, this diaphragm method does not increase the mass sensitivity of detection, and there is no solute compression. The first two options will be discussed further below.
4.3.1THERMAL SWEEPER
The thermal sweeper is a commercial product licensed to Zoex Corporation, Lincoln, NA, USA (16). The sweeper incorporates a slotted heater (operated at about 100 °C above the oven temperature) which passes over the capillary column (normally an intermediate thicker film column is used in this region as an accumulator zone). Figure 4.3 is a schematic diagram of how the instrumental arrangement may be considered. The greater temperature of the rotating sweeper forces the solute which has been retained in the phase in the accumulator section to be volatilized out of the phase into the carrier gas stream, and then bunched up and brought forward
Orthogonal GC–GC |
83 |
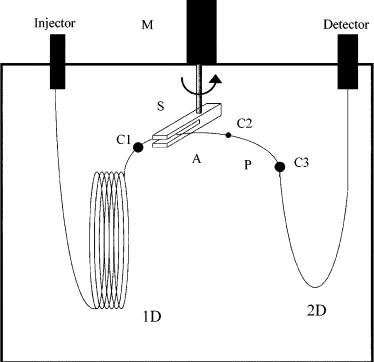
Figure 4.3 Schematic diagram of a thermal sweeper system located between two columns in the gas chromatograph; C1, C2 and C3 are column connections, with C2 being small enough to allow the slotted heater S to pass over the connection. The accumulator column A retards the travel of solutes through this section until the sweeper expels them out to the uncoated column (called a pigtail (P)), which then delivers them as a narrow band to the second column. The modulation drive, M, is external to the GC oven.
along the column as a focused band as the heater rotates over the column section. It is then delivered to 2D quickly, as required. The sweeper may have to pass over a column connection, and this had presented a robustness problem in the early development of the technology. Often the first column is connected to the accumulator column by using a short uncoated capillary, and another uncoated column is placed before 2D. This involves a total of four column connections. A more recent version of the commercial system incorporates a separately controllable heater block in which 2D is located in order to allow independent thermal control of the two columns. This may aid optimization of separation performance. Whether the heated block causes temperature control concerns in the main oven is unclear. In operation, the sweeper arm runs across the column section and sits over the accumulator column exit connection to ensure full transfer of solute out of that section. The sweeper then rotates to its home position and waits until the next sweep event is initiated. These steps are indicated on Figure 4.4.

84 |
Multidimensional Chromatography |
Figure 4.4 The slotted heater (see Figure 4.3) is held at its rest position 1 until it is moved to sweep across the accumulator column, as shown at position 2. When arriving at position 3, it rests again over the exit connection C2 to ensure solute is fully delivered to column 2. Then it rotates back to position 1, awaiting the next repetition of modulation.
4.3.2LONGITUDINAL CRYOGENIC MODULATION
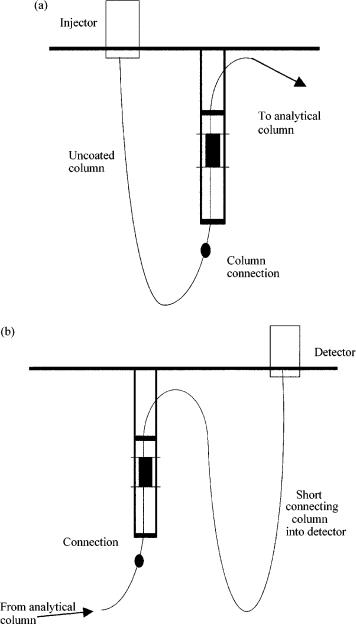
The cryogenic modulator (termed a longitudinally modulated cryogenic system (LMCS)), which was developed at The Royal Melbourne Institute of Technology, has a number of diverse applications mainly due to the universal value of cryogenic methods in GC, one of which is the comprehensive GC GC technique. It offers some unique ways to manipulate chromatographic bands (17), which allows certain novel chromatographic results to be obtained. The LMCS uses a small cryogenic trap as a hollow sleeve about the capillary column to cool, and hence trap, any solute that enters the cold region (18). The key to this method is that the trap is moved along the capillary column to expose any trapped solute to the heat of the oven, which rapidly allows the solute to heat up and pass to 2D. Simply allowing the trap to heat up by turning off the CO2 supply is not suitable (19); however, we have found that supplementary heating is also not required, with the prevailing heat of the oven being adequate to heat up the cold region of the column once the trap is slid away from the trapping region. Such a trap can perform a number of functions that conventional cryotraps are routinely used for. It is located inside the oven, and is used to cool a small length of fused silica column. Thus, it can focus volatile compounds at the injection end of the column system, or it can be used at the outlet end of the column inside the oven (just before the detector). These options are shown in Figure 4.5. The results of a definitive study of injection and detection applications of the LMCS have been reported (20), which suggest that the system should be useful
Orthogonal GC–GC |
85 |
Figure 4.5 (a) By placing a short ‘retention gap’ column before the cryotrap, solute will be delivered to the collection zone, and when the trap is moved this will be effectively injected into the analytical column. (b) The LMCS can be used to focus solutes just before the detector. This gives very short, tall pulsed peaks which are many times taller than normal capillary GC peaks.
86 |
Multidimensional Chromatography |
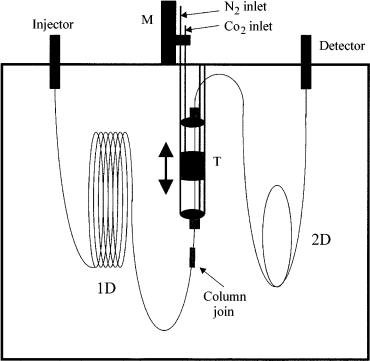
for headspace or thermal desorption experiments and, by extension, to solid-phase microextraction sample introduction, where the ability to focus the band at the head of the column is advantageous. When the LMCS is positioned between two columns in which we wish to perform some separation function, a range of multidimensional methods, some of which are novel approaches to solute manipulation, can be achieved (21). Figure 4.6 illustrates the mode where two separation columns are interfaced through the cryomodulator unit. Note that the capillary column is fed through the cryotrap, and so the solute is retained within the column (sorbed in or on the stationary phase on the walls of the column) which is surrounded by the cooled device.
4.3.3 MODES OF THE LMCS USING COUPLED SEPARATION COLUMNS
Once solute has been focused in space within the cryotrap, they are subsequently ejected out of the cold region (we can refer to this as being like a re-injection into the
Figure 4.6 The LMCS system incorporates a moveable cryogenic trap T through which the capillary column is passed. The modulator (M) can be a pneumatic or motor driven device that moves T up and down as required, according to either preselected times (for a selective mode) or at a fast constant period for GC GC.
Orthogonal GC–GC |
87 |
downstream column) as a rapid pulse. The pulse width has been estimated to be as narrow as 10 ms or less, based on an experiment where a very short piece of column located between the cryotrap and detector gave peaks about 50 ms wide at their bases. Since the peak (or slice of a peak – see later) entering the cryotrap has a significantly broader bandwidth, the focusing process has the effect of concentrating the packet of solute – increasing its mass flow rate, which is translated into a peak height increase in the detection step. For instance, if a migrating peak is 40 cm wide, and is then focused to say 4 mm wide at the cryotrapping zone, we have a 100-fold increase in concentration. If the subsequent peak at the detector is 2 cm wide after it travels through a short (fast) column, then the peak will be about 20 times taller than that on a conventional capillary column operated normally. This argument can also be based on peak widths in units of s. If the conventional capillary peak is 5 s wide at its base, and the pulsed peak after the short second column is 200 ms wide, then a peak height increase of 25-fold is achieved. These improvements are easily attained in the LMCS experiment. Perhaps the more important effect of the focusing, however, is the potential for separation or resolution of solutes which are co-trapped in the cryotrap and collectively pulsed to column 2.
Accepting that the cryofocussing/remobilization process is both effective in the collection of discrete sections of the effluent from column 1, and very rapid in reinjection to column 2, we can now propose a number of ways of using the LMCS device in multidimensional gas chromatography modes.
4.3.3.1 Mode 1: Selective or Targeted Multidimensional Gas Chromatography
Many approaches have been described in the literature for achieving MDGC. Perhaps a common theme among these can be summarized as the need to isolate a small region of the first column separation and pass it to the second column, where we seek to attain greater separation. The analyst then only has to decide which choice of column will produce the desired result. Conventionally, however, the MDGC experiment has been much more involved and complex to implement than suggested by this simplified description of the process. The classical experiment will use flow switching valves or pressure-balanced systems that are not trivial to design, construct, operate and maintain. For these reasons, the number of analysts using MDGC on a routine basis is still very small, and often restricted to those laboratories where considerable expertise is available. With reference to Figure 4.1, the experiment will normally involve the following steps: (a) setting up the MDGC system; (b) running a normal GC analysis with the effluent directed to detector 1 through the non-retaining transfer line (T) (thus there is no time delay between peaks at the detector and their entry into the interface (I); (c) setting up the time sequence for heartcutting selected zones to 2D; (d) deciding if some trapping mechanism is required at the head of 2D; (e) running the experiment. The stimulus provided to the interface/value device (I/V) will be the event controlled by the multidimensional control unit that effects the heartcutting, and may be a valve switch/rotation, a valve
88 |
Multidimensional Chromatography |
closure, or a pressure change. Depending on the demands of the analysis, the target solutes might be only those transferred to the 2D, or might be peaks recorded at both detectors. There is no guarantee that both detectors respond to an equivalent degree. The use of modern electronic gas controls certainly adds to the precision of the MDGC experiment and should increase method robustness, but if there is a flow balancing problem between the two exit paths from the I/V device, the heartcutting event might be no longer reliable.
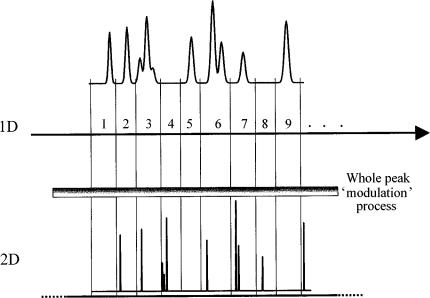
LMCS should provide an almost equivalent experimental result for the basic MDGC experiment described above. We have recently shown that within the singlecapillary GC analytical run, a number of modes can be performed, including normal GC, targeted GC and comprehensive gas chromatography (22). The in-line cryotrap, which is capable of ‘modulation’ or pulsing of sections of effluent from column 1 to column 2, is conceptually the same as the heartcutting process in conventional MDGC, as described above. However, in order to create a workable system the second column must be operated under fast GC conditions (compared with the first column elution times) so that during the analysis of sequential sections of the first column zones, there is no overlap of adjacent pulsed zones. Instead of excising heartcut zones from column 1 to column 2, in this case we collect the desired zone in the cryotrap, and isolate it from the neighbouring zones by simply pulsing the collected zone to column 2. Any solute following this target zone in the first column is held back in the cryotrap while the previous zone is being analysed on column 2, and is retained in the cryotrap until itself is pulsed to column 2. If the column 2 analysis is fast (e.g. 0.2 – 0.5 min) and the column selectivity is sufficient, then many repeated pulsed zones can be analysed with target analytes resolved. Figure 4.7 shows how this concept can be viewed, with zones 1 – 9 collected and separately pulsed though to column 2. Dimension 2 is a fast separation and all peaks transferred to column 2 are eluted before the next pulse is delivered to column 2. Thus the three peaks in zone 3 will be resolved. This demands that these solutes have sufficient chemical difference to allow the phase on column 2 to differentiate them into individual peaks. Note that events 4 and 8 are blank (or dummy) events, and are inserted so that any trace components which may be collected since the previous zone are cleaned out of the cryotrap before the next peak is trapped. This could also be done to remove the buildup of column bleed in the cryotrap. Note that on the diagram, zone 1 is pulsed to dimension 2 when zone 2 is being collected, and so this explains why each peak or peak group is offset by one event step from the upper event sequence. The above procedure has been implemented in this laboratory for a number of applications such as semi-volatile aromatic hydrocarbons (23) and sterols (24).
It is again clear that the two benefits of increased sensitivity and better resolution are both achieved, where these arise from zone compression and phase selectivity, respectively. However, since this mode of analysis is relatively new, it has yet to be tested for a wide range of applications; such studies will be required to fully demonstrate its general utility. It is unclear whether this operational mode of selective MDGC constitutes a mode which is consistent with the definition of comprehensive
Orthogonal GC–GC |
89 |
Figure 4.7 The selective or targeted mode of LMCS operation allows selected peaks to be collected sequentially in the cryotrap, and then pulsed rapidly to the second column. The resulting peaks are narrow and tall; provided that the second column phase selectivity and efficiency are adequate, they will also be resolved. The process is repeated as many times as required during the analysis. On this diagram, the lower trace response scale will be considerably less sensitive than on the upper trace.
gas chromatography as originally proposed, since this mode was not available until recently, and so neither its introduction nor its capability were anticipated by earlier chromatography researchers. However, it is probably better to only consider those modes which produce the more familiar GC GC performance that should be termed comprehensive gas chromatography, as described below.
4.3.3.2Mode 2: Comprehensive Gas Chromatography (GC GC)
The process of GC GC requires fast analysis of multiple slices of each peak eluting from column 1 to column 2. The cryogenic modulator was shown to produce this result (25) with the pulsed peak faithfully following the peak profile. Peak halfwidths of the order of 50 ms were reported, and a crude oil chromatogram presented. The process shown in Figure 4.8 illustrates the relative speed of modulation with respect to the peak width on the first column, which enters into the cryotrap. Thus about five or so slices are analysed successively on column 2. Figure 4.8 demonstrates that if two peaks are severely overlapping on the first column, and then subjected to the cryotrap-pulsing process, we can therefore obtain separate resolved peaks on column 2. By choosing conditions which are able to resolve the peaks on