

Карцев В.Г.Избранные методы с-за и модифик. гетероциклов т.1 , 2003
.pdfwhere IGC50 = concentration (mM) that inhibits growth by 50%, ELUMO = energy of lowest unoccupied molecular orbital, Q = cross-validated correlation coefficient (leave- one-out procedure), and F = Fisher statistic.
Since most QSARs are used for predictive purposes, it is important that their predictive ability is assessed. Whilst cross-validation is one method of assessing predictive ability, it can be criticized as simply giving a measure of the internal consistency of the data-set used to develop the QSAR (the training set). A better approach is to use the QSAR to predict the toxicities of chemicals not used in the training set (external validation).
As well as ELUMO, other measures of reactivity can be used in QSARs involving reactive chemicals. An interesting example is given by Veith and Mekenyan [20] who
correlated the toxicity of chemicals with three different modes of action to P. promelas, using the molecular orbital descriptor known as superdelocalisability:
log(1/LC50) = 56log P + 13.7SavN – 1.49, |
(5) |
n = 114, r2 = 0.81, s = 0.44, |
|
where SavN = average nucleophilic superdelocalisability.
Specifically acting chemicals are exemplified by the organophosphorus insecticides. Hermens et al.[21] were able to model the toxicity of these compounds to P. reticulata with a two-term QSAR:
log(1/LC50) = 0.23Σπ + 0.80k + 2.77, |
(6) |
n = 9, r2 = 0.92, s = 0.19, |
|
where Σπ = sum of hydrophobic substituent constants and k = experimentally determined rate constant of reaction with 4-nitrobenzylpyridine. Although a later study by de Bruijn and Hermens [22] with 20 such insecticides failed to confirm this correlation, Verhaar et al. [23], using a number of physicochemical descriptors, obtained a series of good QSARs for the toxicity of a series of 12 organophosphorus insecticides. Recently Devillers [24] used a neural network approach to model the toxicity of 66 diverse pesticides to the bluegill fish, Lepomis macrochirus, using autocorrelation descriptors encoding lipophilicity and hydrogen bonding ability; he found RMS residual values of 0.345 log units for the training set and 0.359 log units for a 21-compound test set.
An interesting study by Kaiser et al. [25] used neural networks to model the toxicity to P. promelas of a very heterogeneous set of 1000 chemicals with various modes of action. Using functional groups as descriptors, they obtained r2 = 0.899, and a test set of 84 chemicals yielded r2 = 0.803.
Toxicity of oxygenand sulphur-containing heterocycles
Numerous compilations of environmental toxicity data are available, although many of these are quite small. Three of the largest are those where the test species are:
Генеральный спонсор и организатор – InterBioScreen Ltd. |
47 |

1.Pimephales promelas, the fathead minnow. This contains toxicity data on about 600 chemicals [26], determined at the US E.P.A. laboratory in Duluth, MN, USA.
2.Tetrahymena pyriformis, an aquatic ciliate. Currently about 2000 chemicals have been tested against this species at the University of Tennessee, and the toxicities of most of these have been published [27].
3.Vibrio fischeri (formerly Photobacterium phosphoreum), a phosphorescent bacterium whose phosphorescence decreases with toxic insult. This database, known as COMPUTOX and containing V. fischeri toxicities of some 2000 chemicals, is commercially available from Terrabase Inc. (www.terrabase-inc.com). It also contains toxicity data for various fish species, rat and mouse, other aquatic species such as Daphnia magna, Tetrahymena pyriformis, crayfish, mussel, and various algae and bacteria.
Methods
Toxicity data on O- and S-containing heterocycles were extracted from the above three databases; V. fischeri data were obtained from COMPUTOX ver. 5.0. The values of log P are measured values wherever possible; where these are not available the means of three values calculated from ClogP ver. 1.0.0 (www.biobyte.com), Interactive Analysis (www.logp.com) and KOWWIN ver. 1.66 (www.epa.gov/oppt/exposure/docs/episuitedl.htm) have been used. ELUMO values were calculated using TSAR for Windows ver. 3.3 (www.accelrys.com). Statistical analysis was carried out using Minitab ver. 13.0.
Results
Toxicity to Pimephales promelas
A total of 22 O- and S-containing heterocycles were found with reported toxicity to P. promelas, and these are listed in Table 3.
Table 3. Toxicities of O- and S-containing heterocycles to Pimephales promelas
Compound |
CAS No. |
log(1/LC50)* |
log P |
ELUMO |
2,3-Benzofuran (1) |
271896 |
0.93 |
2.67 |
–0.063 |
3-Bromothiophene (2) |
872311 |
1.42 |
2.62 |
–0.115 |
Carbofuran (3) |
1563662 |
2.42 |
1.63 |
0.245 |
5-Chloro-2-mercaptobenzo- |
|
|
|
|
thiazole (4) |
5331919 |
1.80 |
3.42** |
–0.867 |
Cineole (5) |
470826 |
0.18 |
2.50 |
2.851 |
A-Decanolactone (6) |
706149 |
0.98 |
2.72 |
1.162 |
Dicumarol (7) |
66762 |
1.82 |
2.07 |
–1.012 |
2,3-Dihydrobenzofuran (8) |
496162 |
0.17 |
2.14 |
0.361 |
2,5-Dimethylfuran (9) |
625865 |
0.13 |
2.24 |
0.719 |
1,4-Dioxane (10) |
123911 |
–2.05 |
–0.27 |
2.824 |
48 |
Пленарные доклады |

Table 3. Contnued
Flavone (11) |
525826 |
1.80 |
3.56 |
–0.776 |
Furan (12) |
110009 |
0.05 |
1.34 |
0.723 |
4-(2-Hydroxyethyl)mor |
|
|
|
|
pholine (13) |
622402 |
–1.32 |
–0.99** |
2.446 |
Piperine (14) |
94622 |
1.56 |
3.20** |
–0.820 |
Resmethrin (15) |
10453868 |
4.74 |
6.14 |
0.376 |
Rotenone (16) |
83794 |
4.94 |
4.10 |
–0.522 |
Saccharin sodium salt |
|
|
|
|
hydrate (17)*** |
128449 |
–1.95 |
0.91 |
–1.289 |
Solketal (18) |
100798 |
–2.10 |
0.42** |
2.252 |
Strychnine hemisulphate |
|
|
|
|
salt (19)*** |
60413 |
2.54 |
1.93 |
0.198 |
Tetrahydrofuran (20) |
109999 |
–1.48 |
0.47 |
3.111 |
Tetrahydrofurfuryl |
|
|
|
|
methacrylate (21) |
2455245 |
0.69 |
1.60** |
0.131 |
1,3,5-Trioxane (22) |
110883 |
–1.82 |
–0.43 |
2.389 |
|
|
|
|
|
*LC50 in mM **Calculated log P value
***log P measured for free acid or base; ELUMO calculated for free acid or base
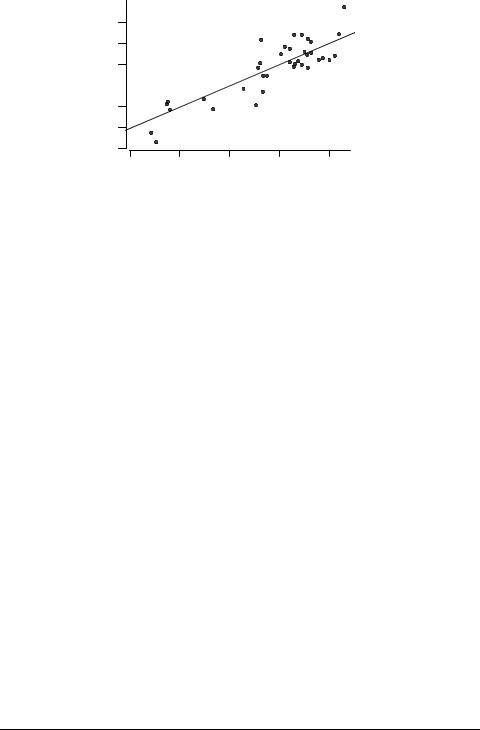
The QSAR for non-polar narcosis to P. promelas (the baseline QSAR) is reported [28] as:
log(1/LC50) = 0.87log P – 1.79, |
(6) |
n = 51, r2 = 0.957, s = 0.30, F = 1088,
where LC50 = concentration to kill 50% of fish during the 96-h test.
The observed toxicity–log P correlation for the data in Table 3 is given by:
log(1/LC50) = 1.057log P – 1.411, |
(7) |
n = 22, r2 = 0.738, s = 1.053, F = 56.3.
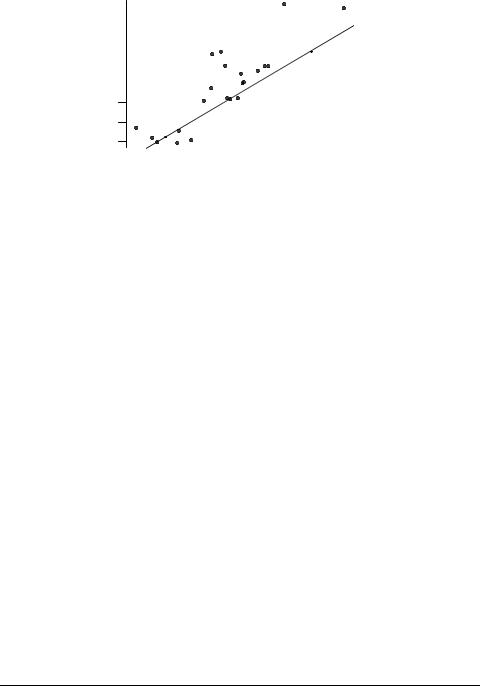
The toxicity data in Table 3 are plotted against log P in Figure 2; the solid line is the baseline QSAR from eq. 6. It can be seen that there are a number of positive outliers, i.e. compounds whose toxicity is appreciably greater than would be expected for nonpolar narcosis. (Compounds lying more than two standard deviations from the baseline QSAR are generally regarded as outliers).
Генеральный спонсор и организатор – InterBioScreen Ltd. |
49 |
Log 1/LC50
5 |
|
|
16 |
|
|
|
|
||
4 |
|
|
|
|
|
|
|
||
3 |
|
|
19 |
|
3 |
||||
|
||||
2 |
|
|||
|
|
7 |
||
|
|
|||
1 |
|
|
|
|
|
|
|
||
0
-1 13
-2
- |
|
|
|
|
|
|
|
|
|
1 |
0 |
1 |
2 |
3 |
4 |
5 |
6 |
||
Log P
Fig. 2. Correlation of toxicity to P. promelas with log P.
It can also be seen that one compound apparently possesses appreciably lower toxicity than expected for baseline narcosis; such behavior is generally acknowledged to arise from evaporative loss from the test vessel during toxicity testing, leading to lower than nominal concentration of toxicant. However, in this case the compound in question is saccharin sodium salt hydrate 17 that is not volatile. The explanation is probably that the log P value used for this compound is that of the free acid, since the log P value of the salt is not available, and software for the calculation of log P cannot handle ionized species. The log P value of 17 is undoubtedly considerably lower than that of the free acid. The presence of the outliers is the reason for the statistics of eq. 8 being much poorer than those of eq. 7.
If ELUMO is incorporated into the correlation, the resulting QSAR is:
log(1/LC50) = 0.966(0.174)log P – 0.183(0.203)ELUMO – 1.110, |
(8) |
n = 22, r2 = 0.749, s = 1.058, F = 28.3.
The numbers in brackets after the coefficients are the standard errors of the coef-
ficients, and it can be seen that that for ELUMO is actually greater than the value of the coefficient. This indicates that the ELUMO term is not significant, and contributes little or
nothing to the correlation; this is shown also by the fact that the statistics of eq. 8 are no better than those of eq. 7.
The positive outliers in Fig. 2 are carbofuran 3, dicumarol 7, 4-(2-hydroxyethyl)- morpholine 13, rotenone 16, strychnine hemisulphate salt 19. Both carbofuran 3 and dicumarol 7 are reactive acylating agents, and would thus react with nucleophilic centers on proteins. 4-(2-Hydroxyethyl)morpholine 13 could be involved in membrane interaction through its NCCO moiety, which is the same as in choline; in addition, if the –OH group is derivatized, it could be activated. Rotenone 16 has a number of potentially
50 |
Пленарные доклады |

reactive sites; for example, its carbonyl group could react to form a Schiff's base complex, and the heterocyclic oxygens could behave as electrophiles. Strychnine is, of course, a well-known poison, and could react electrophilically through its carbonyl group and its heterocyclic oxygen atom.
Toxicity to Tetrahymena pyriformis
A total of 27 O- and S-containing heterocycles were found that had been tested against T. pyriformis, although five of these were not toxic at saturation. The compounds and their relevant data are listed in Table 4.
Table 4. Toxicities of O- and S-containing heterocycles to Tetrahymena pyriformis
Compound |
CAS No. |
log(1/IGC50)* |
log P |
ELUMO |
2,3-Benzofuran (1) |
271896 |
–0.11 |
2.67 |
–0.064 |
2,1-Benzisoxazole (23) |
271589 |
–0.15 |
1.52 |
–0.856 |
2,1,3-Benzothiadiazole (24) |
273132 |
–0.10 |
2.01 |
–1.267 |
Benzothiazole (25) |
95169 |
–0.03 |
2.01 |
–0.482 |
1-Benzothiophene (26) |
95158 |
0.26 |
3.12 |
–0.166 |
Benzoxazole (27) |
273530 |
–0.26 |
1.59 |
–0.338 |
2,2'-Bithiophene (28) |
492977 |
1.04 |
3.75** |
–0.574 |
3,3'-Bithiophene (29) |
3172563 |
1.00 |
3.40** |
–0.139 |
3-Bromofuran (30) |
22037281 |
–0.48 |
2.25** |
0.340 |
3-Bromothiophene (2) |
872311 |
–0.04 |
2.62 |
–0.115 |
3-Butylthiophene (31) |
34722015 |
0.96 |
3.83** |
0.270 |
2-Chlorothiophene (32) |
96435 |
–0.59 |
2.54 |
–0.122 |
Dibenzofuran (33) |
132649 |
1.42 |
4.12 |
–0.403 |
Dibenzothiophene (34) |
132650 |
*** |
4.38 |
–0.400 |
Dibenzothiophene sulfone (35) |
1016053 |
*** |
2.30** |
–1.172 |
2,3-Dimethylfuran (36) |
14920899 |
–0.51 |
2.46** |
0.731 |
2,5-Dimethylfuran (9) |
625865 |
–0.48 |
2.24 |
0.719 |
2-Ethylfuran (37) |
3208160 |
–0.52 |
2.40 |
0.735 |
2-Ethylthiophene (38) |
872559 |
–0.43 |
2.87 |
0.227 |
Furan (12) |
110009 |
–1.51 |
1.34 |
0.723 |
2-Methylbenzofuran (39) |
4265252 |
0.62 |
3.22 |
–0.038 |
3-Methylthiophene (40) |
616444 |
–0.70 |
2.34 |
0.264 |
Phenothiazine (41) |
92842 |
*** |
4.15 |
–0.134 |
Phenoxathiin (42) |
262204 |
2.04 |
4.54 |
–0.255 |
Thianthrene (43) |
92853 |
*** |
4.57** |
–0.363 |
Thiophene (44) |
110021 |
–1.44 |
1.81 |
0.239 |
Xanthene (45) |
92831 |
*** |
4.40** |
0.143 |
|
|
|
|
|
*IGC50 in mM |
|
|
|
|
**Calculated log P value |
|
|
|
|
***Not toxic at saturation |
|
|
|
|
|
|
|
||
Генеральный спонсор и организатор – InterBioScreen Ltd. |
|
51 |
||
The baseline QSAR for toxicity to T. pyriformis is given [28] by:
log(1/IGC50) = 0.74log P – 1.86, |
(9) |
n = 148, r2 = 0.958, s = 0.21, F = 3341,
where IGC50 = concentration to inhibit growth by 50% during the 40-h test. The toxicity–log P QSAR found for the data in Table 4 is:
log(1/IGC50) = 0.891log P – 2.377, |
(10) |
n = 22, r2 = 0.772, s = 0.428, F = 67.9.
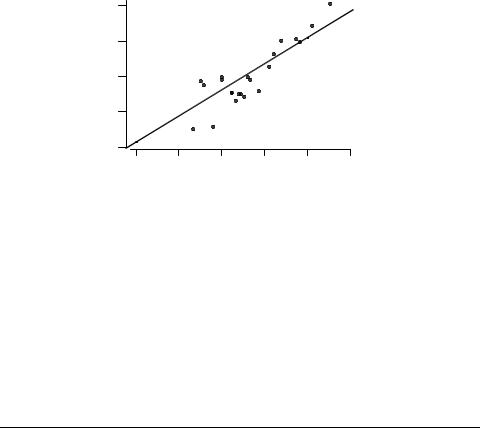
The toxicity data in Table 4 are plotted against log P in Figure 3; the solid line is the baseline QSAR from eq. 9. It can be seen that there are no obvious positive outliers, although five compounds appear as negative outliers.
Log 1/IGC50
2
1
0
-1
-2
0 |
1 |
2 |
3 |
4 |
5 |
Log P
Fig. 3. Correlation of toxicity to T. pyriformis with log P.
These are all volatile compounds (from left to right, furan, thiophene, 3-methyl- thiophene, 2-chlorothiophene and 2-ethylthiophene), and thus probably the apparent deviations from the baseline can be accounted for by loss of compound from the test vessel.
Despite the lack of obvious outliers, the incorporation of ELUMO into the correlation improves the statistics considerably:
log(1/IGC50) = 0.853(0.079)log P – 0.566(0.130)ELUMO – 2.290, |
(11) |
n = 22, r2 = 0.886, s = 0.311, F = 73.9.
52 |
Пленарные доклады |
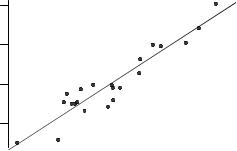
The figures in brackets in eq. 11 are the standard errors of the coefficients. It can be seen that in each case the standard errors are much lower than the values of the coefficients themselves, which means that each coefficient is significant (p < 0.001 in each case). Clearly, despite the absence of obvious outliers, there is a significant electrophilic contribution to the overall toxicity of these compounds to T. pyriformis. The correlation is shown in Figure 4, in which the solid line is the QSAR of eq. 11.
Log 1/IGC50 (obsd)
2
1
0
-1
- |
|
|
|
|
|
1 |
0 |
1 |
2 |
||
|
|
Log 1/IGC50 (pred) |
|
|
|
Fig. 4. Correlation of observed toxicity to T. pyriformis with that predicted from eq. 11.
Toxicity to Vibrio fischeri |
|
|
|
|
|
|
A total of 39 O- and S-containing chemicals were found with reported |
toxicity to |
|
||||
V. fischeri, and these are listed in Table 5. |
|
|
|
|
|
|
Table 5. Toxicities of O- and S-containing heterocycles to Vibrio fischeri |
|
|
||||
|
|
|
|
|
|
|
|
|
|
log |
log P |
ELUMO |
|
|
Compound |
CAS No. |
1/EC50* |
|
||
|
Aflatoxin B1 (46) |
1162658 |
1.13 |
1.10** |
–1.368 |
|
|
Aflatoxin G1 (47) |
1165395 |
0.96 |
1.02** |
–1.525 |
|
|
2-Amino-6-nitrobenzothiazole (48) |
6285570 |
1.56 |
1.82** |
–1.279 |
|
|
2-Amino-5-nitrothiazole (49) |
121664 |
0.85 |
0.83 |
–1.325 |
|
|
5-Amino-1,3,4-thiadiazole-2-thiol (50) |
2349679 |
1.64 |
–0.46** |
–0.109 |
|
|
2-Aminothiazole (51) |
96504 |
–0.98 |
0.38 |
–0.139 |
|
|
L-Arabinose (52) |
87729 |
–2.28 |
–3.02 |
2.193 |
|
|
2,3-Benzofuran (1) |
271896 |
1.45 |
2.67 |
–0.063 |
|
|
2,1,3-Benzothiadiazole (24) |
273132 |
1.81 |
2.01 |
–0.481 |
|
|
Carbofuran (3) |
1563662 |
1.03 |
1.63 |
0.245 |
|
|
Carbofuran phenol (53) |
1563388 |
0.43 |
2.08 |
0.337 |
|
|
7-Chloro-4-nitrobenzo-2-oxa- |
|
|
|
|
|
|
1,3-diazole (54) |
10199890 |
3.70 |
2.35** |
–2.501 |
|
|
|
|
|
|
||
Генеральный спонсор и организатор – InterBioScreen Ltd. |
|
53 |
|
|||

Table 5. Continued
Coumarin (55) |
91645 |
1.07 |
1.39 |
–0.930 |
Dibenzofuran (33) |
132649 |
2.19 |
4.12 |
–0.403 |
Dieldrin (56) |
60571 |
1.27 |
5.20 |
–0.482 |
Digoxin (57) |
20830755 |
0.42 |
1.26 |
–0.158 |
1,4-Dioxane (10) |
123911 |
–0.92 |
–0.27 |
2.825 |
Endosulfan (58) |
115297 |
1.53 |
3.83 |
–0.667 |
Furan (12) |
110009 |
–0.18 |
1.34 |
0.723 |
α-D-Glucose (59) |
492626 |
–2.74 |
–3.12** |
1.969 |
Heptachloro epoxide (60) |
1024573 |
1.19 |
4.98 |
–0.447 |
2-Hydroxydibenzofuran (61) |
86771 |
2.38 |
3.40** |
–0.504 |
2-Mercaptobenzothiazole (62) |
149304 |
2.39 |
2.41 |
–0.665 |
2-Mercaptobenzoxazole (63) |
2382969 |
1.72 |
2.44** |
–0.474 |
3-Methyl-2-oxazolidinone (64) |
19836783 |
–1.17 |
–0.08** |
1.214 |
Morpholine (65) |
110918 |
0.18 |
–0.86 |
2.998 |
4-Morpholinepropionitrile (66) |
4542476 |
–0.68 |
–0.17** |
1.519 |
Ochratoxin A (67) |
303479 |
1.39 |
4.74 |
–1.114 |
Patulin (68) |
149291 |
2.15 |
–1.76** |
–1.263 |
Psoralen (69) |
66977 |
1.00 |
1.67 |
–1.015 |
Rotenone (16) |
83794 |
2.04 |
4.10 |
–0.532 |
Rubratoxin B (70) |
21794014 |
1.17 |
1.99** |
–2.120 |
2,2',5',2"-Terthiophene (71) |
1081341 |
2.40 |
5.57 |
–0.923 |
Tetrahydrofuran (20) |
109999 |
–0.81 |
0.47 |
3.111 |
Tetrahydrofurfuryl alcohol (72) |
97994 |
–1.19 |
–0.17** |
2.739 |
Thiazole (73) |
288471 |
0.80 |
0.44 |
–0.210 |
Thiophene (44) |
110021 |
–0.33 |
1.81 |
0.238 |
Warfarin (74) |
81812 |
0.81 |
2.70 |
–1.033 |
Xanthone (75) |
90471 |
1.42 |
3.39 |
–0.709 |
|
|
|
|
|
*EC50 in mM |
|
|
|
|
**Calculated log P value |
|
|
|
|
The baseline QSAR for toxicity to V. fischeri is reported [28] as: |
|
|||
log(1/EC50) = 0.94log P – 1.46, |
|
|
|
(12) |
n = 69, r2 = 0.760, s = 0.77, F = 212, |
|
|
|
|
where 1/EC50 = concentration to reduce light output by 50% during the test period; values are means of three results at 5, 15 and 30 min.
The observed toxicity–log P correlation for the data in Table 5 is:
log(1/EC50) = 0.441log P + 0.075, |
(13) |
n = 39, r2 = 0.447, s = 1.027, F = 29.9. |
|
54 |
Пленарные доклады |
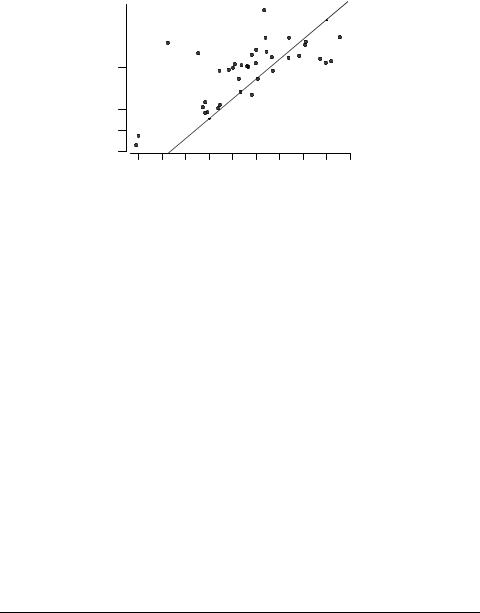
The toxicity data are plotted against log P in Fig. 5; the solid line is the baseline QSAR from eq. 12. A number of points should be noted here. Firstly, even for the baseline QSARs reported by Schultz et al [28], the V. fischeri standard error (0.77) is far greater than are the standard errors for P. promelas (0.30) and T. pyriformis (0.21); that is, the V.fischeri results are for some reason inherently less accurate.
Log 1/EC50
4 |
|
54 |
|
|
|||
3 |
|
|
|
68 |
|||
2 |
|||
|
|
||
50 |
|||
|
|||
1
65 0 


-1
-2
-3
-3 |
-2 |
-1 |
0 |
1 |
2 |
3 |
4 |
5 |
6 |
Log P
Fig. 5. Correlation of toxicity to V. fischeri with log P.
Secondly, there are four significant positive outliers seen in Figure 5, and because of these outliers the observed correlation (eq. 13) is very poor. Incorporation of ELUMO improves the correlation considerably:
log(1/EC50) = 0.441(0.080)log P – 0.553(0.108)ELUMO + 0.369, |
(14) |
n = 39, r2 = 0.680, s = 0.792, F = 38.3.
The four outliers are, however, still present, as Figure 6 shows. They are: 5-amino- 1,3,4-thiadiazole-2-thiol 50, 7-chloro-4-nitrobenzo-2-oxa-1,3-diazole 54, morpholine 65, and patulin 68. 5-Amino-1,3,4-thiadiazole-2-thiol could be a precursor of thioaldehyde, a highly reactive species. The chlorine atom of 7-chloro-4-nitrobenzo-2-oxa-1,3-diazole is reactive, and the compound is an SNAr electrophile that could link with protein nitrogen. Morpholine, like 4-(2-hydroxyethyl)morpholine mentioned above, has an NCCO moiety that could lead to membrane interaction with choline. Patulin is probably a Michael acceptor, and is also susceptible to nucleophilic attack at its double bonds.
It may also be noted from Fig. 5 that the four most hydrophobic compounds are quite marked negative outliers. They are, in order of increasing log P, ochratoxin A, heptachloro epoxide, dieldrin, and 2,2',5',2"-terthiophene. It is highly unlikely that they have undergone evaporative loss from the test vessel, and a more probable explanation is that their very high hydrophobicity has hindered their rapid absorption by the test organism during the very short time period of the test (a maximum of 30 minutes, which contrasts with 96 h for the P. promelas test and 40 h for the T. pyriformis test).
Генеральный спонсор и организатор – InterBioScreen Ltd. |
55 |
Log 1/EC50 (obsd)
4 |
|
54 |
|
3
68
2
50 

1
65 0 


-1
-2
-3
-2 |
-1 |
0 |
1 |
2 |
Log 1/EC50 (pred)
Fig. 6. Correlation of observed toxicity to V. fischeri with that predicted from eq. 14.
Acknowledgments
We are grateful to Dr. T.W. Schultz of the University of Tennessee for supplying the T. pyriformis data, and to Dr. D.W. Roberts of Unilever Research for discussions on mechanisms of action.
Conclusions
As with other organic chemicals, O- and S-containing heterocycles are toxic to aquatic species by various mechanisms, from non-polar narcosis to specific reactivity. Tentative reasons are offered for the toxicities of those compounds that are not well modeled by
either log P alone or a combination of log P and ELUMO. Such reasons are not specific to O- or S-containing heterocycles, and thus it may be concluded that these compounds
behave no differently from other organic compounds in respect of their toxicity to aquatic species. The QSARs presented here can be used for the prediction of toxicity of other oxygenand sulphur-containing heterocycles, provided that such compounds are not likely to possess specific reactivity.
References
1.Web sites: ecb.jrc.it; www.epa.gov/opptintr/chemrtk/volchall.htm.
2.Commission of the European Communities. White Paper on a Strategy for a Future Chemicals Policy, Brussels, Belgium, 2001; http://europa.eu.int/comm/environment/chemicals/whitepaper.htm.
3.Toussaint M.W., Shedd T.R., Vanderschalie W.H., Leather G.R., Environ. Toxicol. Chem. 1995 14 (5) 907.
4.Dearden, J.C., in Practical Applications of Quantitative Structure–Activity Relationships (QSAR) in Environmental Chemistry and Toxicology, Karcher W., Devillers J., Eds., Dordrecht: Kluwer, 1990, p. 25.
56 |
Пленарные доклады |