

Emerging Tools for Single-Cell Analysis
.pdfImportance of Modeling in Rare-Cell Analysis |
57 |
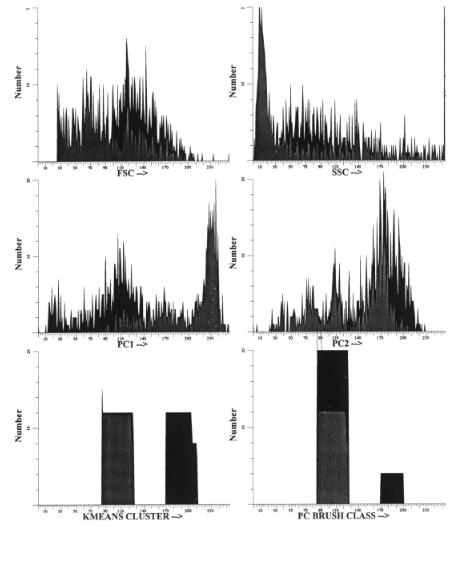
The actual use of such a tagged datafile to test cell classifier systems is shown in Figure 3.3. The principle is to run purified populations of cells separately on the flow cytometer. Then an additional correlated parameter (a “tag”) is added to the data but not used during the actual data analysis or sort classification process. But at the end of that process, the classifier tag serves as a way to have a truth table to evaluate the efficiency of the sort. Since cell sorting is just a real-time data analysis, sorting algorithms for rare cells labeled with different probes can be quickly tested in software without having to resort to costly and laborious testing of each possibility by actual cell sorting. Defined data mixtures simulating different rare-cell frequencies can be very rapidly modeled such that several weeks worth of actual sorting can be simulated in a single day. Then the best method for isolating the rare cells by actual cell sorting can be chosen. The ROC analysis can be used to estimate the performance of various cell classifiers both singly and in combination (Leary et al., 1998; Hokanson et al., 1999), as shown in Figure 3.4. In Figure 3.4A we see the general theory of ROC analysis. In Figure 3.4B we see ROC analysis applied to a rare-cell classification problem, in this case the problem of rare metastatic tumor cell analysis and purging (negative sorting to remove these cells) from stem cells to prevent their being cotransplanted back into a patient—a potentially very important future clinical application.
One of the most critical problems of rare-event analysis is the correct classification of the cells. To determine the correctness, one must have a truth standard; that is, one must be able to unequivocally determine the identity of each cell in a training set. Obviously in the new test sample there will be incoming data that reside in a classification “gray zone” where different cell subpopulations overlap. But if the training set is done properly, every cell can at least have a probability of assignment calculated on a cell-by-cell basis. This probability becomes an important part of a determination of sort boundaries to allow optimization of sorted cell yield and purity. In the case of cells that truly have partial membership in two or more classes (e.g., in normally differentiating cells or hematopoietic cancers such as leukemias), fuzzy logic can be used to provide fuzzy rather than crisp classifiers.
Multivariate Statistical Classification of Rare Cells
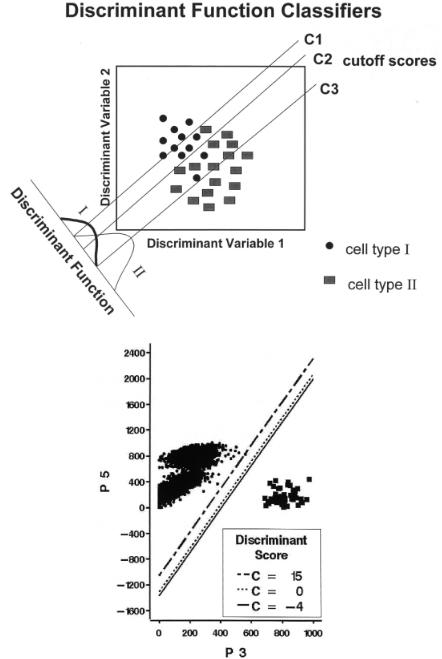
In some rare-cell applications it is important to know the probability of misclassification for analysis or sorting of rare cells. An example of an application for which this is important is the isolation of stem/progenitor cells free from contaminating rare tumor cells in autologous transplants of cancer patients (Schultze et al., 1997). Genemarking studies have shown that reinfusion of contaminating rare tumor cells can lead to the growth of serious new tumors in the patients (Brenner et al., 1993). One way of estimating the probability of misclassification of these very rare tumor cells in this application is through the use of discriminant function analysis (DFA; Lachenbruch, 1975; Klecka, 1980; McLachlan, 1992; Kleinbaum et al., 1992) recently applied to flow cytometry and cell sorting (Hokanson et al., 1999). An example of the theory and use of DFA in these studies is shown in Figure 3.5.
By moving the classification line we can choose a point of “acceptable” costs of misclassification, where acceptable is defined as presenting the patient with a tumor
58 |
Rare-Event Detection and Sorting of Rare Cells |
F i g . 3.3. Use of listmode data to test classifiers. Actual listmode data mixtures of human bone marrow cells and MCF-7 human breast cancer cells were analyzed using the methods described in Fig. 3.5. In addition to the raw flow cytometric parameters P1–P4, the first three principal components PC1–PC3
load that clinicians estimate the immune system of the patient can handle. While DFA is a relatively simple multivariate statistical classification method, it does make two important assumptions. First, the data are assumed to be multivariate normally distributed. This assumption is clearly violated by virtually all data, but the method is still relatively robust to violations of this assumption. A second assumption is that

Importance of Modeling in Rare-Cell Analysis |
59 |
|
|
|
|
|
|
|
|
|
|
|
|
|
and a discriminant function D1 were calculated. Cells were classified using K-means clustering or brush plotting through principal-component space. Data were gated on the true classifiers, which show how well they separated the two general types of cells.
there are only two groups of cells. Each group can consist of several subpopulations, but there can be only two groups. If a third group of cells is required for the analysis, DFA is insufficient. In the case of multivariate statistical classification of more than two groups, logistic regression techniques should be used. Logistic regression, a relatively new multivariate statistical technique, makes no assumptions about the

60 |
Rare-Event Detection and Sorting of Rare Cells |
distributional characteristics of the data (they need not be assumed multivariate normal) and there is no limit to the number of groups that can be classified.
Real-Time Multivariate Statistical Classification of Rare Cells for Cell Sorting
The pioneering work of Bartels showed that multivariate statistical classification of cells analyzed by image analysis could be a powerful tool for cell classification (Bartels, 1980a, b). Interestingly, it is possible to implement real-time multivariate statistical classification of cells for cell sorting using high-speed lookup tables that can compute linear or even nonlinear mathematical functions at memory speeds (Leary et al., 1997, 1998). One of the biggest problems in sorting rare cells has been the relatively crude, “seat-of-the-pants” choice of sort boundaries. The most common method used by most researchers is to set boundaries for “positive” cells “out there, somewhere” on one or more parameters. This is frequently done because the researchers were either unable or unwilling to sample enough cells to see where the rare cells are in multidimensional space. Another problem is that few researchers have ac-
F i g . 3.4. In this ROC plot of actual flow cytometric parameters P1–P4, we see that P2 (side scatter) is similar in performance as a classifier to P1 (forward scatter). A fluorescent monoclonal antibody against antigens found on breast cancer cells, P3, is a very good positive selection probe and classifier. A fluorescent monoclonal antibody against CD45 found on blood cells but not on breast cancer cells, P4, is a negative selection probe and is needed when the breast cancer cells become very rare in blood.
Importance of Modeling in Rare-Cell Analysis |
61 |
A
B
F i g . 3.5. (A) Stem cells and rare tumor cells are separated by DFA with different cutoff scores to exclude varying percentages of tumor cells from stem cells. (B) DFA data classification with costs of misclassification for normal human bone marrow and rare MCF-7 breast cancer cells where discriminant scores are in units of standard deviations (from Hokanson et al., 1999).

62 |
Rare-Event Detection and Sorting of Rare Cells |
cess to software to allow interactive three-dimensional visualization of either the raw parameter data space or better yet some multidimensional projection method (e.g., principal-component analysis). “Blind” sorting of cells from a multidimensional data space is extremely dangerous, as many or most of those positive cells out there, somewhere are actually false-positive background from the cells not of interest.
Most experimenters choose sort boundaries by human pattern recognition and arbitrarily drawn bitmap sorting boundaries. As the data required to find rare cells become more multidimensional, more complicated techniques are required to permit human visualization of the data. As rare cell sorting enters the clinic (e.g., in human stem cell sorting for subsequent transplantation), such arbitrariness is extremely unwise and will probably someday encounter Food and Drug Administration (FDA) regulations in the United States. Clinicians may someday have to provide for quality assurance as to why such sort boundaries were chosen and what the probabilities are for contamination that could adversely affect the patient. This is an area of rare-cell analysis and isolation that is critically important and needs more research and development.
DEFINING AND MEASURING INSTRUMENT PERFORMANCE FOR RARE-CELL SORTING BY QUEUING THEORY
There are a number of considerations that should be taken into account in assessing instrument performance, including cell–cell coincidence in the excitation source and/or in the sorting unit, instrument deadtime, and biological limitations imposed by the requirements of sorting rare cells. Many of these properties that involve mathematical modeling of random cell arrival can be easily evaluated using queuing theory (Gross and Harris, 1985).
Coincidence
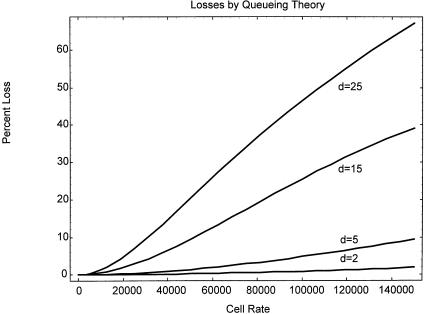
There are at least two important types of coincidence that must be taken into account by both instrument users and designers. First, there is the coincidence, or probability, that two or more cells lie within the excitation source such that the signals from these multiple cells cannot be separated from one another. Second, there is coincidence of two or more cells within the sorting unit such that all of these cells must be either sorted in a contaminated sort or rejected (using “anticoincidence” circuitry and logic) with a subsequent loss of cell yield. The second situation is frequently encountered by virtually all experimenters because the probability for cell coincidence in the sort unit is significant on most instruments even at rates of 5000 cells/s, as shown in Figure 3.6 (from Leary, 1994), which shows cell loss as a function of cell analysis rate and the number of droplets per sorting unit.
Cell–cell coincidence in the excitation source is less often seen by most experimenters unless cells are analyzed at rates in excess of about 20,000 cells/s on most instruments. The loss of cells not seen by the system due to cell coincidence is shown in Figure 3.7 (from Leary, 1994).

Defining and Measuring Instrument Performance for Rare-Cell Sorting by Queuing Theory |
63 |
F i g . 3.6. Queuing theory model of sort purity statistics produced by mathematical modeling using Mathematica (Wolfram, 1996). Sort purity decreases with the number of cells per second processed since these cells arrive randomly and must be contained within a fixed number of sorting units per second that are equally spaced. As the number of droplets per sorting unit increases, the queue length increases, leading to increased coincidence of multiple cells within a given sort unit.
In the high-speed enrichment sorting of rare cells, there will be multiple cells in each sort unit (typically one, two, or three droplets). For enrichment sorting it is important to know the identity of each cell and to have software algorithms capable of deciding whether adding that sort unit to the total sorted cell container is going to satisfy the requirements of yield versus purity for that application. Rare-cell sampling statistics and the endpoint use of the sorted rare cells must be taken into account in the sorting decision. Hence sorting decisions should be “weighted” according to experimental considerations that are not simple sort decisions on the flow cytometric parameters alone (cf. patents by Corio and Leary, 1993, 1996). This then leads to the subject of cost of misclassification or cost of classification/sort impurities, a subject to be discussed later in this chapter.
Deadtime
One of the most important characteristics of any instrument is its deadtime, that is, the time period that the instrument takes to process one cell and be ready for the next cell. It is a more complex characteristic than just signal processing time (e.g., analog- to-digital conversion) because signals might have to be further processed, stored in a
64 |
Rare-Event Detection and Sorting of Rare Cells |
F i g . 3.7. Mathematica (Wolfram, 1996) -generated graph of the percent loss in the number of observed cells per second compared to the expected number of cells per second as a function of instrument deadtime based on queuing theory and instrument deadtimes.
buffer, buffers periodically emptied, and so on. A better way of taking all these many, and sometimes hidden, sources of deadtime in a system is to experimentally determine the functional deadtime, that is, the time required to process all the cells over the period of time required by the particular application. Depending on the instrument, more parameters or multiple excitation beams may introduce more deadtime. Since many systems acquire data directly into computer memory buffers, the time to empty those buffers as they fill during an experiment should be taken into account. The effect of instrument deadtime on instrument performance as measured by the numbers of cells “missed” during the deadtime of the instrument is shown graphically in Figure 3.8 (from Leary, 1994).
Empirically obtaining an estimate of the functional deadtime of a particular instrument is relatively simple and has been previously described (Leary, 1994). Briefly, you will typically need a series of cell samples of concentrations from about 5 × 10⁶ to about 1 × 10⁸ cells/ml. Most flow cytometers use about 30–60 µl/min of sample, but this may vary widely with the instrument model. Then simply record the total number (n) of cells per second counted by your instrument over that number of minutes and compare with the number (N) of cells per second that should have passed through the instrument based on the product of the number of cells per milliliter times the sample volume used. Then use the equation below to calculate the deadtime. Rearranging the equation yields the familiar relationship

Defining and Measuring Instrument Performance for Rare-Cell Sorting by Queuing Theory |
65 |
N – n d =
Nn
If N and n are in cells per second, the deadtime d is in seconds. For example, if on the basis of cell concentration and volume throughput you expected 20,000 cells/s with your system and you observed only 15,000 cells/s, your instrument deadtime (under those conditions!) would be
20,000 – 15,000
d = = 16.7 × 10⁻⁶, or 16.7 µs 20,000 × 15,000
Were it not for the effects on subsequent sorting, it is well known how to account for cell–cell coincidence in the excitation source. By running known numbers of cells per second through an instrument, one can easily calculate the rate of coincidences and automatically compensate mathematically to get true total counts. Since rare cells are by definition rare, the probability of a rare-cell/rare-cell coincidence is extremely low. Hence, by correctly counting all rare cells, their frequency in the total population can be easily calculated. For this reason, obtaining rare-cell frequencies is not very difficult even at very high (e.g. 100,000 cells/s) cell analysis rates.
F i g . 3.8. Observed versus expected numbers of cells parameterized according to instrument deadtime as predicted by queuing theory modeling using Mathematica (Wolfram, 1996). Early generation commercial flow cytometers had deadtimes in the 15–20-µs range, while more recent commercial higher speed flow cytometers are now in the 5–10-µs range. Some experimental flow cytometers have been in the 2–3-µs deadtime range for over 10 years.

66 |
Rare-Event Detection and Sorting of Rare Cells |
Limitations Imposed by Live-Cell Requirements
It is frequently forgotten that many aspects of instrument performance are determined by the cells that are to be processed through those instruments. Fixed cells, while not indestructible, are nonetheless very hardy and can be subjected to relatively high shear, explosive decompression, and deceleration (on impact) forces. Many of these parameters were studied in one of the first high-speed cell sorters developed at Lawrence Livermore National Laboratory in the early 1980s (Peters et al., 1985). They and their probes being measured also tend to be more stable over time, thereby greatly reducing the constraints of experiment time required for analysis or sorting. Interestingly, the new technology of PCR has greatly affected rare-cell sorting by reducing the requirements for numbers of sorted cells needed to as few as one since the PCR reaction can amplify DNA or RNA sequences from a single copy to many millions in a few hours.
If live rare cells must be analyzed or sorted, many serious constraints are then placed on instrument design and performance. First, since the cells are frequently dying over a matter of hours, the cells must be processed as quickly as possible. Second, since live-cell probes may be changing over a short time span, that time interval of relative stability sets a major constraint on the instrument performance characteristics. Third, since live cells are relatively fragile, they cannot be exposed to excessive shear and deceleration forces or to explosive decompression extremes. Since cell flow rates and droplet generation frequencies are a function of system pressures and flow cell orifice diameters, this sets some upper limits to the rates at which cells can be processed. There is a natural engineering trade-off between the flow rates and the intercell spacing that then affects instrument analysis and sorting deadtimes and coincidences. The intercell spacing can be easily calculated by queuing theory (Leary, 1994).
DESIGNING THE IDEAL RARE-CELL SORTER INSTRUMENT
Designing an ideal rare-cell sorter involves a number of factors, some of which lead to performance trade-offs, others of which set absolute constraints. The trick for instrument designers is to keep in mind that flow cytometers/cell sorters are tightly coupled in terms of their engineering parameters. When one engineering parameter is changed, the effect frequently propagates throughout the system, sometimes in unexpected ways.
Minimal Cell–Cell Coincidence in Excitation Source While Maintaining Sufficient Overall Sensitivity
The trade-off here is minimizing the queue length in the direction of flow to minimize cell–cell coincidence in the beam, while providing enough excitation energy and fluorescence “duty cycles” to have sufficient sensitivity. This dictates a focused laser excitation spot that is ellipsoidal in structure with a semiminor axis length comparable to the diameter of the cells being analyzed and a semimajor axis of length sufficient