

Physics of biomolecules and cells
.pdf168 |
Physics of Bio-Molecules and Cells |
Fig. 1.12. BFP recovery (normalized by initial deflection) following bond rupture events at three elastic sti nesses kf . Superposed on each test is the exponential decay (dotted curve) defined by the time scale ζ/kf with a common damping coe cient ζ 5 × 10⁻⁴ pN-s/nm and each value of sti ness.
sti ness. Exponential fits to each recovery curve with decay times defined by ζ/kf were used to determine the BFP damping coe cient.
1.4.2 Stochastic process of bond failure under rising force
Because of the enormous gap in time scale between di usive relaxation (tD 10−10−10−9 s) and laboratory experiments ( 10−4 s to minutes), kinetic rates of bond dissociation can be treated as continuous functions of the instantaneous force on the laboratory time scale. In the limit of large statistics, the master equations listed in Table 1.1 describe the stochastic process of bond failure under dynamic loading. In the idealized context of a simple bond, evolution of a bound complex under force involves the net of forward → and reverse ← transitions in a single master equation,
dS1/dt = −ν→(t)S1(t) + ν←(t)S2(t) |
(1.23) |
S1(t) is the likelihood of being in the bound state and S2(t) ≡ 1 − S1(t) is the likelihood of being detached. When pulled by an elastic linkage κs(f ) at constant speed v, force and time become equivalent statistical variables

E. Evans and P. Williams : Dynamic Force Spectroscopy |
169 |
connected through the dynamical transformation df = [κs(f )v]dt. Thus, the likelihood of bond survival to a particular time can be described in terms of survival to a particular level of force [7, 10], i.e.
dS1/df = −[ν→(f ) + ν←(f )]S1(f )/rf (f ) + ν←(f )/rf (f ) |
(1.24) |
which reveals the intrinsic dependence on loading rate rf (f ) ≡ κs(f )v. The distributions of bond lifetimes and rupture forces are given by the probability density p(t) = −dS1/dt for rupture times between t → t + ∆t and the probability density p(f ) = −dS1/df for rupture forces between f → f + ∆f respectively.
1.4.3 Distributions of bond lifetime and rupture force
We begin by analyzing the loading condition where the time dependent force does not diminish with separation distance (as in Fig. 1.6). Once force rises above the thermal scale fβ for exponentiation of dissociation rate, molecules that have separated to distances beyond the barrier will continue to drift apart by force faster than di usion can recombine them. The likelihood of bond survival becomes dominated by rate of dissociation and falls rapidly. So above fβ , the bond is driven far from equilibrium and rebinding vanishes (ν←S2 0), which leads to simple relations for distri-
butions of lifetimes, p(t) ≈ ν→(t) exp{− 0→t ν→(y)dy}, and rupture forces, |
||
p(f ) ≈ [ν→(f )/rf (f )] exp{− |
0→f [ν→(y)/rf (y)]dy}. Thus, loaded by a lin- |
|
ear spring under a constant |
pulling speed, the statistics of rupture for a bond |
|
|
|
|
confined by a single-sharp barrier become universal on a dimensionless scale rf = to rf /fβ for loading rate [7, 10], i.e.
p(y) = exp{y − [exp(y) − 1]/rf }/rf |
(1.25) |
where y ≡ rf t/fβ or ≡ f /fβ and given the expression for rate of passage under force, ν→ = (1/to ) exp(f /fβ )]. For dimensionless rates rf ≥ 1, a peak appears in the distribution due to the crossover between exponentiation of the unbonding rate and the precipitous decline in bond survival under increasing force. The distribution peak at y = y is defined by ∂p(y)/∂y = 0, which yields the time t = fβ y /rf and force f = fβ y for most frequent rupture or bond lifetime and bond strength respectively. Locating the distribution peak, we see that both lifetime and strength of a bond depend logarithmically on loading rate, i.e. y = log(rf ). Hence, under constant speed separation with a linear spring (i.e. rf = κsv), observation of a straight line regime in a plot of bond strength versus log(loading rate) reveals the dominance of a single-sharp energy barrier where the slope fβ = kBT /xβ is set by the barrier projection xβ along the direction of force. Moreover, strength emerges when loading rate surpasses rf0 = fβ /to and becomes fast enough
170 |
Physics of Bio-Molecules and Cells |
to contribute kBT of energy or greater to the bond within the time for spontaneous dissociation to . Thus, the plot of most frequent rupture force as a function of log(loading rate) can establish both distance scales xβ and spontaneous rates 1/to of passage for barriers traversed in detachment of bonds, which is a spectral image of the energy landscape of a bond [7, 10]. The universal expression in equation (1.25) shows that a distribution of forces is always broadened by kinetics – even with no experimental error
– and the spread σf in rupture forces is determined by the thermal force scale, σf = fβ . Thus, the widths of force distributions should match the slopes of linear regimes observed in a dynamic force spectrum.
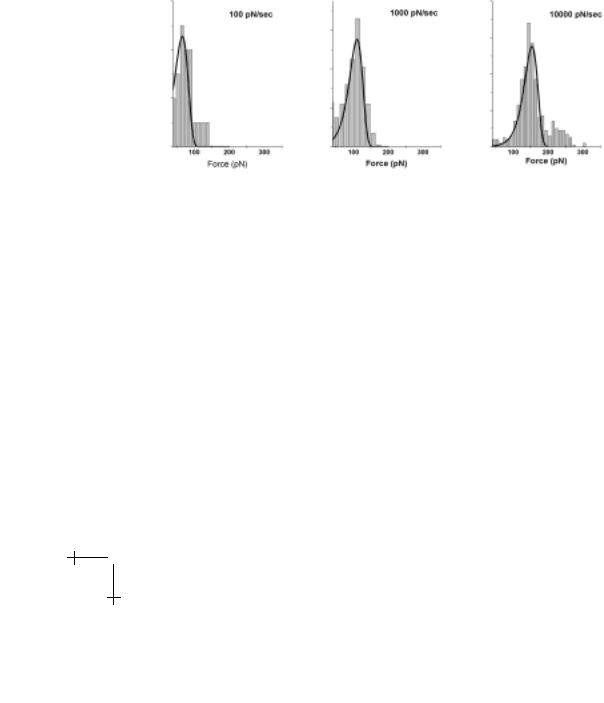
Fig. 1.13. Histograms of detachment forces for bonds between the SGP ligand and P-selectin receptor (Fig. 1.1) obtained at loading rates of 100, 1000, and 10 000 pN/s. Superposed are distributions predicted by the universal distribution for failure of an ideal bond (Eq. (1.25)) rescaled by the slope and intercept of the spectrum of most frequent rupture force versus log(loading rate) plotted in Figure 1.14.
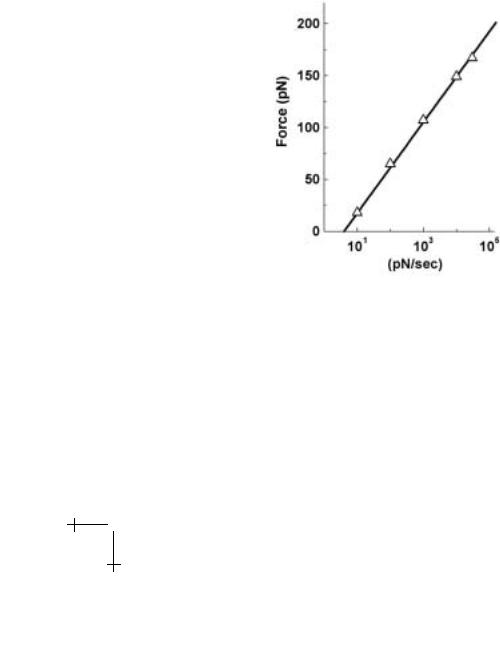
To demonstrate that these universal features arise in tests of real bonds, we take results from our recent tests of the carbohydrate-selectin interaction pictured in Figure 1.1, which surprisingly exhibits simple bond-like kinetics under force. Using a BFP, we performed thousands of repeated touches to target microspheres at set loading rates as illustrated in Figure 1.10. From these touches, a few hundred forces were obtained at each rate and collected into histograms, samples of which are shown in Figure 1.13 for a three order of magnitude span in rate. Superposed in Figure 1.13 are the universal probability distributions predicted by equation (1.25) with the thermal force fβ = 19 pN and spontaneous dissociation rate 1/to = 0.1 s−1. These force and rate scales were determined from the plot of histogram peaks as a function of log(loading rate), which is the dynamic force spectrum shown in Figure 1.14. From the close match in Figure 1.13, we see that the
E. Evans and P. Williams : Dynamic Force Spectroscopy |
171 |
distributions predicted by the slope and intercept derived from the force spectrum are fully consistent with the histograms of forces measured at each loading rate. This agreement is the requisite control for validity of the dynamic force spectrum. It is important to recognize that each probability distribution is a complete view of the stochastic process of unbonding over all time where the kinetics are imaged through a “shutter” set by loading rate. However, also keep in mind that for complex interactions like the SGP-selectin bond in Figure 1.1, observation of simple bond-like behavior most likely reflects the dominance of one of several energy barriers over a particular – but limited – range of loading rates. This span of dominance is governed by the di erence in height of the barrier relative to the next prominent barrier as we will see later.
Fig. 1.14. Dynamic spectrum of the most frequent forces in histograms as a function of log(loading rate) for bonds between the SGP ligand and P-selectin receptor (Fig. 1.1).
To examine bond strength f in more complicated processes (e.g. under nonsteady loading), the location of the maximum, ∂p(f )/∂f = 0, is found from the derivative of the general integral expression for the force distribution,
p(f ) ≈ [ν→(f )/rf (f )] exp − [ν→(y)/rf (y)]dy · (1.26)
0→f
172 |
Physics of Bio-Molecules and Cells |
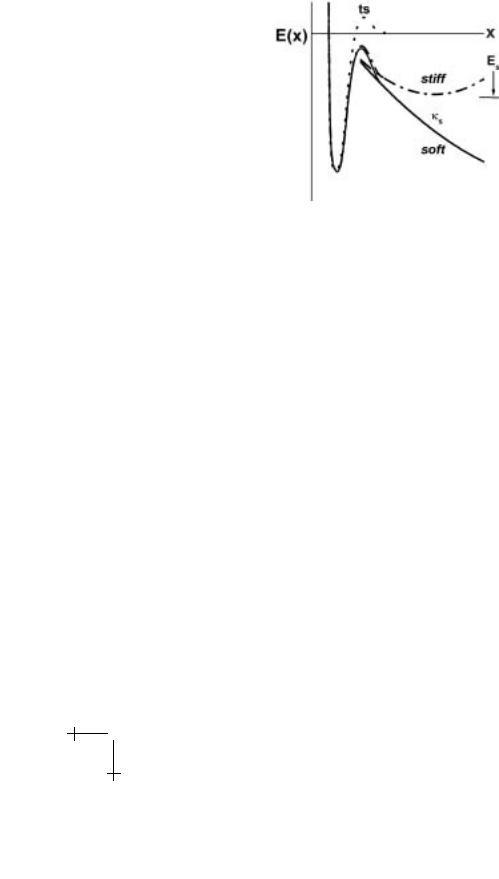
Fig. 1.15. Energy landscapes for a simple bond pulled by a soft and sti spring.
In this way, the most frequent force is specified by inversion of the following transcendental expression [7, 10]:
[ν→]f =f = rf [∂ log(ν→)/∂f − ∂ log(rf )/∂f ]f =f |
(1.27) |
which unfortunately rarely yields a simple expression for force as a function of rate like that for a single-sharp barrier. In the same way, we can directly estimate the spread σf in a force distribution using the dimensionless curvature at the peak of the distribution, i.e.
1/σ2 = [∂ log(ν→/rf )/∂f ]2 − ∂2 log(ν→/rf )/∂f 2 .
f f =f
1.4.4 Crossover from near equilibrium to far from equilibrium unbonding
Unlike the concept of persistent force with no chance of rebinding after passing the transition state, pulling on a bond with a probe applies a force that diminishes with distance and eventually changes sign to establish a capture well as depicted in Figure 1.15. Deepening and moving outward with time, the capture well facilitates rebinding until force becomes large enough to drop the energy level below the bound state minimum. Here, linkage sti - ness κs is very important since the ratio of rebinding-to-unbinding rates falls in proportion to exp(−f 2/2κs). (Note: when possible in the analyses to follow, we will employ a single barrier model for bonds and conveniently express variables in a dimensionless form defined by force f ≡ f /fβ , unbonding rate to ν→, loading rate rf ≡ rf to /fβ , and linkage sti ness
κs ≡ κsx2β /kBT .)
More subtle, linkage sti ness also modifies the reduction in barrier height under force and introduces a threshold into the dependence of unbonding

E. Evans and P. Williams : Dynamic Force Spectroscopy |
173 |
rate on force, i.e. to ν→ = exp(f − κs/2) for f ≥ κs/2. In other words, force must be large enough to push the capture well beyond the barrier to enable escape. Under rising force, the forward rate of barrier passage will eventually overwhelm the rate of reverse passage and eliminate rebinding, i.e. ν→ > ν←. This condition defines the crossover from near equilibrium – to far from equilibrium – dissociation.
To determine the impact of force on rebinding, we utilize our earlier analysis of two-state transitions. First, the barrier energy Eb, confinement length Lc, barrier width Lb, and molecular damping ζm define the time scale for spontaneous dissociation, i.e. to = (ζmLcLb/kBT ) exp(Eb/kBT ). For simple harmonic loading, the rate of forward transition will increase as an exponential of the force, to ν→ = exp(f − κs/2), given in dimensionless units. Similarly, these properties and the entrance barrier height ∆Eb
can be used to define a time scale ton ≡ (ζmLcLb/kBT ) exp(∆Eb/kBT ) for spontaneous-inward passage. As expected, the ratio of characteristic times
represents the equilibrium constant Keq = exp[(Eb −∆Eb)/kBT ] for the interaction, i.e. to /ton = Keq. Because of the sharp barrier, we will assume that the height of the entrance barrier is little a ected by application of force so the reverse rate of transition is set by the time scale ton and local density of states ρe at the entrance barrier, i.e. ton ν← ≈ ρeLc. To evaluate the entrance density of states ρe, we use Kramers approach and integrate the rebinding flux from the minimum of the capture well to the entrance barrier, i.e.
ν←{ζsLs exp(Es/kBT )/kBT } = ρs − ρe exp(Es/kBT ). |
(1.28) |
Depth of the capture well, Es/kBT = f 2/2κs −f +κs/2, and local density of
states ρs ≈ (κs/2πkBT )1/2 = (κs/2π)1/2/xβ depend on linkage sti ness; the dynamics depend on the linkage damping coe cient ζs. The Boltzmann-
weighted distance Ls from the entrance barrier to the minimum of the capture well is dominated by the decay in energy with distance from the barrier and can be approximated by Ls xβ /(f +1). Matched to the rate of inward passage defined by ton ν← = ρeLc, we eliminate the density of states ρe and establish the dependence of rebinding rate on force, i.e.
ton ν→ ≈ (κs/2π)1/2
× exp(−f 2/2κs + f − κs/2)/{(ts/ton)κs/(f + 1) + (xβ /Lc)} (1.29)
where ts ≡ ζs/κs is the characteristic relaxation time of the linkage.

174 |
Physics of Bio-Molecules and Cells |
Fig. 1.16. Dynamic spectra of most frequent rupture force as a function of log(loading rate) calculated by numerical solution (closed symbols) to the master equation (1.24) for rupture of a simple bond pulled by a linear spring. The threshold force and crossover to far-from-equilibrium detachment (solid line) depend on the linkage sti ness κs and the equilibrium constant Keq = to /ton of the bond.
Complete unbonding will occur when force rises above the level f needed to drive the forward rate of transition above the reverse rate, i.e. ν→/ν← > 1. The crossover force is easily found from the ratio of transition rates [7],
ν→/ν← ≈ (2π/κs)1/2 exp[(f 2/2κs) − log(Keq)][(ts/ton)/(f + 1) + (xβ /Lc)]. (1.30)
Hence, the force must rise above, f [2κskBT log(Keq)]1/2 to achieve complete breakage. As shown in Figure 1.16, crossover to far from equilibrium detachment occurs once loading rate is fast enough to produce forces >f , i.e. rf > (fβ /to ) exp(f /fβ ). We see that f defines a near equilibrium threshold for strength that depends on mechanical properties of the linkage as well as energetics of the bond [7]. Therefore, rebinding and the threshold for strength are predicted to diminish significantly when bonds are connected to probes by soft linkages like ideal polymers. Without going through the details, a similar ratio of transition rates can be derived for a polymer linker. With a freely jointed polymer of Lp/b

E. Evans and P. Williams : Dynamic Force Spectroscopy |
175 |
segments and b xβ , the exponential dependence on depth of the capture well in equation (1.29) is replaced by a power law (f + 1)Lp/b , which leads to f (kBT /b)[(Keq)b/Lp − 1]. Thus, for long polymer linkers, the near equilibrium threshold drops to very small forces.
1.4.5 E ect of soft-polymer linkages on dynamic strengths of bonds
Polymer linkers are essential for projecting and isolating reactive sites in single molecule experiments. Also, we’ve just seen that long polymer linkages to bonds help suppress rebinding events. However, polymer linkages alter bond strength under constant speed detachment in ways that are especially important at low speed [12]. Clearly demonstrated in Figure 1.17 with results from the work of Fernandez and coworkers [20], pulling on bonds through polymer connections produces unsteady loading where forces usually increase markedly prior to bond failure. Connected to a sti probe, a polymer linker dominates the loading rate and under constant pulling speed, loading rate increases essentially as a power law of the force level, rf (f ) ≈ (v/vβ )f 1+1/α as described earlier, where rf = rf to /fβ and f = f /fβ . Thus, loading rate becomes parameterized by a characteristic velocity, vβ = (Lp/αto )(xβ /cb)1/α, which represents the speed needed to pull the polymer taut within the time to required for spontaneous dissociation. (Recall: α = 1 & c = 1 for a freely-jointed polymer and α = 2 & c = 4 for a worm-like polymer). With the exact expression for loading rate rf (f ) ≡ (vs/vβ )g(f ) and assuming far from equilibrium detachment, the distribution of unbonding forces can be predicted by the integral expression in equation (1.26),
p(f ) ≈ (vβ /v) exp f − (vβ /v) [exp(y)/g(y)]dy /g(f ). (1.31)
0→f
Specified in reference [12], g(f ) is a complicated function that approaches f 1+1/α once force exceeds fβ (i.e. f > 1). Since unbonding usually occurs in the asymptotic regime, the most likely force for bond rupture can be easily derived using equation (1.27) and the power law approximation to loading rate,
f ≈ fβ log(v/vβ ) + fβ [log(f /fβ − 1 − 1/α) + (1/α) log(f /fβ )]. (1.32)
Equation (1.32) shows that bond strength deviates from the expected proportionality to log(detachment rate) until loading at high speeds (v vβ ). Moreover, correlation of equation (1.32) to data for rupture force versus log(pulling velocity) can only provide values of thermal force fβ and characteristic velocity vβ but not the time scale to for unbonding. To determine
176 |
Physics of Bio-Molecules and Cells |
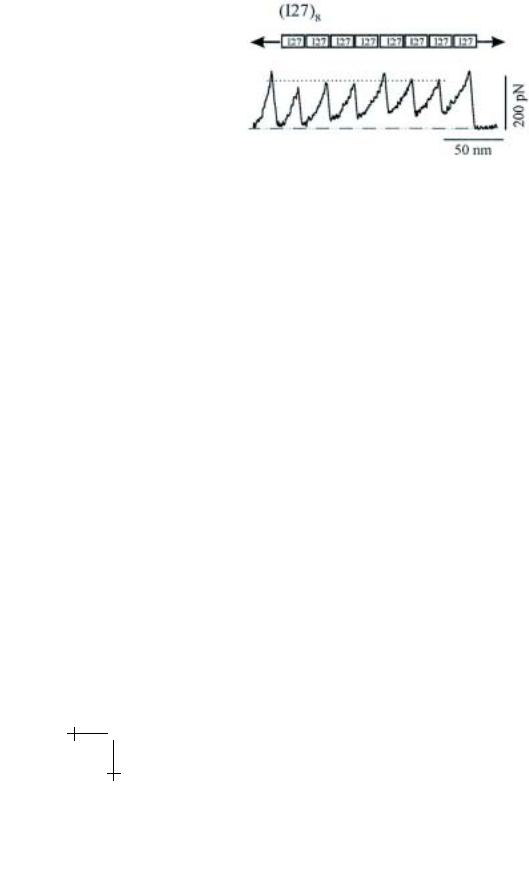
Fig. 1.17. The famous saw-tooth pattern of force obtained by pulling on a recombinant construct of eight Ig-I27 domains at constant speed with an AFM (taken from Li et al. [20]). Each precipitous drop in force signalled a bond rupture event and unfolding of an I27 domain, which added 28 nm to the contour length.
the time scale to from the parameter vβ , we need to know the polymer contour and persistence lengths (Lp, b).
Figure 1.17 is a beautiful example of bond rupture under soft polymer loading. Each rupture event led to unfolding of an Ig (I27) domain and added a well defined increment to the total chain length thereby increasing the extensional compliance. Figure 1.18 shows the average forces needed to unfold the I27 domains at di erent pulling speeds plotted on a logarithmic scale. We can roughly characterize the average force f for unfolding of N domains at a particular speed using equation (1.32) and introducing an e ective log(velocity scale) defined by the expression,
(1/N )Σj=1→N log[vβ (j)] log( vβ ). Superposed on the data in Figure 1.18, the match with equation (1.32) required a thermal force scale
of fβ ≈ 18 pN (or xβ ≈ 0.225 nm) and an e ective velocity scale of vβ ≈ 0.1 nm/s. At slow pulling speeds, the correlation (solid curve) deviates significantly from the linear behavior expected for steady loading.
To extract single domain properties from the parameters fβ and vβ , we need to recognize that there are several (N ) equivalent sites for unfolding and that the number of sites diminishes as the length of the chain increases. In particular, the unbonding rate is proportional to the number of folded domains at each step. Hence, the probability distribution for unfolding events and most likely unfolding force change at each step in the process. Given that at each unbonding step Lp(j) ≈ (j + 1)∆LI27 and to ν→ = (N −j +1) exp(f ), the velocity scale for a worm-like chain will vary
as vβ (j) ≈ (j + 1)(N − j + 1)(∆LI27/2to )(xβ /4b)1/2 and result in the following approximation for e ective velocity scale: vβ ≈ [N 2+2/N / exp(2 −
2/N )](∆LI27/2to )(xβ /4b)1/2. With the value of xβ ≈ 0.225 nm from the

E. Evans and P. Williams : Dynamic Force Spectroscopy |
177 |
Fig. 1.18. Average forces for unfolding a sequence of eight I27 domains as a function of log(pulling speeds) taken from Li et al. [20]. Superposed is the dynamic spectrum predicted by equation (1.32) using a thermal force scale of fβ ≈ 18 pN and an e ective velocity scale of vβ ≈ 0.1 nm/s. The dashed line illustrates the regime of rupture forces that would be measured if the molecular linkage possessed a constant sti ness κs ≈ 5 pN/nm.
correlation in Figure 1.18 plus a persistence length b 0.4 nm from Li et al. [20], this approximation yields vβ ≈ 3.5(∆LI27/to ). Thus, with
the length increment ∆LI27 28 nm and vβ ≈ 0.1 nm/s, we can derive the time for spontaneous unfolding of a single domain, i.e., to 1000 s.
To check our analysis, force distributions were predicted at each unfolding step using equation (1.31) with fβ ≈ 18 pN and to 1000 s under a pulling speed of 600 nm/s; then the average distribution was compared to the histogram of forces obtained at this speed by Li et al. [20]. Plotted in Figure 1.19, the close match verifies that the force events arise from convolution of simple bond-like kinetics with unsteady loading dynamics of a polymer linkage.
1.4.6 Failure of a complex bond and unexpected transitions in strength
Rupture of a complex molecular bond under rising force involves transitions over a changing landscape of multiple barriers. Here, the nontrivial aspect is that the flux of states can vary significantly with time along the reaction coordinate. As pointed out earlier, such details can only be revealed by modeling the evolution of states in a hierarchy of master equations (Table 1.1). Although rupture dynamics under rising force can be quite complicated, we will begin by showing that the most frequent unbonding forces under ramps of force can be reasonably well predicted using the single rate