

Physics of biomolecules and cells
.pdf178 |
Physics of Bio-Molecules and Cells |
Fig. 1.19. Left: histogram of forces for unfolding eight Ig-I27 domains at a pulling rate of 600 nm/s (taken from Li et al. [20]). Superposed is the average probability distribution computed using equation (1.31) plus the parameters fβ ≈ 18 pN and to 1000 s derived from the correlation in Figure 1.18 as described in the text. Because of changing length with each unfolding step, small shifts in probability distributions occurred as demonstrated at right for the first, last, and middle unfolding events (dashed and dotted curves) relative to the average distribution (open circles).
approximations derived earlier. Under rising force, the single rate approximations can be viewed as representing a dynamic barrier that moves along the reaction coordinate and changes height with time.
With the single rate approximation ν→ and a steady ramp of force rf = ∆f /∆t, distributions of unbonding forces far from equilibrium are predicted by the integral expression given in equation (1.26). Although this usually requires numerical computation, the most frequent forces f for detachment of a complex bond can be easily derived from the maximum in the distribution, equation (1.27), which locates the peak in the probability distribution. Transforming equation (1.27) to a derivative of the reciprocal rate,
1/rf = −[∂(1/ν→)/∂f ]f =f |
(1.33) |
we obtain a convenient way to derive the most frequent rupture force f from the superposition of transit times that define the single rate approximations. (The spread in the equivalent distribution is given by, 1/σf2 =
νN →[∂2(1/νN →)/∂f 2]f =f .) tion in equation (1.18), the
rate is found to be,
First, applied to the single rate approximarelation between bond strength and loading
1/rf ≈ Σn→N −1[to (n)/fβ (n)] exp[−f /fβ (n)]. |
(1.34) |

E. Evans and P. Williams : Dynamic Force Spectroscopy |
179 |
Here, energies Eb(n) and locations xβ (n) for each barrier relative to the primary minimum define the forces fβ (n) ≡ kBT /xβ (n) and spontaneous passage times to (n) ≡ tD exp[Eb(n)/kBT ] that govern the most frequent rupture force. Next, applied to the single rate approximation in equation (1.19), a similar but more complicated expression is obtained that involves the additional dependence on energies E0(n) and locations xc(n) = kBT /fc(n) of the intervening levels:
1/rf ≈ Σn=1→N −1Σj→N −n to (N − j)[1/fβ (N − j) − 1/fc(n)]
× exp[−E0(n)/kBT ] exp{f [1/fc(n) − 1/fβ (N − j)]} · (1.35)
As for the rate approximations themselves, equation (1.35) reduces to in equation (1.34) when intervening levels remain more than a few kBT above the primary minimum.
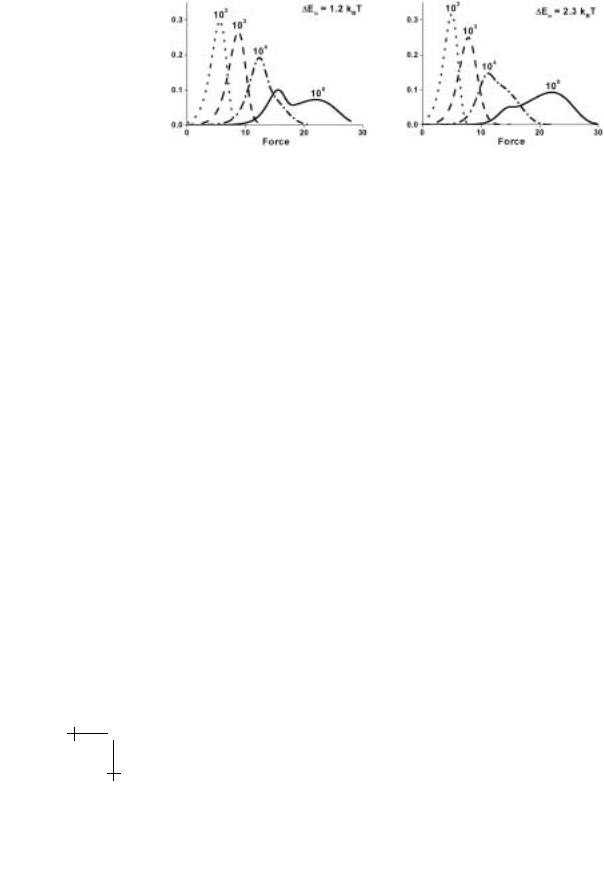
To demonstrate important features of the force spectra approximations, we compare the predictions of equations (1.34) and (1.35) in Figure 1.20 to results for the most frequent rupture forces found by numerical solution to the master equations (Table 1.1) given an energy landscape of two energy barriers. Both approximations cross over smoothly from a linear regime (low slope) for the outer barrier to the linear regime (high slope) for the inner barrier with heights defined relative to the primary minimum. Predicted by equation (1.35) and shown in Figure 1.20 (left), the crossover region spans a broad range of loading rates when the secondary minimum between the barriers is low and di ers little from the primary minimum (here E0 1kBT ). On the other hand, the crossover region diminishes to a narrow range of rates once the intervening level is raised to E0 3kBT as in Figure 1.20 (right) and consistent with the reduced approximation in equation (1.34). The simple geometric construction in Figure 1.20 (left) shows that the width of the crossover region can be anticipated from the intersection between an intermediate-linear regime and the limiting linear regimes for the two barriers. Arising from the exponential dependence on force in equation (1.35), this intermediate regime is specified by the differences of location and energy between the intervening minimum and the barrier that follows. As the energy E0 of the minimum is increased, the intermediate regime shifts to higher loading rates and eventually falls below the crossing of the limiting regimes for the outer and inner barriers. This defines a critical energy E0 below which the secondary minimum becomes important.
Superposed on the spectra predicted by the single-rate approximations in Figure 1.20 are the most frequent rupture forces derived from the probability densities of failure computed numerically with the master equations in Table 1.1. As shown by the force distributions for a deep intervening minimum in Figure 1.21 (left), an unexpected jump in bond strength

180 |
Physics of Bio-Molecules and Cells |
Fig. 1.20. Left: the dynamic force spectrum (solid curve) predicted by the singlerate approximation in equation (1.35) compared to results (open triangles) from numerical solution of the master equations (Table 1.1) for a hierarchy of two barriers. Superposed are linear regimes expected for force log(loading rate) defined by the transition rate 1/to (n) and force scale fβ (n) for each barrier relative to the primary minimum. Also plotted is the intermediate-linear regime defined by the di erences in energy and location of the outer barrier relative to the secondary minimum. Force, time, and loading rate are scaled by outer barrier properties, which were set equal to one. In these units, fβ (2) = 1, to (2) = 1, and rf (0) = 1, properties of the inner barrier and secondary level were specified as, fβ (1) = 4 and to (1) = 0.01 plus fc(1) = 3 and E0(2) = 1.2kB T respectively. Right: the dynamic force spectrum (solid curve) predicted by the single-rate approximation in equation (1.34) compared to results (open triangles) from numerical solution of the master equations for the same barriers but with E0(2) = 3kBT .
occurs in the crossover region as a second peak emerges in the distribution under increased loading rate and eventually overtakes the initial peak. On the other hand, when the secondary minimum is raised, only a single peak appears in each distribution that shifts upward and broadens continuously in force with increased loading rate. Thus, energy landscapes with multiple barriers and deep intervening minima can produce dynamical transitions in rupture strength with first order-like coexistence and switching of peaks in distributions of failure events, which is likely to play an important role in dynamic functions of bonds under stress. We see that there are many opportunities for surprises in the highly nonlinear dynamics of bond breakage!
E. Evans and P. Williams : Dynamic Force Spectroscopy |
181 |
Fig. 1.21. Force distributions predicted by the master equations in Table 1.1 at each decade of loading rate for unbonding impeded by two barriers. The scales of force and spontaneous passage time for the outer barrier have been set equal to one, i.e. fβ (2) = 1, to (2) = 1, and rf (0) ≡ 1. As for Figure 1.19 above, the inner barrier and secondary level are defined by, fβ (1) = 4 and to (1) = 0.01 plus fc(1) = 3 and E0(2) = 1.2kBT or 2.3 kBT respectively.
The power of DFS is the capability to quantify these dynamics in a way that can reveal the hierarchy of barriers in a complex interaction. However, the challenge is to measure forces over many orders of magnitude in loading rates.
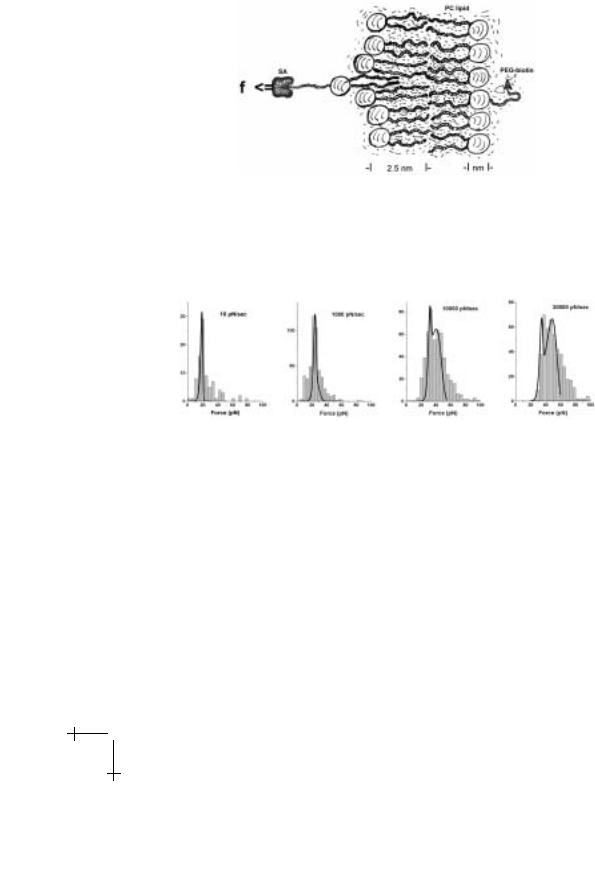
Under steady ramps of force in time, the signature of escape over a sharp energy barrier is a straight line in a plot of rupture force versus log(loading rate). Although unexpected, tests of the SGP ligand and P-selectin exhibited simple bond-like kinetics under force as seen in Figures 1.13 and 1.14. Here, on the other hand, we will use tests of a far simpler interaction – hydrophobic anchoring of lipids in a membrane – to demonstrate dynamic failure of a complex interaction. To test lipid anchoring strength, we decorated the tip of a BFP with PEG-biotin chains and prepared giant phosphatidyl choline PC lipid vesicles doped with a small fraction of PEG-biotinylated PE lipid (diC14 phosphatidyl ethanolamine). Pre-equilibration of both surfaces with streptavidin SA was then used to block nearly all biotin groups leaving only a few sites for probe-vesicle attachment. Many touches of the BFP tip to vesicles led to a few extraction events as illustrated schematically in Figure 1.22. Sample histograms of the forces are presented in Figure 1.23 for a three thousand-fold range in loading rate.
We see in Figure 1.23 that only small forces were needed to extract diC14 PE lipids from the surface of a C18:0/1 PC lipid bilayer even at fast loading rates. Moreover, we also see that the force distributions begin very narrow at slow rates of loading, then broaden and become bimodal at fast rates of loading. Clearly similar to the complex landscape in the idealized
182 |
Physics of Bio-Molecules and Cells |
Fig. 1.22. Schematic of PEG-biotin lipid extraction from a lipid bilayer membrane. For typical biomembrane lipids (e.g. C18:0/1 phosphatidyl choline), X-ray di raction yields a mass average thickness of 4 nm for the full membrane [25]. Augmented by headgroup structure, the distance from the midplane to the headgroup-water boundary is estimated to be 2.5 nm as sketched above.
Fig. 1.23. Distributions of forces measured by BFP in extraction of single receptor lipids (biotin-PEG-diC14 PE) from C18:0/1 PC lipid vesicles.
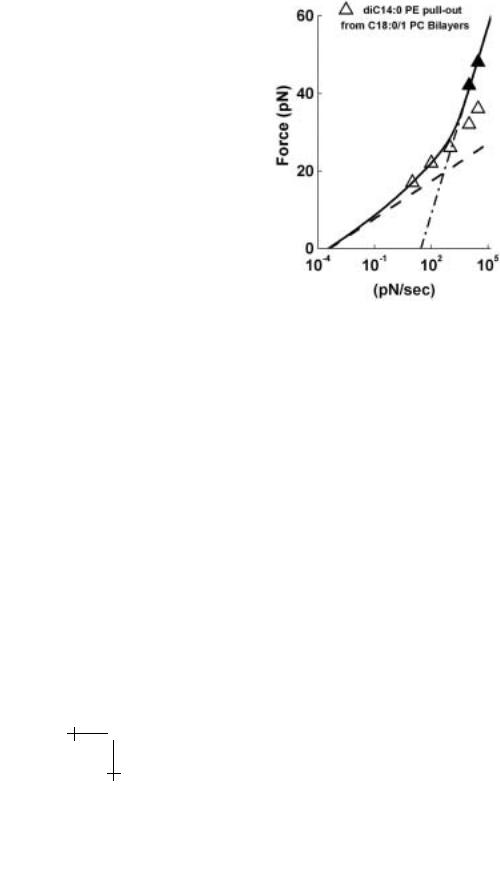
model described above, the histograms in Figure 1.23 correlate well with the probability distributions (superposed) predicted by solution of the master equations for an optimal sequence of two energy barriers punctuated by a deep intervening minimum. Matched to the most frequent forces obtained from experiment, Figure 1.24 shows the dynamic spectrum of anchoring strength predicted by the single-rate approximation equation (1.35) with the locations and energies for the two barriers and intervening level used in the numerical computation of probability densities. As in the model above, the continuous spectrum approaches the limiting linear regime set by the properties of the outer barrier at very slow loading and the limiting linear regime set by properties of the inner barrier at very fast loading.
E. Evans and P. Williams : Dynamic Force Spectroscopy |
183 |
Fig. 1.24. The dynamic force spectrum (solid curve) predicted by the single-rate approximation in equation (1.35) (solid line) compared to locus of most frequent extraction force (open/closed triangles) from the experimental distributions plotted in Figure 1.23. Also shown are the limiting linear regimes for two barriers defined by the transition rate 1/to (n) and force scale fβ (n) for each barrier relative to a primary minimum: fβ (2) = 1.4 pN and to (2) = 3 × 10³ s for the outer barrier; fβ (1) = 7 pN and to (1) = 0.25 s for the inner barrier. Derived from correlation to the evolution of the two peaks in the force distributions with loading rate (Fig. 1.22), the intervening level was found to be characterized by a force scale fc(1) = 4 pN and an energy level E0(2) = 2kBT above the primary minimum.
Based on established concepts of hydrophobic interactions [32], we expect the anchoring potential to increase in energy linearly with distance as the lipid is displaced outward along the surface normal. The energy barrier to extraction should scale as the number of CH2 groups exposed to water with a proportionality of 1kBT per CH2 [32]. So taking tD 10−9 s as the di usive relaxation time for lipid “hopping” motions, the time scale for spontaneous dissociation into aqueous solution would be to (10−9 s) exp(NCH2 ). Although di cult to measure for diacyl lipids with more chains longer than 12 carbons, this scaling for to agrees with results for PEG-lipid dissociation from bilayer membranes in solution [28]

184 Physics of Bio-Molecules and Cells
and even yields a value of 10−9 s for the pre-exponential factor. Likewise, analysis of the force distributions in Figure 1.23 and the spectrum in Figure 1.24 yields a time scale to (2) = 3 × 10³ s for passage of the outer barrier which is consistent with the spontaneous time for escape of a diC14 receptor lipid under zero force in solution [28]. Another expectation based on this description of hydrophobic interactions is that the
thermal force scale fβ should be set by the insertion depth xlipid in the membrane, i.e. fβ = kBT /xlipid. As sketched in Figure 1.22, the distance from the headgroup-water boundary to the midplane of a C18:0/1 phos-
phatidyl choline bilayer would define a limiting value for insertion depth of
xlipid 2.5 nm [25], which could be accommodated by full extension of the diC14 PE lipid (i.e. 14 × 0.125 nm for chain length plus 1 nm for head-
group 2.8 nm). Interestingly, the distance derived from the thermal force scale for the outer barrier of xβ (2) = kBT /1.4 pN ≈ 2.9 nm is comparable to the maximum insertion depth of 2.8 nm. However, the slightly longer length derived from force spectroscopy could be due to a small outward deformation of the lipid interface as sketched in Figure 1.22. Because of the large length scale associated with hydrophobic anchoring, we see that the thermal force scale [fβ (2) = 1.4 pN] is small and the extraction force distributions are very narrow at slow loading rates (Fig. 1.23).
Fig. 1.25. Schematic of the energy landscape for diC14 PE anchoring in a C18:0/1 PC bilayer. Barrier locations and relative energies were obtained from analysis of the extraction force distributions (Fig. 1.23) and force spectrum (Fig. 1.24) as described above. However, to specify the depths of minima, a value has to be specified for the di usive relaxation time of lipid “hopping” motions, which here was taken to be tD 10−9 s.
Consequently, anchoring strength remains weak under slow loading and, even when the time needed for lipid extraction is decreased more than million-fold (i.e. from 3000 s to 0.001 s), extraction forces only reach 20 pN.

E. Evans and P. Williams : Dynamic Force Spectroscopy |
185 |
Unexpectedly, however, lipid anchoring strengthens abruptly when lipids are forced to dissociate in less than 0.001 s, which requires loading rates 10 000 pN/s and above. Here, a broad second peak appears in the force distributions and the narrow peak wanes. The emergence of a broad peak stems from impedance to dissociation caused by a second barrier characterized by a small length scale, i.e. xβ (1) = kBT /7 pN ≈ 0.6 nm. Encountered first along the extraction pathway, this initial barrier probably represents impedance to disruption of the headgroup interface (e.g. weak hydrogen bonding as well as hydrophobic exposure) and appears to be followed by a secondary minimum at 1 nm. Putting together these features, Figure 1.25 demonstrates how dynamic force spectroscopy reveals the inner complexity of hydrophobic anchoring in membranes and significantly extends the test tube picture of the energy landscape for kinetics.
1.5 Summary
We have seen that measuring bond detachment forces and lifetimes under steady loading can provide an intimate view of prominent energy barriers that govern physical strength and limit bond dissociation under stress. Moreover, the distribution of rupture events at each loading speed is a complete picture of the unbonding process in time as barriers fall at a particular rate. Even though dynamic force spectroscopy allows us to look inside molecular interactions, specific experimental requirements must be met in order to achieve a reliable picture of the landscape. Not only do we need an accurate and sensitive force probe, we have to be confident that we are only testing single molecular attachments. This means we have to chemically decorate surfaces with dilute sites for attachments and to also regulate the assembly process (e.g. through very soft touch under feedback control). Next, we have to know the compliance properties of the linkage to the bond (e.g. the contour and persistence lengths of polymeric connections) and the dynamic response when coupled to the probe. Having met these requirements, it is imperative to measure forces over an enormous range of time scales, or more specifically, loading rates. Having satisfied these criteria, the final-critical step is to compare the histograms of rupture events measured at each loading rate to the probability densities predicted by the thermal forces and spontaneous transition times derived from the dynamic force spectrum.
The authors gratefully acknowledge support from US National Institutes of Health grants HL 65333 & HL31579, Medical Research Council of Canada grant MT7477 (to EE) plus support from the Engineering and Physical Sciences Research Council, the Biological and Biomedical Sciences Research Council, Universitas 21 and the University of Nottingham (to PMW).

186 |
Physics of Bio-Molecules and Cells |
References
[1]A. Ashkin, Biophys. J. 61 (1992) 569; ibid, Proc. Natl. Acad. Sci. USA 94 (1997) 4853.
[2]A. Ashkin, K. Schutze, J.M. Dziedzic, U. Euteneuer and M. Schliwa, Nature 348 (1990) 346.
[3]D. Bartolo, I. Derenyi and A. Ajdari (private communication).
[4]G.I. Bell, Science 200 (1978) 618.
[5]G. Binning, C.F. Quate and C.H. Gerber, Phys. Rev. Lett. 56 (1986) 930.
[6]A. Einstein, Ann. Physik 17 (1905) 549; ibid, Ann. Physik 19 (1906) 371.
[7]E. Evans, Faraday Discuss. 111 (1998) 1; ibid, Annu. Rev. Biophys. Biomol. Struct.
30 (2001) 105.
[8]E. Evans, A. Leung, D. Hammer and S. Simon, Proc. Natl. Acad. Sci. USA 98 (2000) 3784.
[9]E. Evans and F. Ludwig, J. Phys. Cond. Matt. 12 (2000) 315A.
[10]E. Evans and K. Ritchie, Biophys. J. 72 (1997) 1541.
[11]E. Evans, K. Ritchie and R. Merkel, Biophys. J. 68 (1995) 2580.
[12]E. Evans and K. Ritchie, Biophys. J. 76 (1999) 2439.
[13]J. Fritz, A.G. Katopodis, F. Kolbinger and D. Anselmetti, Proc. Natl. Adad. Sci. USA 95 (1998) 12283.
[14]M. Grandbois, M. Beyer, M. Rief, H. Clausen–Schaumann and H.E. Gaub, Science 283 (1999) 1727.
[15]H. Grubmuller, B. Heymann and P. Tavan, Science 271 (1996) 997.
[16]P. Hanggi, P. Talkner and M. Borkovec, Rev. Mod. Phys. 62 (1990) 251.
[17]S. Izrailev, S. Stepaniants, M. Balsera, Y. Oono and K. Schulten, Biophys. J. 72 (1997) 1568.
[18]H.A. Kramers, Physica (Utrecht) 7 (1940) 284.
[19]S.C. Kuo and M.P. Sheetz, Science 260 (1993) 232.
[20]H. Li, A.F. Oberhauser, S.B. Fowler, J. Clarke and J.M. Fernandez, Proc. Natl. Acad. Sci. USA 97 (2000) 6527.
[21]H. Lu and K. Schulten, Proteins Struct. Funct. Genet. 35 (1999) 453.
[22]S.-J. Marrink, O. Berger, P. Tieleman and F. Jahnig, Biophys. J. 74 (1998) 931.
[23]P.E. Marszalek, H. Lu, H. Li, M. Carrion-Vazquez, A.F. Oberhauser, K. Schulten and J.M. Fernandez, Nature 402 (1999) 100.
[24]R. Merkel, P. Nassoy, A. Leung, K. Ritchie and E. Evans, Nature 397 (1999) 50.
[25]W. Rawicz, K. Olbrich, T. McIntosh, D. Needham and E. Evans, Biophys. J. 79 (2000) 328.
[26]M. Rief, M. Gautel, F. Osterhelt, J.M. Fernandez and H.E. Gaub, Science 276 (1997) 1109.
[27]P.J. Rossky, J.D. Doll and H.L. Friedman, J. Chem. Phys. 69 (1978) 4628.
[28]J.R. Silvius and M.J. Zuckermann, Biochem. 32 (1993) 3153.
[29]W.S. Somers, J. Tang, G.D. Shaw and R.T. Camphausen, Cell 103 (2000) 467.
[30]T. Strunz, K. Oroszlan, R. Shafer and H.-J. Guntherodt, Proc. Natl. Acad. Sci. USA 96 (1999) 11277.
[31]K. Svoboda, C.F. Schmidt, B.J. Schnapp and S.M. Block, Nature 256 (1993) 721.
[32]C. Tanford, The Hydrophobic E ect (Wiley-Interscience, New York, 1973).
[33]N.G. van Kampen, Stochastic Processes in Physics and Chemistry (North-Holland Elsevier, Amsterdam, 1992).

E. Evans and P. Williams : Dynamic Force Spectroscopy |
187 |
Part 2: P. Williams and E. Evans
2 Dynamic force spectroscopy. II. Multiple bonds
2.1 Hidden mechanics in detachment of multiple bonds
Dynamic force spectroscopy (DFS) is a uniquely powerful tool to investigate the physics and chemistry of molecular interactions. It is not surprising, therefore, the extent of research in both the physical and life sciences into the use of DFS for such areas as structural biology, rational drug design and biomaterials science. When attempted, though, it is soon discovered that a major complication in the measurement of bond strength is often the occurrence of multiple bond attachments. Moreover, single attachments between macromolecules often involve bonding interactions distributed over many widely separated groups and behave as multiply-bonded systems. Although careful sample preparation methods and high skills in surface chemistry may mean that the numbers or densities of sites for binding are known, force spectra will always involve some multiply-bonded structures which can be di cult or impossible to interpret because the partition of force and degree of cooperativity amongst binding sites is unknown. Fortunately, examining dynamic rupture strength for a few generic types of multiple bonds can provide useful insights into the nature of hidden interactions in a molecular assembly. We begin by describing simple mechanical scenarios for multiple bonds. The first case is a series or chain of bonds where the force is experienced fully by each bond in the system. By comparison, the second case is a zipper which is a series of bonds where the force is applied only to the lead bond; once that bond fails, force propagates to the next and so on. Finally, the third case is parallel bonds where the force is partitioned equally amongst existing bonds in an attachment. These idealized cases are simple stereotypes of multiple bond attachments. It is important to recognize that structural deformation on the nanoscale can lead to very di erent conditions of loading for multiple bonds. Still, the series, zipper, and parallel bond descriptions encompass a broad range of configurations. Thus, we consider two general architectures in which multiple interactions withstand stress; that in which force is shared across the intact connections
– the parallel description – and that in which one or more bonds feel all of the force – a serial description. These are illustrated in Figure 2.1. As we see, the zipper is a specific case of bonds loaded in series where the bonds connecting two surfaces are broken one after the other. In Part I we have already described a experiment where a series of bonds was ruptured, i.e. the unfolding of Ig domains in the muscle protein titin (Sect. 1.4.5 of Part I), which will come up again in this part.