

Matta, Boyd. The quantum theory of atoms in molecules
.pdf923 Atomic Response Properties
Table 3.5 Atomic and bond contributions (in cgs-ppm) to the magnetizability tensor of naphthalene (B/S).
Atom, W |
w(W)zz |
wp(W)zz |
wc(W)zz |
wc(WSL1)zzL1 wc(WSL2)zzL2 |
wc(WSL3)zzL3 |
|||
C1 |
21.020 |
2.850 |
18.171 |
7.778 C6 |
5.196 C4 |
5.196 C9 |
||
C4 |
15.183 |
3.145 |
12.038 |
5.514 C5 |
5.139 C6 |
1.385 H13 |
||
C7 |
16.257 |
3.567 |
12.689 |
5.479 C8 |
5.865 C10 |
1.345 H17 |
||
H11 |
2.079 |
1.294 |
0.785 |
0.785 C10 |
|
|
||
H12 |
2.083 |
1.273 |
0.811 |
0.811 C9 |
|
|
|
|
Total |
184.449 |
42.812 |
141.637 |
|
|
|
|
|
|
|
|
|
|
|
|
|
|
Atom, W |
w(W)yy |
wp(W)yy |
wc(W)yy |
Atom, W |
w(W)xx |
wp(W)xx |
wc(W)xx |
|
|
|
|
|
|
|
|
|
|
C1 |
3.091 |
0.978 |
2.113 |
|
C1 |
3.622 |
1.241 |
2.381 |
C4 |
3.786 |
1.182 |
2.604 |
|
C4 |
5.336 |
3.351 |
1.985 |
C7 |
5.184 |
2.761 |
2.423 |
|
C7 |
4.006 |
1.910 |
2.095 |
H11 |
1.827 |
1.316 |
0.511 |
|
H11 |
1.425 |
1.274 |
0.151 |
H12 |
1.194 |
1.194 |
0.000 |
|
H12 |
1.978 |
1.322 |
0.656 |
Total |
54.143 |
27.765 |
26.378 |
|
Total |
58.223 |
33.913 |
24.310 |
|
|
|
|
|
|
|
|
|
Atom, W |
w(W)iso |
wp(W)iso |
wc(W)iso |
Atom, W w(W)aniso |
wp(W)aniso |
wc(W)aniso |
||
C1 |
9.244 |
1.689 |
7.555 |
|
C1 |
17.664 |
1.740 |
15.924 |
C4 |
8.102 |
2.559 |
5.542 |
|
C4 |
10.622 |
0.878 |
9.744 |
C7 |
8.482 |
2.746 |
5.736 |
|
C7 |
11.662 |
1.232 |
10.43 |
H11 |
1.777 |
1.295 |
0.483 |
|
H11 |
0.452 |
þ0.001 |
0.454 |
H12 |
1.752 |
1.263 |
0.489 |
|
H12 |
0.498 |
0.014 |
0.483 |
Total[a] |
98.938 |
34.830 |
64.108 |
|
Total |
128.267 |
11.973 |
116.293 |
a An experimental value for the isotropic magnetizability of naphthalene is 91.6 cgs-ppm [24].

3.10 Atomic Contributions to Magnetizabilities of Closed-Shell Molecules 93
Fig. 3.15 Current density trajectories induced in the nuclear plane of naphthalene by a magnetic field applied along the þZ axis, i.e. coming out of the page. Arrows indicate direction of current flow. Counterclockwise flow is paramagnetic whereas clockwise flow is diamagnetic. Interatomic surfaces (bold) and bond paths (semi-bold) are also shown.
Fig. 3.16 Current density trajectories which intersect a plane @1.0 a.u. above the nuclear plane of naphthalene and induced by a magnetic field applied along þZ axis, i.e. coming out of the page. Arrows indicate direction of current flow. Counterclockwise flow is paramagnetic whereas clockwise flow is diamagnetic. Interatomic surfaces (bold) and bond paths (semi-bold) in the nuclear plane are also shown.

94 3 Atomic Response Properties
References
1 |
R.F.W. Bader, Atoms in Molecules: a |
13 |
P.W. Atkins, Molecular Quantum |
|
Quantum Theory, Oxford University |
|
Mechanics – Second Edition, Oxford |
|
Press, Oxford UK, 1990. |
|
University Press, Oxford UK, 1983. |
2 |
R.F.W. Bader, A. Larouche, C. Gatti, |
14 |
E.B. Wilson Jr., J.C. Decius and P.C. |
|
M.T. Carroll, P.J. MacDougall and |
|
Cross, Molecular Vibrations, Dover |
|
K.B. Wiberg, J. Chem. Phys, 1987, 87, |
|
Publications, Inc, New York, 1955. |
|
1142. |
15 |
Y. Yamaguchi, M. Frisch, J. Gaw, H.F. |
3 |
K.E. Laidig and R.F.W. Bader, J. Chem. |
|
Schaefer III and J.S. Binkley, J. Chem. |
|
Phys, 1990, 93, 7213. |
|
Phys., 1986, 84, 2262. |
4 |
R.F.W. Bader, T.A. Keith, K.M. Gough |
16 |
S.T. Epstein, The Variation Method in |
|
and K.E. Laidig, Mol. Phys., 1992, 75, |
|
Quantum Chemistry, Academic Press, |
|
1167. |
|
NY, 1974. |
5 |
T.A. Keith and R.F.W. Bader, Chem. |
17 |
C.J. Jameson and A.D. Bucking- |
|
Phys. Lett., 1992, 194, 1. |
|
ham, J. Chem. Phys., 1980, 73, |
6 |
R.F.W. Bader and T.A. Keith, J. Chem. |
|
5684. |
|
Phys., 1993, 99, 3683. |
18 |
T.A. Keith and R.F.W. Bader, Can. J. |
7 |
R.F.W. Bader and T.A. Keith, Int. J. |
|
Chem., 1996, 74, 185. |
|
Quant. Chem., 1996, 60, 373. |
19 |
T.A. Keith and R.F.W. Bader, Chem. |
8 |
R.F.W. Bader, D. Bayles and G.L. |
|
Phys. Lett., 1993, 210, 223. |
|
Heard, J. Chem. Phys., 2000, 112, 10095. |
20 |
T.A. Keith and R.F.W. Bader, J. Chem. |
9 |
R.F.W. Bader and C.F. Matta, Int. J. |
|
Phys., 1993, 99, 3669. |
|
Quant. Chem., 2001, 85, 592. |
21 |
J.A.N.F. Gomes, Phys. Rev. A, 1983, |
10 |
R.F.W. Bader, Mol. Phys., 2002, 100, |
|
28, 559. |
|
3333. |
22 |
P. Pascal, Ann. Chim. Phys., 1910, |
11 |
LAPACK – Linear Algebra PACKage, |
|
19, 5. |
|
http://www.netlib.org/lapack |
23 |
P. Lazzeretti, Prog. in Nuc. Mag. Res. |
12 |
L.-T. Ching, W. Tam, S.H. Stevenson, |
|
Spec., 2000, 36, 1. |
|
G. Meredith, G. Rikken and S.R. |
24 |
CRC Handbook of Chemistry and |
|
Marder, J. Phys. Chem., 1991, 95, 10631. |
|
Physics, 82nd edn, 2001–2002. |

95
4
QTAIM Analysis of Raman Scattering Intensities: Insights into the Relationship Between Molecular Structure and Electronic Charge Flow
Kathleen M. Gough, Richard Dawes, Jason R. Dwyer,
and Tammy L. Welshman
4.1 Introduction
The investigation of the interplay between molecular structure and molecular properties is one that still captivates the imagination. The chemist today relies on computational modeling to gain insight into known properties and to help predict the behavior of systems for which experimental data are lacking. This two-way exchange epitomizes the conversation between experimentalists and theoreticians and shows us the way forward in developing our science. New theories breathe new life and meaning into existing experimental techniques and lead to the discovery of new truths and insight. Nature has all the answers and we have but to find them. In this chapter we will outline one such conversation – that between Raman spectroscopy and the quantum theory of atoms in molecules (QTAIM). Absolute Raman scattering intensities are di cult to measure yet they contain much valuable information. As such, they are intrinsically interesting, but they also provide an excellent framework on which to compose another theoretical–experimental conversation. QTAIM brings a unique and critical element to this enterprise; through this analysis, Raman spectroscopy is cast as an extremely sensitive probe of the structural origins of molecular function. We will discover that despite experimental and computational challenges, this dualpronged approach yields great rewards.
We have seen in previous chapters the power of real-space analysis and the transferability of some functional group properties but now we will examine nontransferable properties. Nontransferable properties are those molecular properties which cannot be partitioned into functional groups independent of the molecular setting. It must be emphasized that the failure of some molecular properties to partition into neat functional group categories is no failure of QTAIM, but is instead a reflection of nature. The power of QTAIM in these instances is to analyze the detailed electronic distribution using the convenience and familiarity of realspace rather than an unwieldy multidimensional wavefunction. The electron dis-

96 4 QTAIM Analysis of Raman Scattering Intensities
tributions of molecules with ‘‘fixed’’ nuclei have been well characterized by use of QTAIM [1] and X-ray crystallographic experiments [2]. We now seek the response of the electron distribution to an infinitesimal structural perturbation in the presence of a field that can easily be related to the experimental Raman intensity of a given vibration.
Chemists traditionally think of molecular vibrations according to two di erent paradigms – normal mode analysis and functional group identification. The former is well understood [3, 4] but the quantity and quality of detailed experimental information required to obtain a reliable, experimentally refined harmonic force field ensures that this approach is usually restricted to molecules with no more than 20 atoms [5, 6]. The latter is derived from the nature of molecular vibrations, because shared functionality often produces similar characteristic vibrational modes (e.g. CH stretching modes lie between 2700 and 3200 cm 1; CbO stretches will be found between 1600 and 1900 cm 1).
The vibrational frequency is based on mechanical properties (anharmonically oscillating atomic masses) whereas the intensity is a function of the change in permanent (infrared) or induced (Raman) dipole moment. Normal mode analyses of larger molecules [6] reveal that vibrations assigned to a particular functional group always involve some displacement of many other nuclei. Thus, the variability in the frequency of modes assigned to specific functional groups is because a molecular vibration is always a property of the entire molecule. We continue to use functional group assignment because of its simplicity and utility, while recognizing the limitations.
Analysis of vibrational intensities has often been approximated in terms of changes in the local dipole moment (permanent or induced) associated with a change in functional group geometry. The same limitations and caveats – that functional groups are useful organizing principles but not rigorously transferable
– apply, perhaps even more strongly. In this chapter, we will present a brief introduction to the problem of Raman scattering intensities, a detailed description of our theoretical approach to its solution, and a discussion of the insight we have achieved by means of QTAIM analysis. The resulting insights go beyond an explanation of Raman intensities and lead to improved understanding of the very underpinnings of molecular properties and charge flow. This is accompanied by some worked examples and suggested exercises for the reader.
4.2
Background to the Problem
Experimental measurements of absolute Raman trace scattering cross-sections provide a direct physical link to the redistribution of charge in a vibrating molecule. As such, they are an excellent probe for exploring the behavior of molecules in electric fields. The magnitude of the scattering cross-section, also called intensity, depends on the magnitude of the change in the molecular polarizability ten-

4.2 Background to the Problem 97
sor, a, during a vibration, where a is a measure of the magnitude of the dipole moment ðmÞ induced in a molecule when an electric field (E) is applied:
m ¼ aE |
ð1Þ |
The derivative of the polarizability with respect to some normal mode of vibration (q) is denoted qa=qq. Our original interest in this problem derived from the failure of the bond polarizability model [7], an early, extant description of Raman intensities. This model simplifies the problem by considering a to be a sum of independent bond polarizability ellipsoids, directed along each bond, in much the same way that the molecular dipole moment is sometimes approximated as a sum of bond dipoles. Parameters for the bond polarizability model were constructed from experimental data, primarily on alkanes, and some limited transferability between molecules was reported [7]. One of the most commonly used assumptions was that the derivative for the CH stretch vibrations was unchanged for a wide variety of hydrocarbons, including saturated alkanes, alkenes, alkynes, and aromatic compounds. Our experimental studies show that this approximation is not valid, even for relatively simple alkanes [6, 8–13]. It is moderately valid when the average intensity of a few small molecules is considered; it fails completely, however, when individual bonds are examined by selective deuteration. The model fails because the derivative, and hence the observed scattering intensity, arises from a change in the mean molecular polarizability, in turn dependent on charge redistribution throughout the entire molecule, not just within one bond.
4.2.1
Conceptual Approach to a Solution
Our guiding principle has been the conversation between experiment and theory. Raman trace scattering intensities provide information about the change in molecular charge distribution during a vibration. Ab initio calculations yield wavefunctions that, through QTAIM, let us examine the atom-by-atom response of the charge density to the applied field. Our early work was directed toward identification of the variability in polarizability derivatives for a series of simple alkanes. Subsequent theoretical modeling revealed the presence of patterns that enabled us to interpret and predict the behavior of much larger systems.
4.2.1.1Experimental Measurement of Raman Scattering Intensities
The process of Raman scattering is well understood and is described in many standard texts [14]. According to the Placzek polarizability theory [15] the di erential Raman scattering cross-section of a fundamental vibrational band (qs=qW, where W ¼ solid angle in this expression) depends on the square of the derivative of the invariants of the molecular polarizability (a and g):
98 |
4 QTAIM Analysis of Raman Scattering Intensities |
|
|
|
|
|
|
|
|
|
||||||||||||||||
|
|
|
|
|
|
|
|
|
ð |
|
0 |
|
|
Þ |
gi |
"45 |
|
|
|
|
7 |
|
|
# |
2 |
|
|
|
|
|
|
|
|
|
|
|
|
|
|
|
|
|
|
|
|
||||||||
|
|
|
|
|
|
|
|
|
|
|
|
|
|
|
|
|
|
|||||||||
|
qW |
¼ |
90e |
|
2 |
|
|
n |
hc=kT |
|
|
|
þ |
|
|
Þ |
||||||||||
|
|
|
|
1 e |
i |
|
|
|
|
|
|
ð |
||||||||||||||
|
|
qs |
|
p2 |
|
|
n |
ni 4 |
|
qa |
2 |
|
|
qg |
2 |
|
|
|||||||||
|
|
|
i |
|
|
0 |
|
|
|
|
|
|
|
|
i |
|
|
|
|
i |
|
|
|
|||
where n0 and ni are the wavenumbers of incident light and the vibration, respectively, gi is the degeneracy of the ith vibrational mode, and h, k, T, and e0 have the usual meaning (details are given in our experimental papers [6, 8–13]). This theory assumes that mechanical and electrical anharmonicity are not significant.
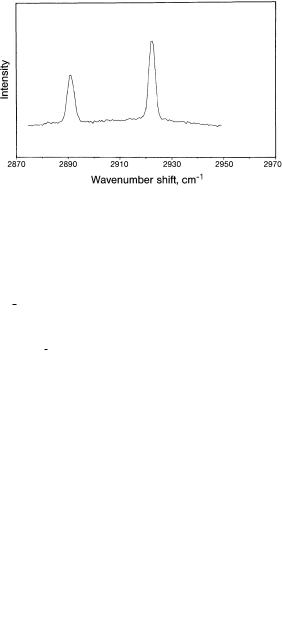
The first indication of the inadequacy of transferability appeared during a study of the correlation between bond length and CH stretch frequency for a series of perdeuterated alkanes [16]. For cyclohexane-d11, the normal mode for the CH stretch is essentially the isolated stretch of the lone CH bond. If transferability were correct, the intensity ratio of the bands from the axial (CHax) and equatorial (CHeq) stretch vibrations would be 1, given that in the gas phase the molecule would exist as a 50:50 mixture of the two possible CH orientations. In fact, it is 0.7 (Fig. 4.1) [16].
Since that paper appeared, the absolute Raman trace scattering intensities have been reported for ethane [8], propane [9], n-butane [10], cyclohexane [11], ethene [12], ethyne [12], and, most recently, bicyclo-[1.1.1]-pentane [13]. For the purposes of the investigation, we restricted our attention to the trace scattering ðqa=qqÞ, that is, the change in the mean molecular polarizability that arises from the totally symmetric vibrations, where:
qa |
|
¼ |
1 |
qaxx |
þ |
qayy |
þ |
qazz |
ð3Þ |
|
|
|
|
|
|
|
|
||||
3 |
||||||||||
Experimental error is reduced, because these modes produce a strong, narrow Q branch, due to more restrictive rotational selection rules. In addition, the trace
Fig. 4.1 Isolated CH stretching bands in the Raman spectrum of gaseous cyclohexane. Randomly protonated C6HD11, showing the hydrogen impurity in the perdeuterated sample. Reproduced, with permission, from J. Chem. Phys. 1984, 81, 5352–5361, American Institute of Physics.
4.2 Background to the Problem 99
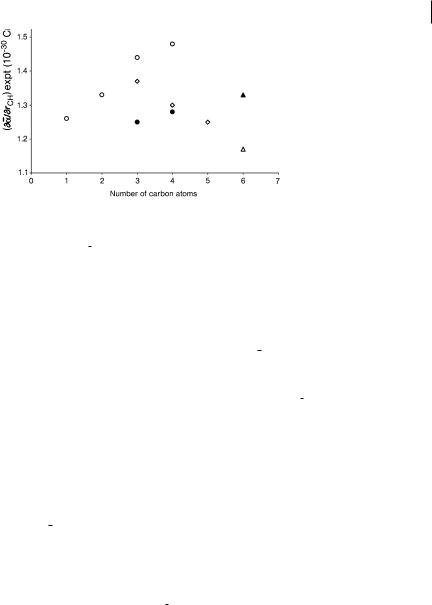
Fig. 4.2 Values of qa/qrCH from experimental Raman trace scattering intensities for methane, ethane, propane, trans-n-butane, bicyclo-[1.1.1]- pentane, and cyclohexane. Hip ðcÞ, Hop ðgÞ, Hm ðzÞ, Hbh ðkÞ, Hax ðuÞ, Heq ðEÞ. Data from Refs. [6, 8–10, 24].
scattering is nearly invariant to isotopic substitution, enabling us to use the absolute intensity data for several isotopomers. Through force-field analysis, the derivatives are converted to internal coordinates ðqa=qrÞ, where r identifies some unique CH or CC bond. These data properly report the change in the molecular polarizability associated with the displacement of an individual bond. Numerous experimental results demonstrate conclusively that ðqa=qrÞ for CH and CC stretches are strongly dependent on location and orientation, on molecular size, and on any strain or steric hindrance (Fig. 4.2).
4.2.1.2 Theoretical Modeling of Raman Scattering Intensities: What We Did and Why
The intriguing patterns discovered from experiment and supported by ab initio modeling [17–24] raised several new questions, most importantly, whether variation in qa=qrCH might increase with molecular size and complexity. We devised a survey set of thirty-five hydrocarbons comprising the all-trans conformers of n-alkanes up to C15, iso-butane, six cycloalkanes and methylcycloalkanes, eight bicycloalkanes, four propellanes, and a tetracyclane [20]. These molecules represent several homologous series and also explore the full range of bonding in saturated hydrocarbons. The values of qa=qrCH for each symmetrically unique CH bond were obtained at the Hartree–Fock (HF) level of theory with the D95(d,p) basis set. Our combined experimental/theoretical approach may be summarized as:
Use ab initio calculations to model known experimental data.
Use QTAIM to analyze the wavefunctions, and to interpret and understand experiments.
Perform new ab initio calculations to probe for and to predict patterns for untested molecules for which interesting behavior is expected.
1004 QTAIM Analysis of Raman Scattering Intensities
Use QTAIM to test our classifications, and to help us identify and understand what is transferable (guiding principles based on structure and composition) and what is not ðqa=qrÞ.
The highly strained bicyclo-[1.1.1]-pentane emerged as a likely example of a simple, highly symmetric molecule that would have dramatically di erent qa=qrCH for the CH bonds, with an absolute qa=qrCH for the bridgehead CH near the extreme of the values we have surveyed. That the experimental results perfectly matched the theoretically predicted values has been a very satisfying endorsement of our approach [24], enabling classification of the variations in qa=qrCH according to a few geometrical and chemical factors outlined in this chapter. We then completed extensive ab initio studies on other molecules to gain a larger perspective on the problem and to create a set of guidelines to describe what may be expected in other, untested situations, including some additional saturated hydrocarbons and some alkenes and silanes, for which we calculate the derivatives for CaH, SiaH, CaC, and SiaSi bonds.
It is, of course, of limited use for a theory to merely reproduce experiment if it does not o er reason or insight or predictive power in addition to replication. QTAIM analysis of the molecular wavefunction o ers us the desired level of information from which insight may be gleaned, and from which new physical intuition may be derived. The complex multidimensional wavefunction yields to the familiar real-space world of the electron density. The simple representation of bonding by single, double and triple lines is replaced by the richness of a complete cataloguing of the electron distribution throughout a molecule.
The fundamental reasons for departure of a given property from an expected trend can often be di cult to identify. For molecules, we wish to scrutinize the various competing and complementary contributions to molecular properties. One of the triumphs of QTAIM has been to faithfully recover the functional groups of observational chemistry. Functional group transferability, however, is an outcome of QTAIM analysis for those instances when the functional group has experimentally-observed nominal transferability. Molecular structure consists of many elements, all of which are captured in the topology of the electronic charge distribution. We have many descriptors for these elements, for example strain and steric hindrance, the e ects of which are local in nature yet a ect the properties of the whole molecule. QTAIM tells us exactly how this occurs.
4.3 Methodology
Our purpose in Sections 4.1 and 4.2 was to make very clear that experiment has shown there are significantly di erent Raman scattering intensities from even such a seemingly robust/stolid/nondescript functional group as CH. We use QTAIM, which provides a real-space atomic-level description of the fundamental

4.3 Methodology 101
molecular properties, to ascertain how the interconnectedness of the atoms and their relative structural arrangements lead to these dramatic changes in intensity from molecule to molecule. The main steps are summarized here; details, examples, advice and cautionary tales follow.
Step 1: Calculate a at the optimized geometry of the molecule in question. Check: compare acalc with aexpt where possible
Step 2: Calculate a again for geometries in which the atoms have been displaced along a symmetric stretch coordinate,
e.g.: CH4, let all rCH ¼ r (optimized) G0.01 A˚
Step 3: Calculate Da for this symmetry coordinate by finite di erence and convert to Da=DrCH. Check: compare
ðDa=DrCHÞcalc with ðDa=DrCHÞexpt where possible Step 4: Perform QTAIM analysis on the wavefunctions
obtained in Steps 1 and 2
Step 5: Recover aQTAIM and ðDa=DrCHÞQTAIM from atomic charges and atomic moments. Check: compare aQTAIM
and ðDa=DrCHÞQTAIM with acalc and ðDa=DrCHÞcalc
Step 6: Examine the QTAIM atomic properties to gain insight into the patterns that emerge
4.3.1
Modeling a and qa/qr
We have relied most heavily on the Gaussian [25] software but this is not a requirement if the wavefunction is accessible to the QTAIM software, typically AIM2000 [26]. Criteria for setting up a successful calculation and options for pushing for the highest accuracy with respect to experiment were recently reviewed [23]; the main points are presented here.
The basis set must be large and include di use and polarization functions to reproduce experimentally observed behavioral trends. In our earliest calculations we employed the D95(d,p) basis set because it met this criterion while still being small enough to enable calculations on molecules such as cyclohexane [18]. In the Gaussian implementation, a is calculated by use of the analytical coupled– perturbed Hartree–Fock (CPHF) method. More recently, we explored much larger basis sets using a coupled cluster method (CCSD(T)) and applied time-dependent density-functional theory to B3LYP hybrid density functionals [23, 24]. We obtained benchmark level calculations that accurately reproduce the Raman intensities for bicyclo-[1.1.1]-pentane to within experimental error.
The first criterion to be met is that the a determined computationally should be in good agreement with that found experimentally. To obtain calculated values that are within experimental error, we have found it adequate to use B3LYP with the aug-cc-pVTZ basis set. It is not necessary to demand such high absolute accu-