

vk.com/id446425943
Anglo American – HOLD
Renaissance Capital
6 February 2019
Metals & Mining
Figure 79: Anglo American, $mn (unless otherwise noted) |
|
|
|
|
|
|
|
|
|
|
|
|||
Anglo American |
|
AGLJ.J |
|
|
|
|
|
Target price, ZAR: |
|
|
340 |
|||
Market capitalisation, $mn: |
|
36,489 |
|
|
|
|
|
|
Share price, ZAR: |
|
|
345 |
||
Enterprise value, $mn: |
|
51,574 |
|
|
|
|
|
|
Potential 12-month return: |
|
4.5% |
|||
|
|
|
|
|
|
|
|
|
|
|
|
|
|
|
Dec-YE |
2016 |
2017 |
|
2018E |
2019E |
2020E |
Dec-YE |
2016 |
2017 |
|
2018E |
2019E |
2020E |
|
Income statement |
|
|
|
|
|
|
|
Balance sheet |
|
|
|
|
|
|
Revenue |
23,142 |
28,650 |
|
29,833 |
28,499 |
28,130 |
|
Net operating assets |
32,315 |
33,172 |
|
32,171 |
31,897 |
32,800 |
Underlying EBITDA |
6,104 |
8,823 |
|
9,593 |
9,916 |
8,645 |
|
Financial instruments |
497 |
211 |
|
172 |
199 |
208 |
Underlying EBIT |
3,822 |
6,247 |
|
6,818 |
7,017 |
5,696 |
|
Equity |
19,016 |
22,972 |
|
23,517 |
25,343 |
25,973 |
Net interest |
-567 |
-635 |
|
-473 |
-313 |
-245 |
|
Minority interest |
5,309 |
5,910 |
|
5,736 |
6,020 |
6,256 |
Taxation |
-821 |
-1,770 |
|
-2,136 |
-2,125 |
-1,728 |
|
Net debt |
8,487 |
4,501 |
|
3,090 |
732 |
779 |
Minority interest in profit |
-329 |
-891 |
|
-969 |
-1,138 |
-944 |
|
|
|
|
|
|
|
|
Net profit for the year |
1,594 |
3,166 |
|
3,044 |
3,441 |
2,779 |
|
Balance sheet ratios |
|
|
|
|
|
|
Underlying earnings |
2,210 |
3,272 |
|
3,319 |
3,441 |
2,779 |
|
Gearing* |
30.9% |
16.4% |
|
11.6% |
2.8% |
2.9% |
Underlying EPS, USc |
172 |
257 |
|
261 |
271 |
219 |
|
Net debt to EBITDA |
1.4x |
0.5x |
|
0.3x |
0.1x |
0.1x |
|
|
RoCE |
10.8% |
17.8% |
|
19.8% |
20.7% |
16.3% |
||||||
Thomson Reuters consensus EPS, USc |
|
|
|
240 |
258 |
230 |
|
RoIC (after tax) |
6.0% |
15.1% |
|
10.9% |
15.8% |
11.0% |
DPS declared, USc |
0 |
102 |
|
104 |
135 |
207 |
|
RoE |
12.4% |
15.6% |
|
14.3% |
14.1% |
10.8% |
Underlying EBIT |
|
|
|
|
|
|
|
Cash flow statement |
|
|
|
|
|
|
Platinum |
185 |
512 |
|
791 |
1,089 |
1,289 |
|
Operating cash flow |
4,573 |
8,101 |
|
6,210 |
8,916 |
6,748 |
EBIT margin |
4% |
10% |
|
14% |
22% |
26% |
|
Capex (net of disposals) |
-2,388 |
-2,150 |
|
-2,268 |
-3,950 |
-3,867 |
Diamonds |
1,019 |
873 |
|
738 |
775 |
789 |
|
Other cash flows |
2,045 |
-688 |
|
-182 |
0 |
0 |
EBIT margin |
17% |
15% |
|
12% |
13% |
13% |
|
FCF |
4,230 |
5,263 |
|
3,760 |
4,966 |
2,881 |
Copper |
261 |
923 |
|
1,228 |
1,074 |
1,004 |
|
Equity shareholders' cash |
4,423 |
4,607 |
|
2,722 |
3,973 |
2,102 |
EBIT margin |
9% |
22% |
|
25% |
25% |
23% |
|
Dividends and share buy-backs |
0 |
-621 |
|
-1,311 |
-1,615 |
-2,149 |
Nickel |
-15 |
0 |
|
94 |
37 |
113 |
|
Surplus (deficit) cash |
4,423 |
3,986 |
|
1,411 |
2,358 |
-48 |
EBIT margin |
-4% |
0% |
|
17% |
7% |
18% |
|
Cash flow ratios |
|
|
|
|
|
|
Iron ore and manganese |
1,275 |
1,978 |
|
1,391 |
2,331 |
1,666 |
|
|
|
|
|
|
|
|
EBIT margin |
46% |
57% |
|
40% |
63% |
51% |
|
Working capital days |
52 |
33 |
|
33 |
20 |
22 |
Coal |
1,112 |
2,274 |
|
2,866 |
2,025 |
1,145 |
|
Capex/EBITDA |
43.4% |
28.0% |
|
27.7% |
45.7% |
51.0% |
EBIT margin |
21% |
32% |
|
36% |
30% |
19% |
|
FCF yield |
15.9% |
16.9% |
|
10.0% |
12.5% |
7.2% |
Other |
-15 |
-313 |
|
-289 |
-314 |
-311 |
|
Equity shareholders' yield |
34.7% |
22.1% |
|
9.5% |
12.1% |
6.4% |
Underlying EBIT |
3,822 |
6,247 |
|
6,818 |
7,017 |
5,696 |
|
Cash conversion |
2.0x |
1.4x |
|
0.8x |
1.2x |
0.8x |
Income statement ratios |
|
|
|
|
|
|
|
Valuation |
|
|
|
|
$mn |
|
EBITDA margin |
26% |
31% |
|
32% |
35% |
31% |
|
SoTP DCF fair value and calculation of target price |
|
|
|
ZAR/sh |
||
EBIT margin |
17% |
22% |
|
23% |
25% |
20% |
|
Platinum |
|
|
|
|
8,224 |
91.3 |
EPS Growth |
169% |
49% |
|
2% |
4% |
-19% |
|
Diamonds |
|
|
|
|
7,262 |
80.6 |
Dividend payout ratio |
0% |
40% |
|
40% |
50% |
95% |
|
Coal |
|
|
|
|
6,535 |
72.5 |
Input assumptions |
|
|
|
|
|
|
|
Copper |
|
|
|
|
5,891 |
65.4 |
|
|
|
|
|
|
|
Nickel |
|
|
|
|
980 |
10.9 |
|
ZAR/$ |
14.70 |
13.31 |
|
13.24 |
14.31 |
14.14 |
|
Kumba Iron Ore |
|
|
|
|
4,197 |
46.6 |
Platinum, $/oz |
988 |
950 |
|
880 |
870 |
1,070 |
|
Samancor manganese |
|
|
|
|
3,560 |
39.5 |
Diamond realisations, $/ct |
188 |
162 |
|
171 |
171 |
181 |
|
Anglo Ferrous Brazil |
|
|
|
|
2,014 |
22.3 |
Copper, USc/lb |
221 |
280 |
|
296 |
272 |
289 |
|
Corporate & other |
|
|
|
|
-3,999 |
-44.4 |
Hard coking coal, $/t |
144 |
188 |
|
206 |
178 |
161 |
|
Total enterprise value excluding minority interests |
|
|
|
34,664 |
384.7 |
|
Iron ore fines (62%Fe, CIF China), $/t |
58 |
71 |
|
66 |
75 |
67 |
|
Attributable net debt as at 31 December 2017 |
|
|
|
-4,489 |
-49.8 |
|
|
|
|
|
|
|
|
|
Investments as at 31 December 2017 |
|
|
|
|
211 |
2.3 |
Required breakeven price |
|
|
|
|
|
|
|
Equity value as at 4/2/2019 |
|
|
|
|
30,386 |
337.2 |
Breakeven price - 3PGM, $/oz |
754 |
774 |
|
815 |
752 |
701 |
|
|
|
|
|
|
|
|
Rounded to |
|
|
|
|
|
340.0 |
||||||||
Breakeven price - copper, USc/lb |
198 |
216 |
|
203 |
208 |
228 |
|
Share price on 1/2/2019 |
|
|
|
|
|
345.2 |
Breakeven price - coking coal, $/t |
115 |
107 |
|
118 |
118 |
121 |
|
Expected share price return |
|
|
|
|
|
-1.5% |
Breakeven price - Export thermal coal, $/t |
46 |
59 |
|
61 |
64 |
74 |
|
Plus: expected dividend yield |
|
|
|
|
|
6.0% |
Sales volumes |
|
|
|
|
|
|
|
Total implied one-year return |
|
|
|
|
|
4.5% |
|
|
|
|
|
|
|
|
|
|
|
|
|
|
|
Platinum, koz |
2,416 |
2,505 |
|
2,424 |
2,050 |
2,000 |
|
Share price range, ZAR: |
|
|
|
|
|
|
Diamonds (consolidated sales), mn ct |
30.0 |
33.1 |
|
31.7 |
30.3 |
30.3 |
|
12-month high on 1/2/2019 |
347 |
12-month low on 4/4/2018 |
262 |
|||
Total iron ore, mnt |
59 |
61 |
|
46 |
62 |
65 |
|
Price move since high |
-0.5% |
Price move since low |
|
32.0% |
||
Total copper segment, kt |
577 |
579 |
|
668 |
663 |
653 |
|
|
|
|
|
|
|
|
Metallurgical coal, mnt |
20.7 |
19.8 |
|
22.0 |
22.0 |
22.0 |
|
Calculation of discount rate |
|
|
|
|
|
|
Export thermal coal, mnt |
34.1 |
31.0 |
|
30.0 |
28.3 |
30.1 |
|
|
|
|
|
|
|
|
Attributable Cu eq volumes, kt |
2,974 |
2,923 |
|
2,749 |
2,812 |
2,841 |
|
WACC |
9.5% |
Cost of debt |
|
|
5.0% |
|
Volume growth |
0.1% |
-1.7% |
|
-5.9% |
2.3% |
1.0% |
|
Risk-free rate |
4.0% |
Tax rate |
|
|
30% |
|
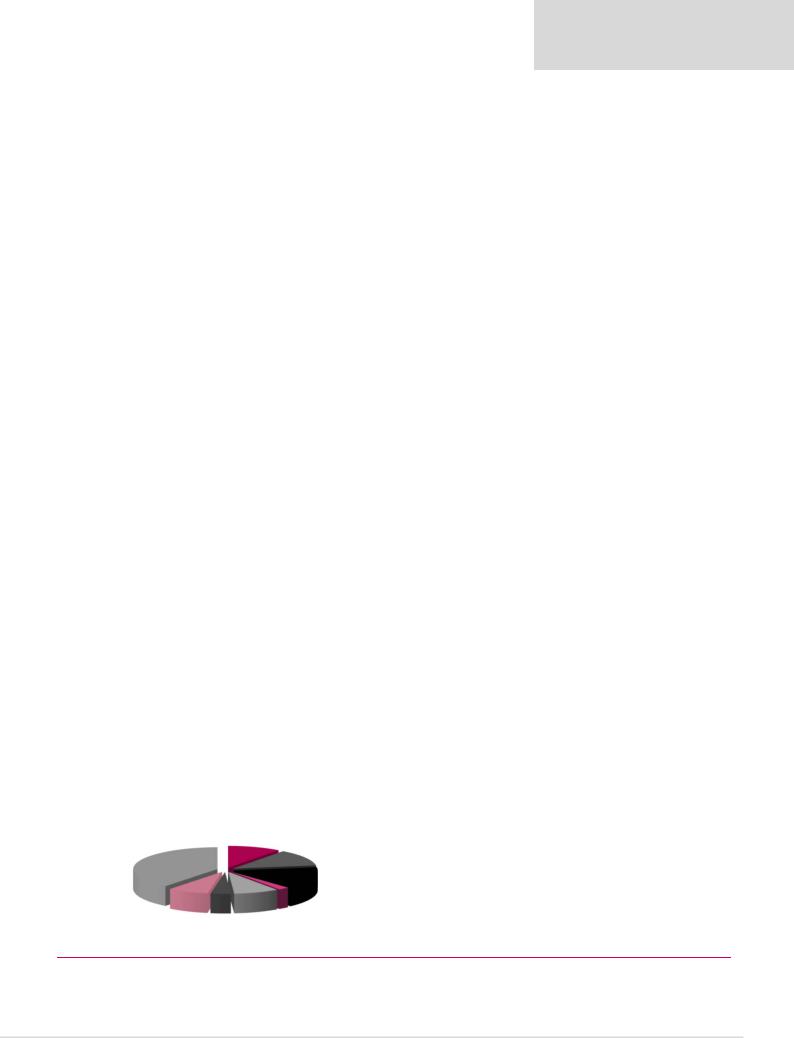
Contribution to FY18E attributable underlying EBITDA |
|
|
|
|
Equity risk premium |
5.0% |
After-tax cost of debt |
|
3.5% |
|||||
|
|
|
|
Beta |
1.30 |
Debt weighting |
|
15% |
||||||
|
|
Platinum (80% of |
|
|
|
|
Cost of equity |
10.5% |
Terminal growth rate |
|
3.0% |
|||
|
|
|
|
|
|
|
|
|
|
|
|
|
||
|
|
AMS) |
|
|
|
|
|
|
|
|
|
|
|
|
|
|
10% |
|
|
Diamonds (85% of |
|
|
|
|
|
|
|
||
Coal |
|
|
|
|
De Beers) |
|
|
Valuation ratios |
|
|
|
|
|
|
39% |
|
|
|
|
12% |
|
|
|
|
|
|
|
|
|
|
|
|
|
|
|
Dec-YE |
2016 |
2017 |
|
2018E |
2019E |
2020E |
||
|
|
|
|
|
|
|
|
|||||||
|
|
|
|
|
|
|
|
P/E multiple |
5.8x |
6.4x |
|
8.7x |
9.6x |
11.9x |
|
|
|
|
|
|
|
|
Dividend yield |
0.0% |
6.2% |
|
4.6% |
5.2% |
8.0% |
|
|
|
|
|
Copper |
|
|
EV/EBITDA |
4.8x |
4.1x |
|
4.6x |
4.6x |
5.3x |
|
|
|
|
Nickel |
16% |
|
|
P/B |
0.7x |
0.9x |
|
1.2x |
1.3x |
1.3x |
Samancor |
Minas Rio Kumba Iron Ore |
|
|
|
NAV per share, $ |
14.8 |
18.0 |
|
18.5 |
20.0 |
20.5 |
|||
Manganese |
2% |
|
|
|
NAV per share, ZAR |
217 |
240 |
|
245 |
285 |
289 |
|||
8% |
-4% |
(51%) |
|
|
|
|
|
|
|
|
|
|
|
|
|
|
9% |
|
|
|
|
|
|
|
|
|
|
|
|
* Gearing defined as net debt/(net debt +equity)
Source: Bloomberg, Thomson Reuters, Company data, Renaissance Capital estimates
46