

vk.com/id446425943
Vale – HOLD
Renaissance Capital
6 February 2019
Metals & Mining
Figure 90: Vale, $mn (unless otherwise noted)
|
|
|
|
|
|
|
|
|
|
|
|
|
|
|
|
|
Vale |
|
|
|
|
VALE.N |
|
|
|
|
|
Target price, $: |
|
|
13.6 |
||
Market capitalisation, $mn: |
|
|
|
|
64,869 |
|
|
|
|
|
Last price, $: |
|
|
12.6 |
||
Enterprise value, $mn: |
|
|
|
|
85,158 |
|
|
|
|
|
Potential 12-month return: |
|
8.2% |
|||
|
|
|
|
|
|
|
|
|
|
|
|
|
|
|
|
|
Dec-YE |
|
|
|
2016 |
2017 |
2018E |
2019E |
2020E |
Dec-YE |
2016 |
2017 |
|
2018E |
2019E |
2020E |
|
Income statement |
|
|
|
|
|
|
|
|
|
Balance sheet |
|
|
|
|
|
|
Revenue |
|
|
|
29,334 |
35,713 |
37,397 |
39,332 |
37,786 |
|
Net operating assets |
66,066 |
62,915 |
|
53,125 |
55,785 |
57,592 |
Adjusted EBITDA |
|
|
|
12,181 |
15,337 |
17,312 |
18,515 |
15,841 |
|
Investments |
18 |
18 |
|
6 |
6 |
7 |
Adjusted EBIT |
|
|
|
8,267 |
10,873 |
13,750 |
14,857 |
12,055 |
|
Equity |
39,042 |
43,458 |
|
43,493 |
50,453 |
55,447 |
Net interest |
|
|
|
1,966 |
-3,019 |
-6,069 |
-2,066 |
-1,900 |
|
Minority interest |
1,982 |
1,314 |
|
860 |
868 |
876 |
Taxation |
|
|
|
-2,781 |
-830 |
-1,525 |
-2,589 |
-1,862 |
|
Net debt (target: $10bn) |
25,060 |
18,161 |
|
8,778 |
4,470 |
1,276 |
Minority interest in profit |
|
|
|
6 |
-14 |
-1 |
-40 |
-40 |
|
|
|
|
|
|
|
|
Net profit for the year |
|
|
|
5,277 |
6,935 |
5,821 |
6,960 |
4,994 |
|
Balance sheet ratios |
|
|
|
|
|
|
Underlying earnings |
|
|
|
4,968 |
7,188 |
8,145 |
9,515 |
7,549 |
|
Gearing * |
30.8% |
22.0% |
|
10.7% |
5.4% |
1.5% |
Underlying EPS, $ |
|
|
|
0.96 |
1.39 |
1.57 |
1.84 |
1.46 |
|
Net debt to EBITDA |
2.1x |
1.2x |
|
0.5x |
0.2x |
0.1x |
|
|
|
|
RoCE |
13.1% |
16.4% |
|
22.4% |
25.7% |
20.1% |
||||||
Thomson Reuters consensus EPS, $ |
|
|
|
|
1.32 |
1.81 |
1.58 |
|
RoIC (after tax) |
12.6% |
19.8% |
|
15.7% |
17.4% |
13.7% |
|
DPS declared, $ |
|
|
|
0.27 |
0.28 |
0.40 |
0.00 |
0.00 |
|
RoE |
13.7% |
17.4% |
|
18.7% |
20.3% |
14.3% |
Adjusted EBIT |
|
|
|
|
|
|
|
|
|
Cash flow statement |
|
|
|
|
|
|
Ferrous Minerals |
|
|
|
8,747 |
11,497 |
13,385 |
14,724 |
10,924 |
|
Operating cash flow |
10,030 |
16,819 |
|
12,946 |
14,237 |
12,447 |
EBIT margin |
|
|
|
43% |
46% |
47% |
48% |
40% |
|
Capex less disposals |
-5,480 |
-4,154 |
|
-2,385 |
-5,792 |
-5,241 |
Coal |
|
|
|
-244 |
-25 |
21 |
59 |
80 |
|
Other cash flows |
-987 |
-1,825 |
|
3,001 |
-2,555 |
-2,555 |
EBIT margin |
|
|
|
-29% |
-2% |
1% |
3% |
4% |
|
FCF |
3,563 |
10,840 |
|
13,562 |
5,890 |
4,652 |
Base metals |
|
|
|
36 |
501 |
991 |
535 |
1,495 |
|
Equity shareholders' cash |
702 |
8,574 |
|
12,538 |
4,308 |
3,194 |
EBIT margin |
|
|
|
1% |
7% |
15% |
8% |
19% |
|
Dividends and share buy-backs |
-500 |
-1,675 |
|
-3,155 |
0 |
0 |
Fertiliser nutrients |
|
|
|
-138 |
-885 |
-109 |
0 |
0 |
|
Excess cash |
202 |
6,899 |
|
9,383 |
4,308 |
3,194 |
EBIT margin |
|
|
|
-7% |
-51% |
-122% |
n/a |
n/a |
Cash flow ratios |
|
|
|
|
|
|
|
Others and logistics |
|
|
|
-134 |
-215 |
-538 |
-461 |
-444 |
|
|
|
|
|
|
|
|
EBIT margin |
|
|
|
-84% |
-54% |
-169% |
-120% |
-111% |
|
Working capital days |
0 |
7 |
|
11 |
8 |
7 |
Adjusted EBIT - Group production |
|
|
8,267 |
10,873 |
13,750 |
14,857 |
12,055 |
|
Capex/EBITDA |
45.0% |
27.1% |
|
13.8% |
31.3% |
33.1% |
|
Income statement ratios |
|
|
|
|
|
|
|
|
|
FCF yield |
6.6% |
15.4% |
|
16.9% |
8.4% |
6.9% |
|
|
|
|
|
|
|
|
|
Equity shareholders' yield |
2.6% |
16.9% |
|
17.8% |
6.6% |
4.9% |
|
EBITDA margin |
|
|
|
41.5% |
42.9% |
46.3% |
47.1% |
41.9% |
|
Cash conversion |
0.1x |
1.2x |
|
1.5x |
0.5x |
0.4x |
EBIT margin |
|
|
|
28.2% |
30.4% |
36.8% |
37.8% |
31.9% |
|
Valuation |
|
|
|
|
|
|
EPS growth |
|
|
|
393% |
44% |
13% |
17% |
-21% |
|
|
|
|
|
$mn |
$ |
|
Dividend payout ratio |
|
|
|
29% |
20% |
25% |
0% |
0% |
|
SoTP valuation and calculation of target price |
|
|
|
|||
Input assumptions |
|
|
|
|
|
|
|
|
|
Ferrous minerals |
|
|
|
|
86,145 |
16.7 |
|
|
|
|
|
|
|
|
|
Coal |
|
|
|
|
1,051 |
0.2 |
|
Iron ore fines (62%Fe,CIF China), $/t |
|
|
58 |
71 |
66 |
75 |
67 |
|
Base metals |
|
|
|
|
7,729 |
1.5 |
|
Brazil to China freight charge, $/t |
|
|
|
9 |
15 |
18 |
19 |
18 |
|
Fertiliser nutrients |
|
|
|
|
1,540 |
0.3 |
Nickel, $/t |
|
|
|
9,599 |
10,404 |
13,130 |
11,530 |
14,285 |
|
Others and logistics |
|
|
|
|
-5,674 |
-1.1 |
Copper, $/t |
|
|
|
4,867 |
6,170 |
6,532 |
6,000 |
6,367 |
|
Total enterprise value |
|
|
|
|
90,791 |
17.6 |
Thermal coal, $/t |
|
|
|
64 |
85 |
98 |
93 |
86 |
|
Net debt as at latest year end |
|
|
|
|
-18,161 |
-3.5 |
Hard coking coal, $/t |
|
|
|
144 |
188 |
206 |
178 |
161 |
|
Cash used in share buy-backs |
|
|
|
|
-497 |
-0.1 |
$/BRL |
|
|
|
3.49 |
3.19 |
3.65 |
3.78 |
3.50 |
|
Other investments |
|
|
|
|
18 |
0.0 |
|
|
|
|
|
|
|
|
|
|
Minority interest (DCF value) |
|
|
|
|
-2,128 |
-0.4 |
Required breakeven price |
|
|
|
|
|
|
|
|
|
Equity value as at 4/2/2019 |
|
|
|
|
70,022 |
13.6 |
Iron ore, $/t |
|
|
|
27 |
32 |
25 |
28 |
33 |
|
Rounded to |
|
|
|
|
|
13.6 |
Metallurgical coal, $/t |
|
|
|
192 |
152 |
|
|
|
|
|
|
|
|
|
|
|
|
|
|
183 |
167 |
149 |
|
Share price on 1/2/2019 |
|
|
|
|
|
12.6 |
|||
Nickel, $/t |
|
|
|
8,160 |
9,137 |
8,998 |
9,214 |
9,216 |
|
Expected share price return |
|
|
|
|
|
8.2% |
Copper, $/t |
|
|
|
2,893 |
2,341 |
3,379 |
3,373 |
3,012 |
|
Plus: expected dividend yield |
|
|
|
|
|
0.0% |
Sales volumes |
|
|
|
|
|
|
|
|
|
Total implied one-year return |
|
|
|
|
|
8.2% |
|
|
|
|
|
|
|
|
|
|
|
|
|
|
|
|
|
Iron ore, mnt |
|
|
|
293 |
289 |
317 |
311 |
305 |
|
Share price range, $: |
|
|
|
|
|
|
Iron pellets, mnt |
|
|
|
48 |
52 |
55 |
49 |
55 |
|
12-month high on 3/10/2018 |
16.13 |
12-month low on 28/1/2019 |
11.08 |
|||
Nickel, kt |
|
|
|
311 |
294 |
236 |
248 |
264 |
|
Price move since high |
-22.1% |
Price move since low |
|
13.4% |
||
Copper, kt |
|
|
|
430 |
424 |
378 |
417 |
427 |
|
|
|
|
|
|
|
|
Attributable Cu eq volumes, kt |
|
|
|
5,510 |
5,489 |
5,296 |
5,290 |
5,457 |
|
Calculation of WACC |
|
|
|
|
|
|
Volume growth |
|
|
|
3.1% |
-0.4% |
-3.5% |
-0.1% |
3.2% |
|
WACC |
12.5% |
Cost of debt |
|
|
7.0% |
|
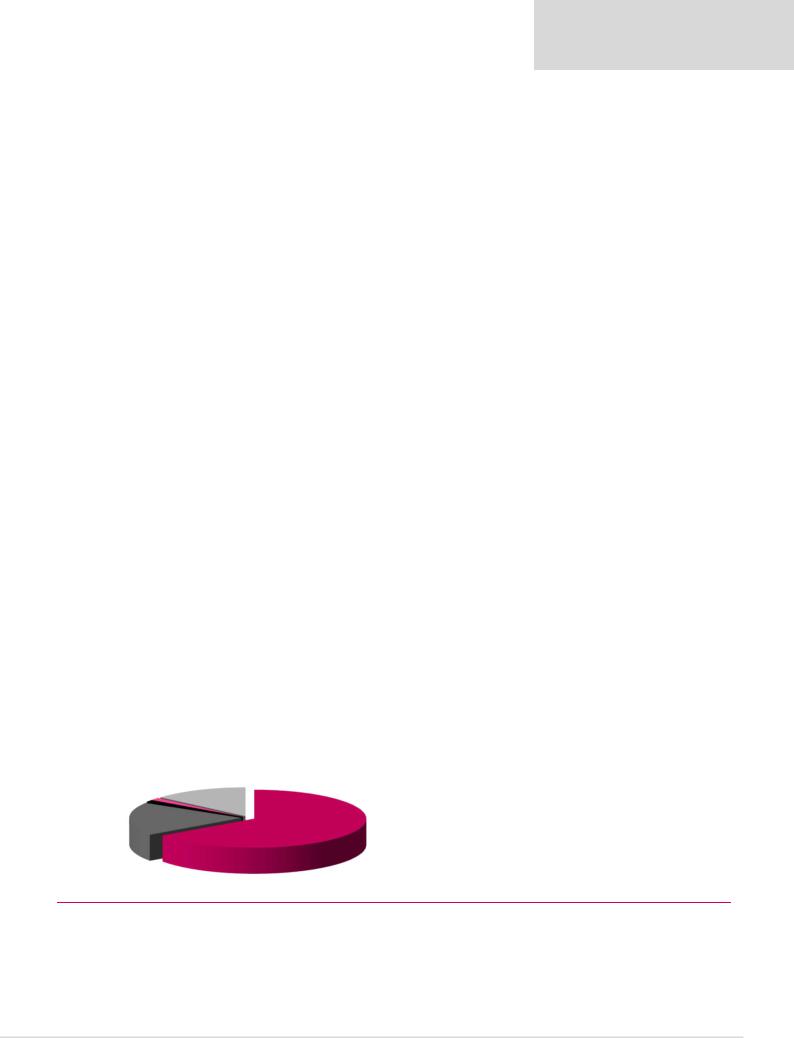
Contribution to FY18E Adjusted EBITDA |
|
|
|
|
|
|
Risk-free rate |
4.0% |
Tax rate |
|
|
30% |
||||
|
|
|
|
|
|
Equity risk premium |
7.2% |
After-tax cost of debt |
|
4.9% |
||||||
Coal |
Base metals |
|
|
|
|
|
|
Beta |
1.30 |
Debt weighting |
|
10% |
||||
|
14% |
|
|
|
|
|
|
|
Cost of equity |
13.4% |
Terminal growth rate |
|
2.0% |
|||
1% |
|
|
|
|
|
|
|
|
|
|
|
|
|
|
|
|
Manganese
1%
Pellets
19%
|
Valuation ratios |
|
|
|
|
|
|
|
Dec-YE |
2016 |
2017 |
|
2018E |
2019E |
2020E |
|
P/E multiple |
5.3x |
7.1x |
|
8.7x |
6.8x |
8.6x |
|
Dividend yield |
5.3% |
2.9% |
|
2.9% |
0.0% |
0.0% |
|
EV/EBITDA |
4.4x |
4.6x |
|
4.6x |
3.8x |
4.2x |
|
P/B |
0.7x |
1.2x |
|
1.6x |
1.3x |
1.2x |
|
NAV per share, $ |
7.6 |
8.4 |
|
8.4 |
9.8 |
10.7 |
Iron ore |
Dividend policy: Minimum payment of 30% of EBITDA less sustaining capex. |
|
|
|
|||
65% |
|
|
|
||||
* Gearing defined as net debt/(net debt +equity)
Source: Bloomberg, Thomson Reuters, Company data, Renaissance Capital estimates
57

vk.com/id446425943
AngloGold Ashanti – SELL
Renaissance Capital
6 February 2019
Metals & Mining
Figure 91: AngloGold Ashanti, $mn (unless otherwise noted) |
|
|
|
|
|
|
|
|
|
|
|
||||
AngloGold Ashanti |
|
ANGJ.J |
|
|
|
|
|
Target price, ZAR: |
|
|
110 |
||||
Market capitalisation, $mn: |
|
5,920 |
|
|
|
|
|
Share price, ZAR: |
|
|
190 |
||||
Enterprise value, $mn: |
|
8,023 |
|
|
|
|
|
Potential 12-month return: |
|
-41.0% |
|||||
|
|
|
|
|
|
|
|
|
|
|
|
|
|
|
|
Dec-YE |
|
|
2016 |
2017 |
2018E |
2019E |
2020E |
Dec-YE |
2016 |
2017 |
|
2018E |
2019E |
2020E |
|
Income statement |
|
|
|
|
|
|
|
Balance sheet |
|
|
|
|
|
|
|
Revenue |
|
|
4,519 |
4,809 |
4,542 |
5,209 |
5,380 |
|
Net operating assets |
5,409 |
5,506 |
|
5,253 |
5,075 |
4,961 |
Adjusted EBITDA |
|
1,770 |
1,750 |
1,731 |
2,346 |
2,230 |
|
Investments, net of rehab provision |
-739 |
-801 |
|
-712 |
-712 |
-712 |
|
Adjusted EBIT |
|
849 |
790 |
864 |
1,328 |
1,165 |
|
Equity |
2,715 |
2,663 |
|
2,745 |
3,372 |
3,873 |
|
Other items |
|
|
-343 |
-706 |
-422 |
-260 |
-274 |
|
Minority interest |
39 |
41 |
|
36 |
36 |
36 |
Net interest |
|
|
-234 |
-150 |
-142 |
-87 |
-44 |
|
Net debt |
1,916 |
2,001 |
|
1,759 |
955 |
340 |
Taxation |
|
|
-182 |
-84 |
-108 |
-294 |
-254 |
|
Balance sheet ratios |
|
|
|
|
|
|
Minority interest in profit |
|
-17 |
-20 |
-20 |
-29 |
-27 |
|
|
|
|
|
|
|
||
Net profit for the year |
|
80 |
-168 |
172 |
658 |
566 |
|
Gearing (net debt/(net debt+equity)) |
41.4% |
42.9% |
|
39.1% |
22.1% |
8.1% |
|
Headline earnings |
|
111 |
27 |
239 |
658 |
566 |
|
Net debt to EBITDA |
1.1x |
1.1x |
|
1.0x |
0.4x |
0.2x |
|
Headline EPS, USc |
|
27 |
6 |
58 |
158 |
136 |
|
RoCE |
14.1% |
13.2% |
|
14.8% |
23.6% |
21.3% |
|
|
|
RoIC (after tax) |
4.4% |
-3.9% |
|
4.3% |
13.3% |
11.2% |
|||||||
Thomson Reuters consensus HEPS, USc |
|
|
|
62 |
96 |
112 |
|
RoE |
4.3% |
1.0% |
|
8.8% |
21.5% |
15.6% |
|
DPS declared, USc |
|
10 |
5 |
8 |
16 |
12 |
|
Cash flow statement |
|
|
|
|
|
|
|
|
|
|
|
|
|
|
|
|
|
|
|
|
|
|
|
Adjusted EBIT |
|
|
|
|
|
|
|
Operating cash flow |
1,526 |
1,429 |
|
1,286 |
2,190 |
1,943 |
|
South Africa |
|
|
132 |
-12 |
6 |
88 |
58 |
|
Capex (net of disposals) |
-811 |
-964 |
|
-771 |
-1,005 |
-932 |
EBIT margin |
|
11% |
-1% |
1% |
14% |
10% |
|
Other cash flows |
-258 |
-466 |
|
-54 |
-260 |
-274 |
|
Continental Africa |
|
333 |
385 |
346 |
551 |
539 |
|
Free cash flow |
457 |
-1 |
|
461 |
925 |
737 |
|
EBIT margin |
|
20% |
20% |
17% |
23% |
21% |
|
Equity shareholders' cash |
274 |
-44 |
|
263 |
835 |
680 |
|
Australasia |
|
|
106 |
160 |
187 |
265 |
214 |
|
Dividends and share buy-backs |
0 |
-41 |
|
-21 |
-31 |
-65 |
EBIT margin |
|
16% |
23% |
24% |
29% |
23% |
|
Surplus (deficit) cash |
274 |
-85 |
|
242 |
804 |
615 |
|
Americas |
|
|
283 |
254 |
309 |
408 |
335 |
|
Cash flow ratios |
|
|
|
|
|
|
EBIT margin |
|
27% |
23% |
27% |
32% |
26% |
|
|
|
|
|
|
|
||
Other |
|
|
-5 |
3 |
16 |
16 |
18 |
|
Working capital turnover, days |
25 |
29 |
|
52 |
34 |
33 |
Adjusted EBIT |
|
849 |
790 |
864 |
1,328 |
1,165 |
|
FCF yield |
5.8% |
0.0% |
|
8.1% |
13.4% |
11.7% |
|
Income statement ratios |
|
|
|
|
|
|
|
Equity shareholders' yield |
4.7% |
-1.0% |
|
6.8% |
14.1% |
11.5% |
|
|
|
|
|
|
|
|
Capex/EBITDA |
45.8% |
55.1% |
|
44.5% |
42.9% |
41.8% |
||
EBITDA margin |
|
39% |
36% |
38% |
45% |
41% |
|
Cash conversion |
2.5x |
-1.6x |
|
1.1x |
1.3x |
1.2x |
|
EBIT margin |
|
19% |
16% |
19% |
25% |
22% |
|
Valuation |
|
|
|
|
|
|
|
HEPS Growth |
|
250% |
-78% |
863% |
174% |
-14% |
|
|
|
|
|
$mn |
|
||
Dividend payout ratio |
|
37% |
86% |
13% |
10% |
9% |
|
SoTP DCF fair value and calculation of TP |
|
|
|
ZAR/sh |
|||
Input assumptions |
|
|
|
|
|
|
|
South Africa |
|
|
|
|
1,050 |
36.2 |
|
|
|
|
|
|
|
|
Continental Africa |
|
|
|
|
3,939 |
135.6 |
||
Gold, $/oz |
|
|
1,248 |
1,258 |
1,269 |
1,350 |
1,338 |
|
Australasia |
|
|
|
|
1,420 |
48.9 |
ZAR/$ |
|
|
14.70 |
13.31 |
13.24 |
14.31 |
14.14 |
|
Americas |
|
|
|
|
1,726 |
59.4 |
$/AUD |
|
|
1.34 |
1.30 |
1.34 |
1.38 |
1.28 |
|
Corporate and other |
|
|
|
|
-2,100 |
-72.3 |
$/BRL |
|
|
3.49 |
3.19 |
3.65 |
3.78 |
3.50 |
|
Operating value |
|
|
|
|
6,036 |
207.8 |
$/ARS |
|
|
14.78 |
16.56 |
28.09 |
35.38 |
35.79 |
|
Financial instruments and rehab provision as at 31 December 2017 |
|
-801 |
-27.6 |
|||
Gold production volumes, koz |
|
|
|
|
|
|
|
Enterprise value |
|
|
|
|
5,235 |
180.3 |
|
|
|
|
|
|
|
|
Net debt as at 31 December 2017 |
|
|
|
|
-2,001 |
-68.9 |
||
South Africa |
lumes |
|
967 |
902 |
494 |
468 |
468 |
|
Minority interest |
|
|
|
|
-103 |
-3.5 |
Continental Africa lumes |
|
1,322 |
1,453 |
1,497 |
1,716 |
1,872 |
|
Cash used in share buy-backs during 2018E |
|
|
|
0 |
0.0 |
||
Australasia |
lumes |
|
520 |
560 |
635 |
680 |
688 |
|
Equity value |
|
|
|
|
3,131 |
107.8 |
Americas |
lumes |
|
819 |
840 |
770 |
828 |
828 |
|
|
|
|
|
|
|
|
Rounded to |
|
|
|
|
|
110.0 |
|||||||||
Total lumes |
|
3,628 |
3,755 |
3,396 |
3,692 |
3,856 |
|
Share price on13/2/2019 |
|
|
|
|
|
190.0 |
|
Volume growth |
|
-5.3% |
3.5% |
-9.6% |
8.7% |
4.4% |
|
Expected share price return |
|
|
|
|
|
-42.1% |
|
Calculated breakeven price, $/oz |
|
|
|
|
|
|
|
Plus: expected dividend yield |
|
|
|
|
|
1.1% |
|
|
|
|
|
|
|
|
Total implied one-year return |
|
|
|
|
|
-41.0% |
||
South Africa breakeven |
|
1,103 |
1,270 |
1,204 |
1,092 |
1,147 |
|
|
|
|
|
|
|
|
|
Continental Africa breakeven |
|
877 |
930 |
907 |
954 |
980 |
|
Share price range, ZAR: |
|
|
|
|
|
|
|
Australasia breakeven |
|
1,012 |
1,020 |
943 |
873 |
953 |
|
12-month high on 1-2-2019 |
192 |
12-month low on 23-5-2018 |
100 |
||||
Americas breakeven |
|
864 |
926 |
836 |
823 |
896 |
|
Price move since high |
-0.9% |
Price move since low |
|
89.6% |
|||
Group breakeven |
|
1,036 |
1,088 |
1,010 |
982 |
1,035 |
|
Calculation of WACC |
|
|
|
|
|
|
|
Contribution to FY18E underlying EBITDA |
|
|
|
|
|
|
|
|
|
|
|
|
|||
|
|
|
|
|
|
WACC |
7.4% |
Cost of debt |
|
|
5.0% |
||||
|
Corporate and other |
South Africa |
|
|
|
Risk-free rate |
4.0% |
Tax rate |
|
|
30% |
||||
|
|
|
|
Equity risk premium |
5.0% After-tax cost of debt |
|
1.1% |
||||||||
|
|
|
1% |
|
5% |
|
|
|
|
||||||
|
|
|
|
|
|
|
|
|
Beta |
1.00 |
Debt weighting |
|
30% |
||
Americas |
|
|
|
|
|
|
Cost of equity |
9.0% |
Terminal growth rate |
|
2.0% |
||||
30% |
|
|
|
|
|
|
|
|
|
|
|
|
|
|
|
|
|
|
|
|
|
|
|
|
Valuation ratios |
|
|
|
|
|
|
|
|
|
|
|
|
|
|
|
Dec-YE |
2016 |
2017 |
|
2018E |
2019E |
2020E |
|
|
|
|
|
|
|
|
|
P/E multiple |
52.9x |
177.4x |
|
16.2x |
9.0x |
10.5x |
|
|
|
|
|
|
|
|
|
Dividend yield |
0.7% |
0.5% |
|
0.8% |
1.1% |
0.9% |
|
|
|
|
|
|
|
|
|
EV/EBITDA |
4.4x |
3.7x |
|
3.3x |
3.0x |
2.8x |
|
|
|
|
|
|
Continental Africa |
P/B |
2.2x |
1.7x |
|
1.4x |
1.8x |
1.5x |
||
|
Australasia |
|
|
|
NAV per share, $ |
6.6 |
6.4 |
|
6.6 |
8.1 |
9.3 |
||||
|
20% |
|
|
|
|
44% |
|
|
NAV per share, ZAR |
97 |
85 |
|
88 |
116 |
132 |
|
|
|
|
|
|
|
|
|
|||||||
Source: Bloomberg, Thomson Reuters, Renaissance Capital estimates
58